Save 23% ($351) & Get a Free 1-1 Call with our Team ⏰ : 0d 2h 59m 44s

Key Points:
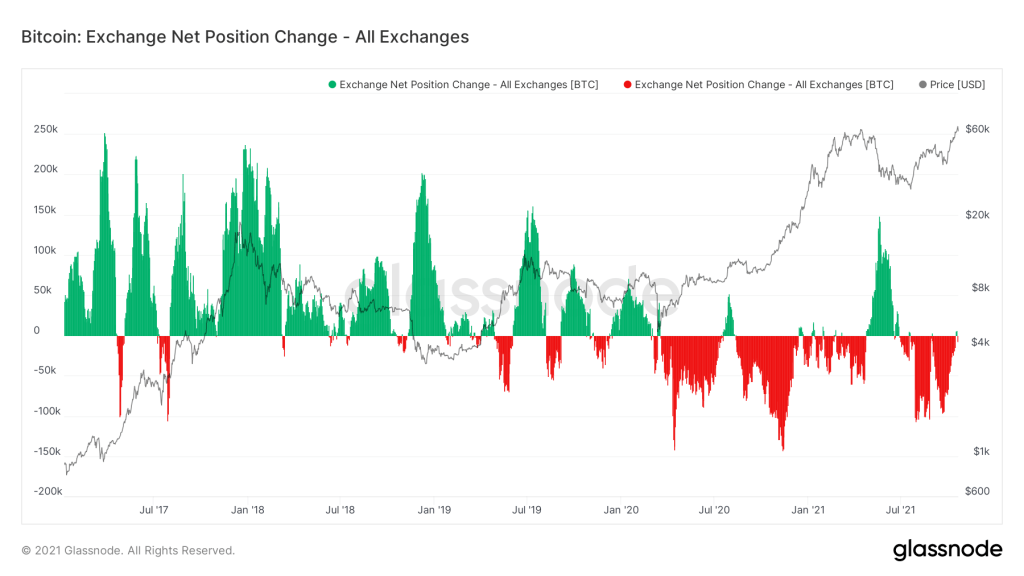
- The Exchange Net Position Change has indicated a slowdown in accumulation as new ATH was created. The recent 10% pullback from the new ATH has spurred some investors to add to their holdings at this perceived discount. As more data is released over the coming days, it will be interesting to see the level of accumulation at this new price range.
- ‘Smart money’ investors (1-2 Year Old Coins) are still hodling with no signs of selling.
- Whales are still accumulating and retain conviction in future upside as indicated by their wallets balances increasing.
As usual, let’s start with the Exchange Net Position Change. This metric allows us to quickly understand what current market sentiment is. Scroll to the bottom of this article if you need to refresh your memory on the metrics we look at in this report. We can see in the graph below that on the rise up to new All-Time-Highs, this past week, we had some small profit-booking by some investors at the new ATHs. This led to the small green bar that can be seen on the far right. Over the last two years every time a new ATH is made it is met with profit booking, as indicated by the small green bars. Subsequently in cases where there is further upside, the accumulation phase restarts as indicated by the large red bars. Note, that the data is always a few days behind (the latest we have is Thursday 21st October), so it will be interesting to see over the next few days when the new data is released, how much accumulation has taken place with this 10% dip from Bitcoin’s All-Time-Highs.
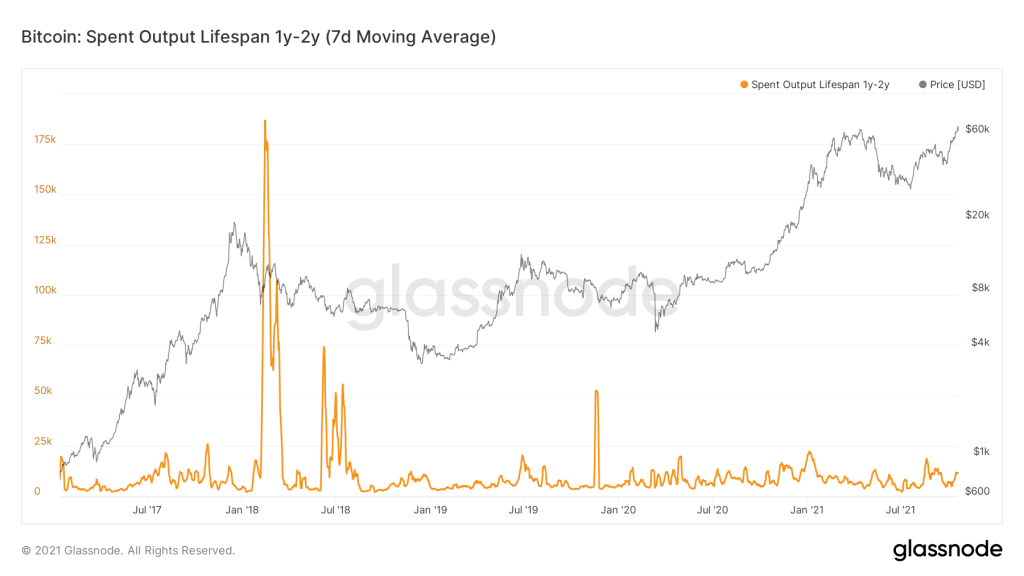
Metric 2 – Lifespan (1-2 Years)
There was a slight uptick in Coins being moved (likely sold) into Bitcoins new price All-Time-Highs over this past week. The magnitude of the spike is minimal compared to other sell offs. It also coincides with those new ATHs. This reflects investors booking profits as also shown from the Exchange Net Position. It can also be an indicator of large scale rebalancing of portfolios. Rebalancing is when a portfolio is kept at a constant ratio of BTC/USD. Conviction still remains as we will see below.
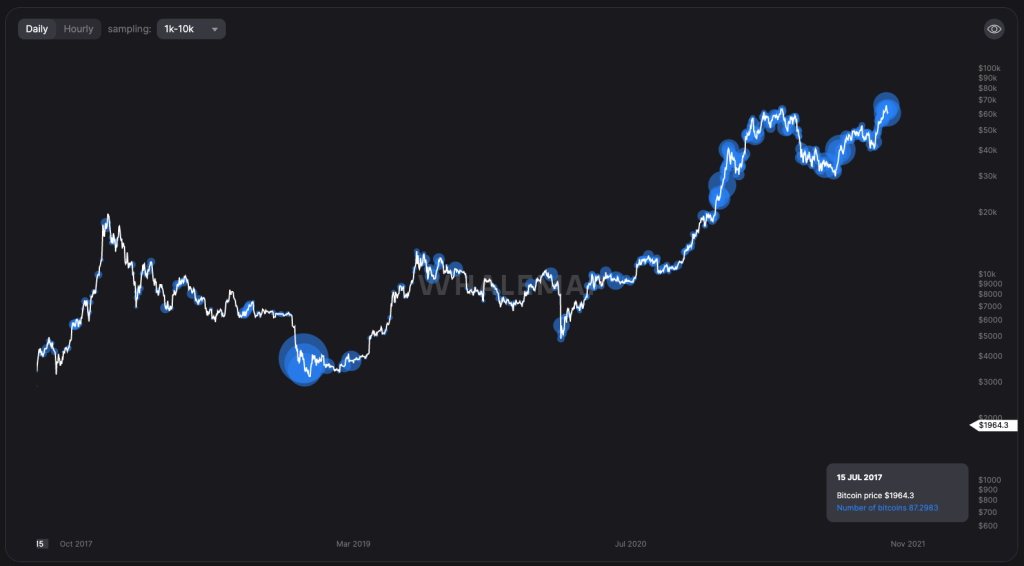
Metric 3 – Large Wallet Inflows
The third Metric we’re going to cover today is the Large Wallet Inflows. Bubbles on the graph indicate locations at which high capital investors (1,000 – 10,000 Bitcoin holders) accumulated the Bitcoin that they are currently holding. The larger the bubble the larger the purchase.
It is clear that the levels of accumulation at 60,000 USD are significant. Note how the size of the bubble increases substantially from 2021 onwards. And it’s only now we’re seeing institutional interest translate into buying with the ETF news. The more is accumulated, the smaller the circulating supply, leading to supply squeezes. We all know what a supply squeeze does to the price.
Metric Context
The Exchange Net Position Change measures the flow of Bitcoins in and out of Exchange Wallets. Red bars on the graph indicate a Net Outflow of Bitcoins from Exchange Wallets to Cold Storage Wallets – a bullish sign as investors are withdrawing their Bitcoins and Hodling them. Green bars on the graph indicate a Net Inflow of Bitcoins into Exchanges from Cold Storage Wallets – a bearish signal as investors are moving their Coins into Exchanges to be sold, creating selling pressure.Lifespan (1-2 Years) is the total number of spent outputs that were created between 1 and 2 years ago. In simpler terms, this is the Coins that were purchased between 1 and 2 years ago that haven’t moved been transacted with since. Effectively long-term hodlers.
Recommended from Cryptonary


