Save 23% ($351) & Get a Free 1-1 Call with our Team ⏰ : 0d 2h 59m 43s

- Increasing geopolitical and macro headwinds may prevent significant buy-side demand and momentum from coming into the market.
- The Exchange Net Position Change shows increased levels of accumulation however, we still note that this has been mostly done by the smaller wallets rather than the larger players.
- Larger/institutional players have actually been risking-off further, hence we are seeing significant outflows from the Purpose ETFs – a 20% drawdown in the amount of Bitcoins in the ETF over the past few weeks.
Macro
Before we dig into the on-chain data, it is important to assess the economic headwinds over the following weeks. The next FED meeting is May 3rd, 2022, where it is expected that interest rates may increase by 0.5% and the FED will also announce plans to reduce its Balance Sheet. An aggressive FED at this meeting, will likely see markets retract. With this being known, professional investors will likely not be risking-on (buying risky assets, such as crypto and equities) between now and the FED Meeting, chances are they will wait to see the outcome and likely deploy any capital sat on the sides during any significant market dip. This effectively means that the crypto markets may struggle to get any meaningful momentum that would be needed to take prices drastically higher, as there would not be this aggressive buying from the cohort of investors that manage the largest bucks.
Metric 1 – Exchange Net Position Change
With the above macro details now known, it must also be noted that much of the on-chain data looks relatively healthy. The first of these data metrics is the Exchange Net Position Change. This week we have shown a zoomed-out version of this metric showing all the way back to the beginning of 2017.
Bitcoin - Exchange Net Position Change
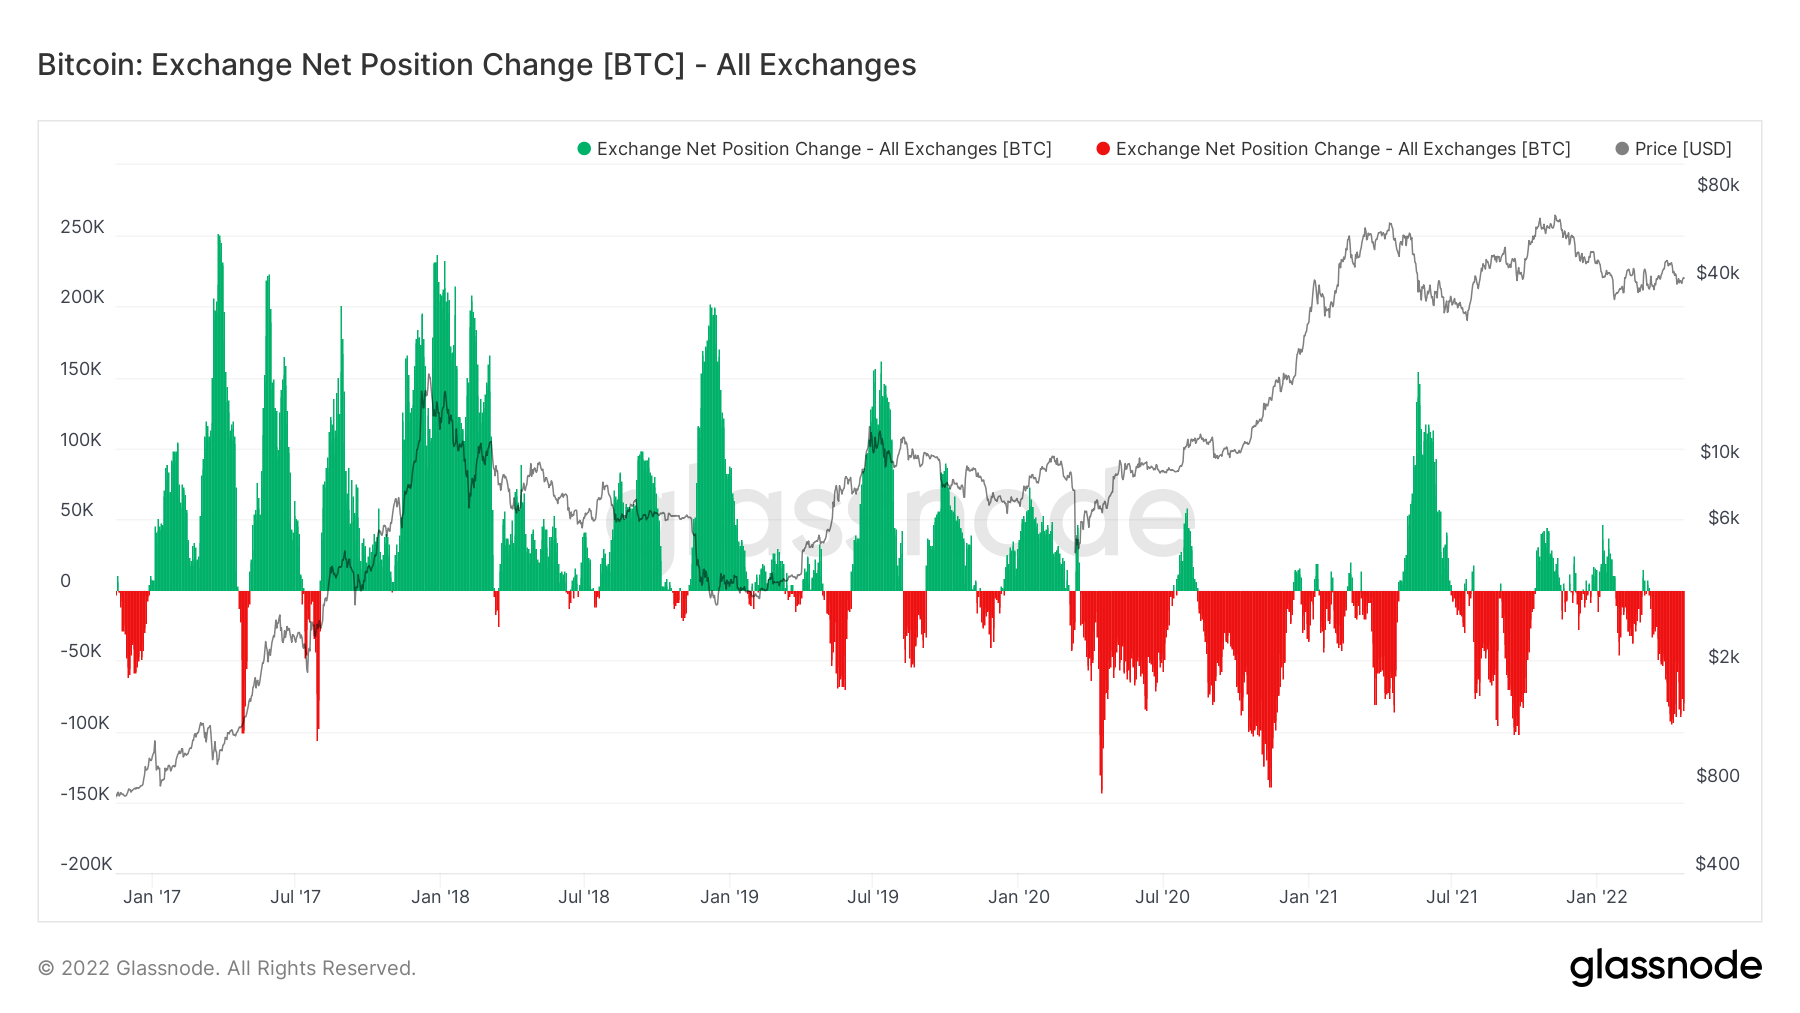
We can see from the above metric that large outflows have only occurred in a number of occasions; Q2 2020, Q4 2020, Q3 2021 and now Q1 2022. There was also a significant outflow of Bitcoin from Exchanges at the prior all-time-high during May 2021, however this was not significant in size of the net outflows and was mostly retail driven. Overall, Bitcoins are being accumulated.
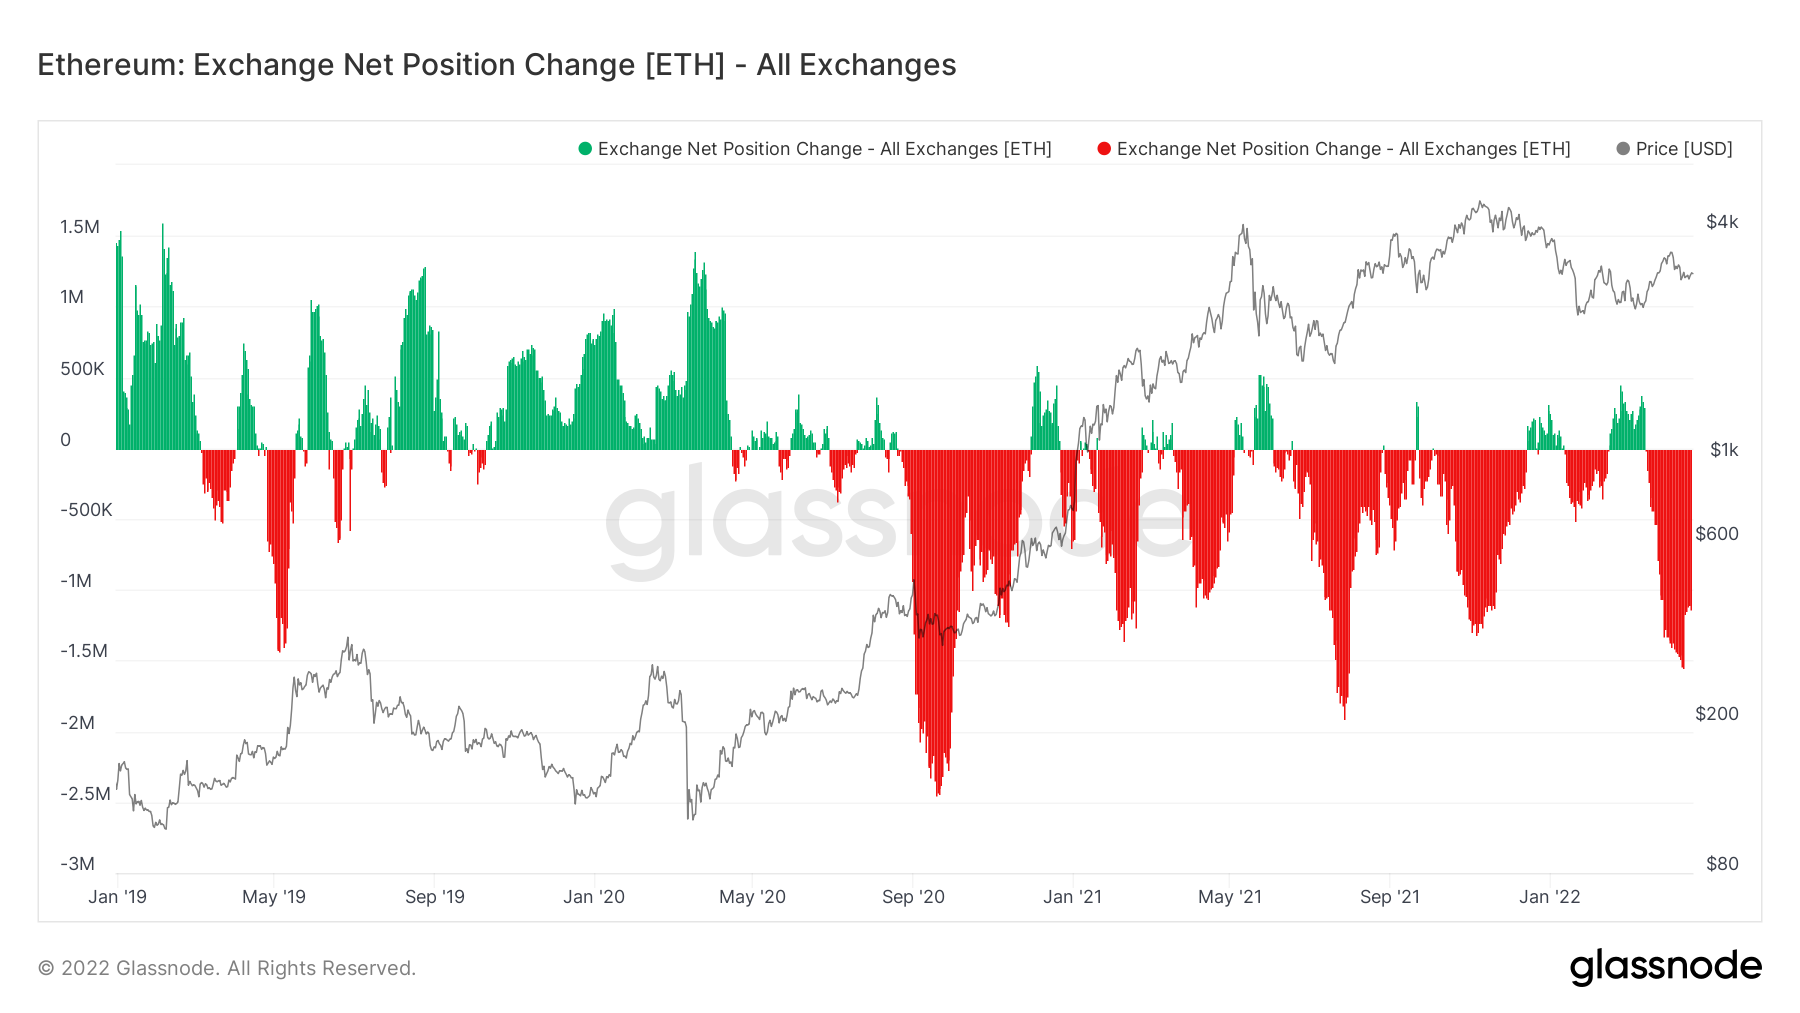
If we look at the same metric but for Ether and more zoomed-in (beginning at the start of 2019), we can see that there have also been times of large net outflows of Ether from Exchanges, and we are seeing another now. In the past, most have led to enough demand sweeping up supply that prices rise, the only anomaly here is the all-time-high for Ether in November 2021.
Ether – Exchange Net Position Change
Metric 2 – Wallets
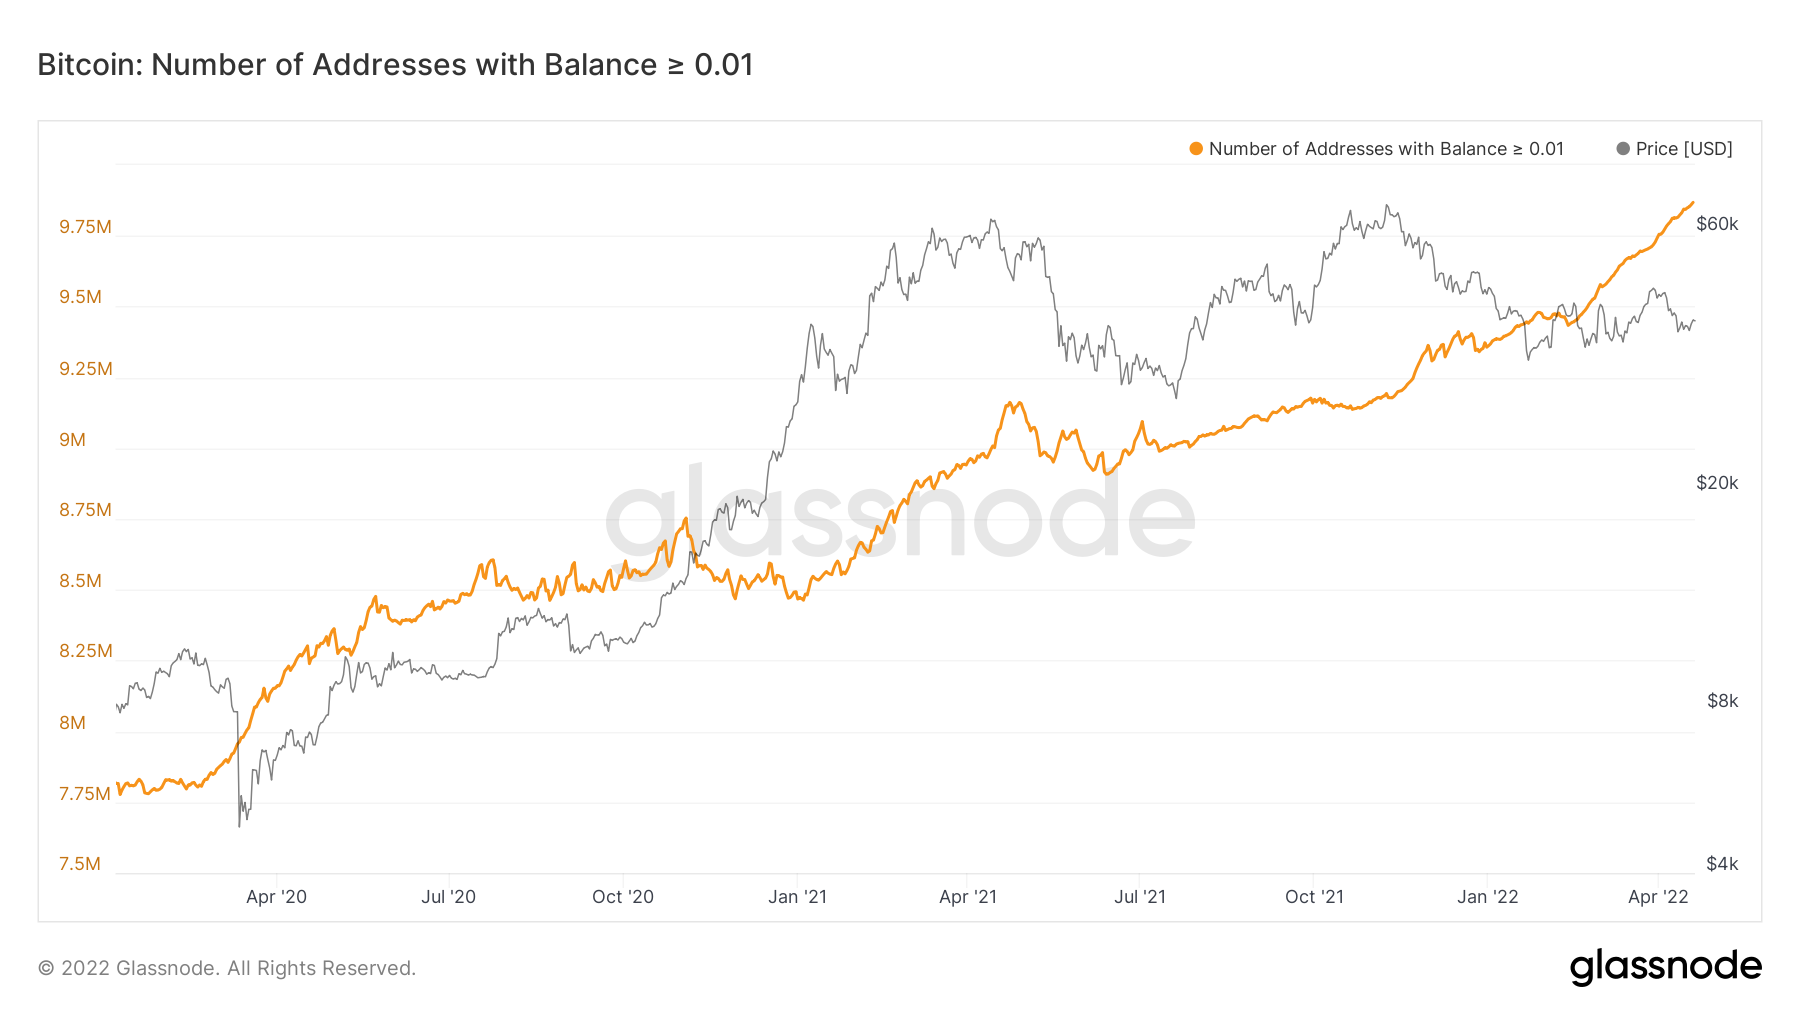
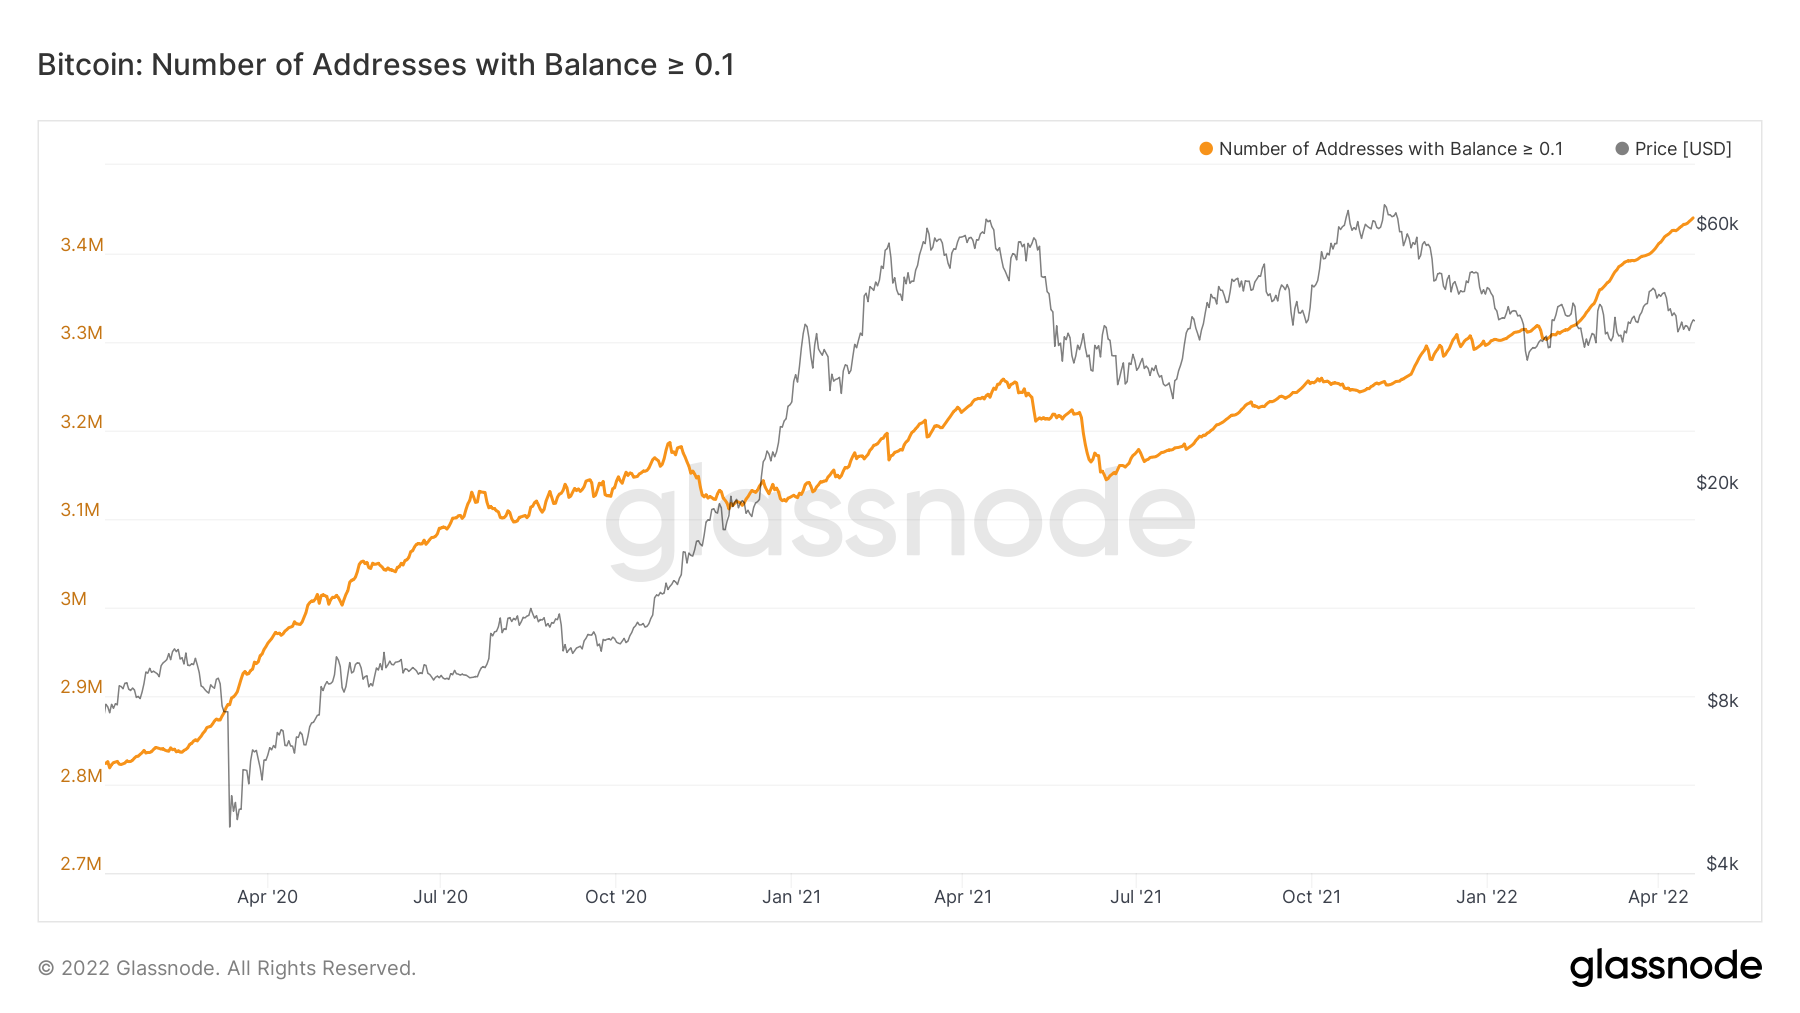
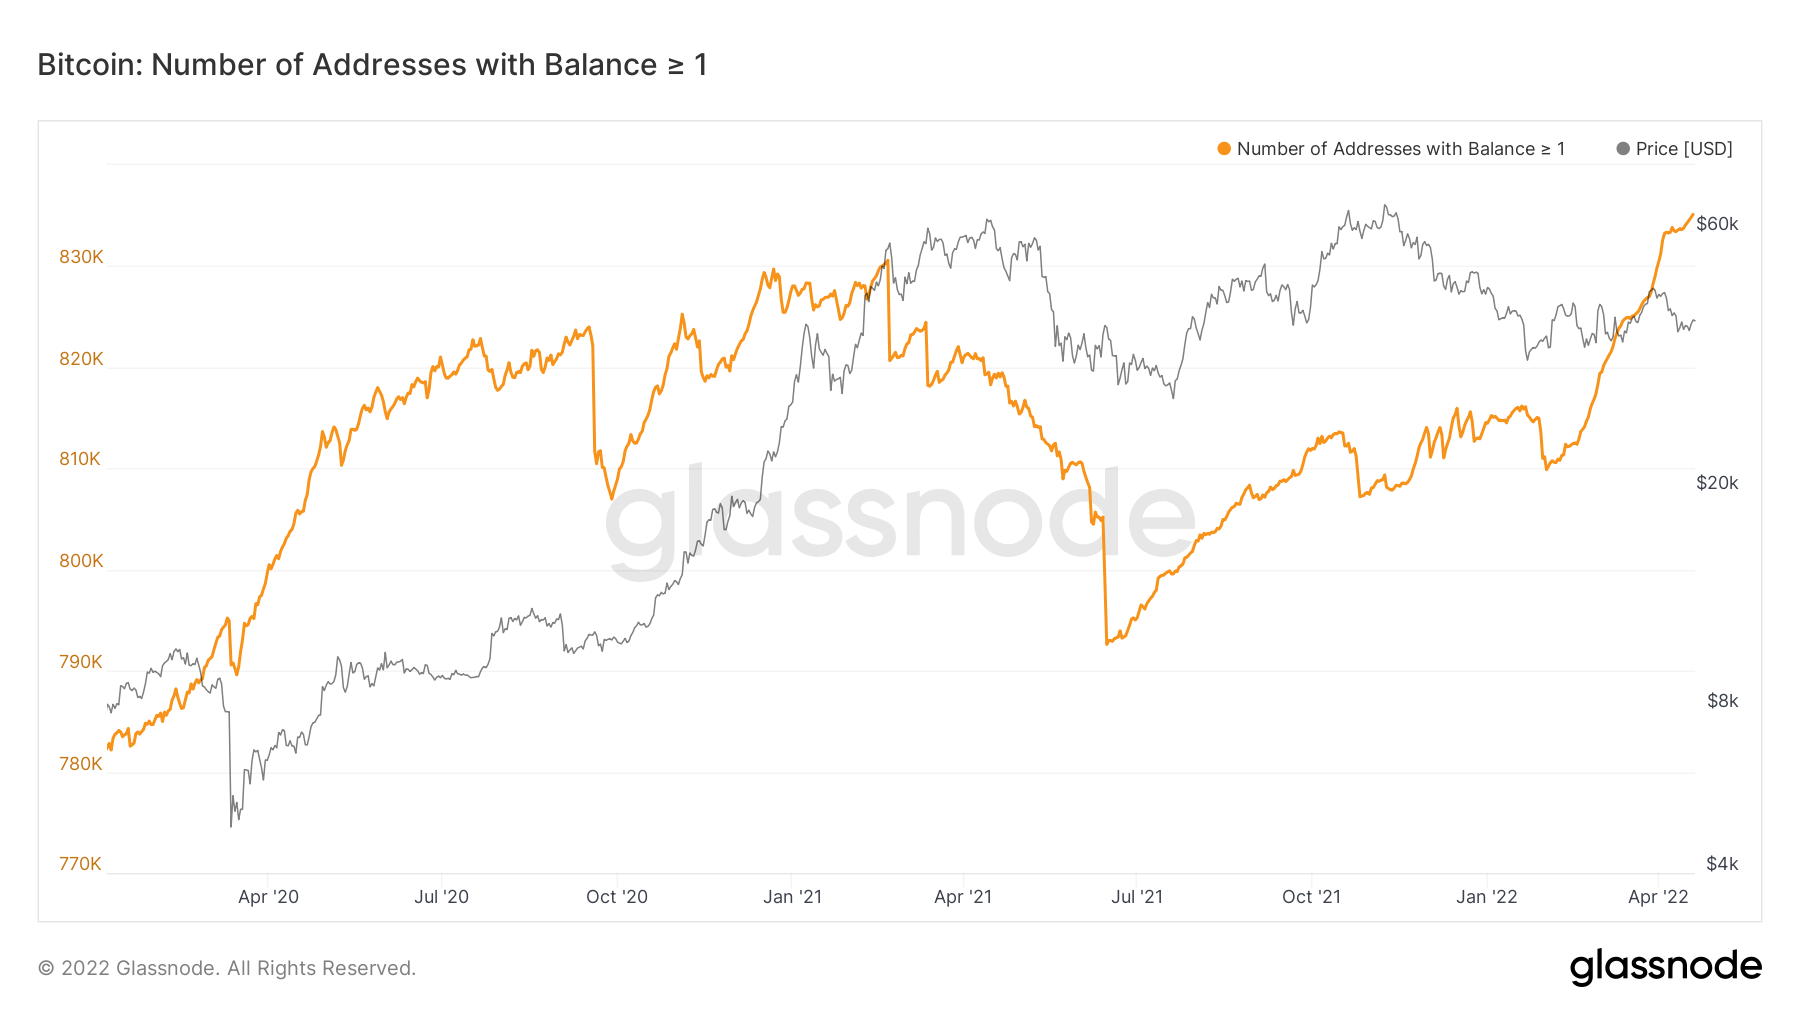
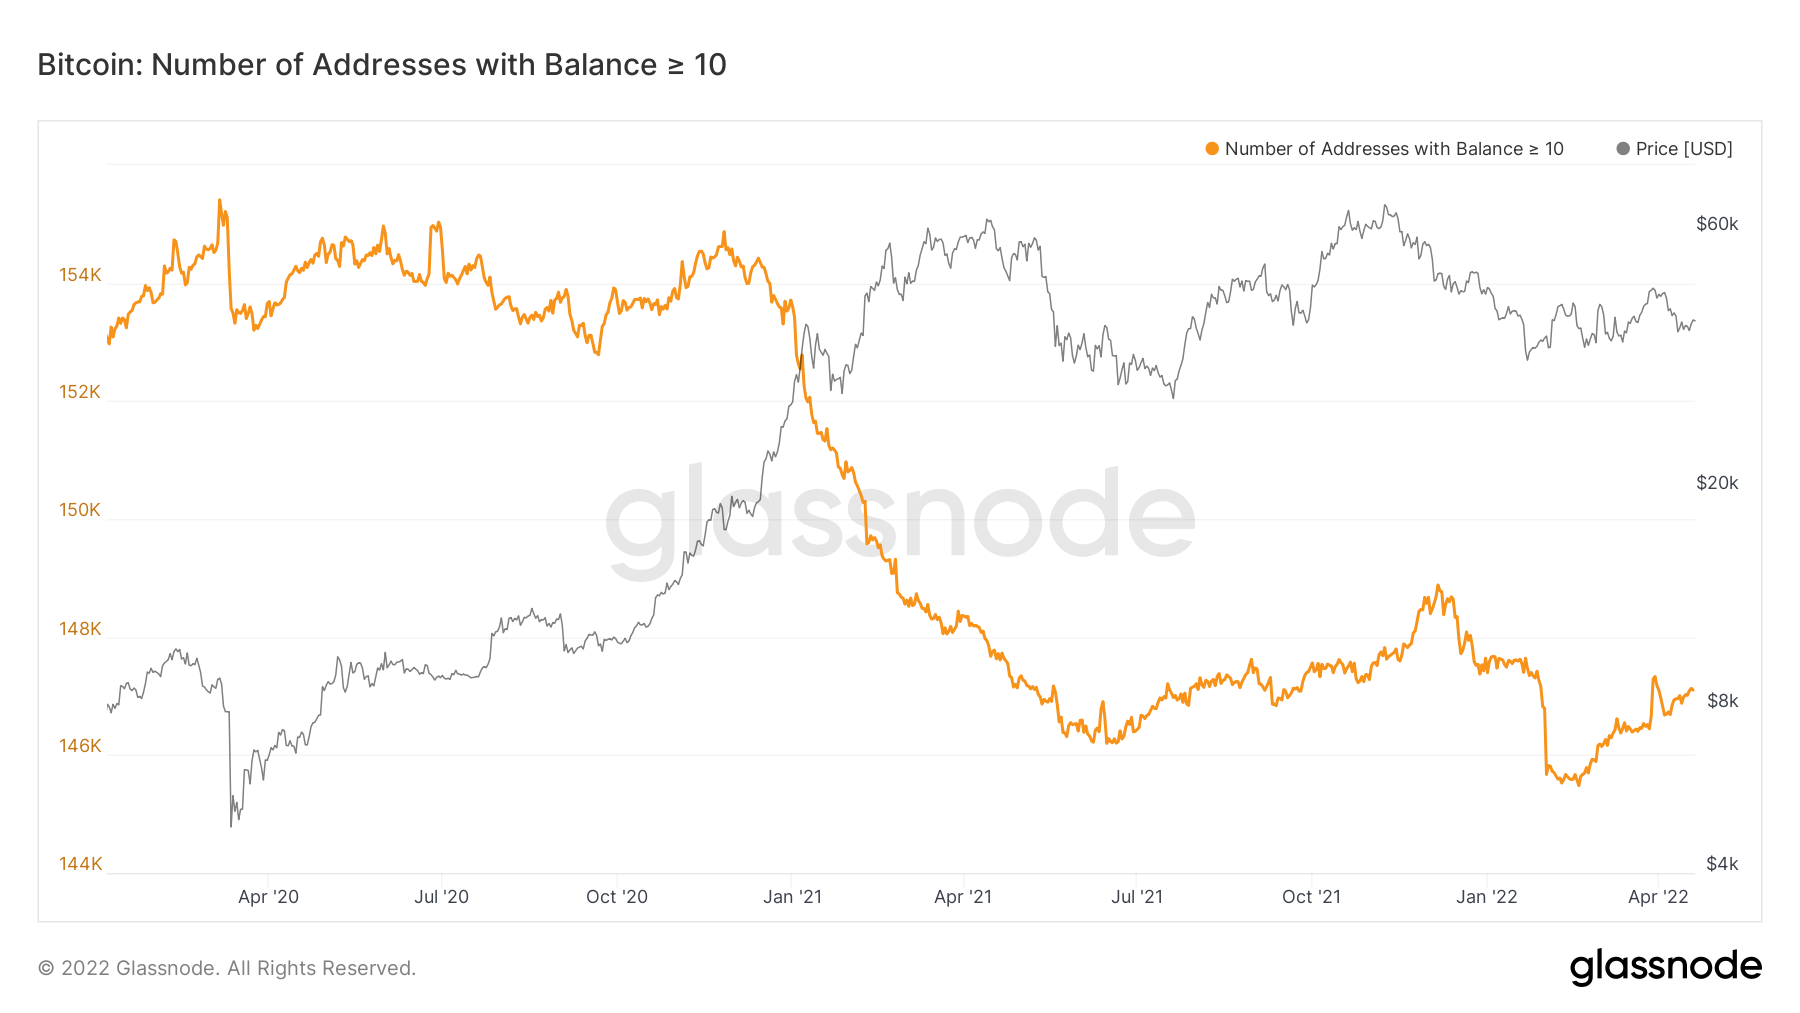
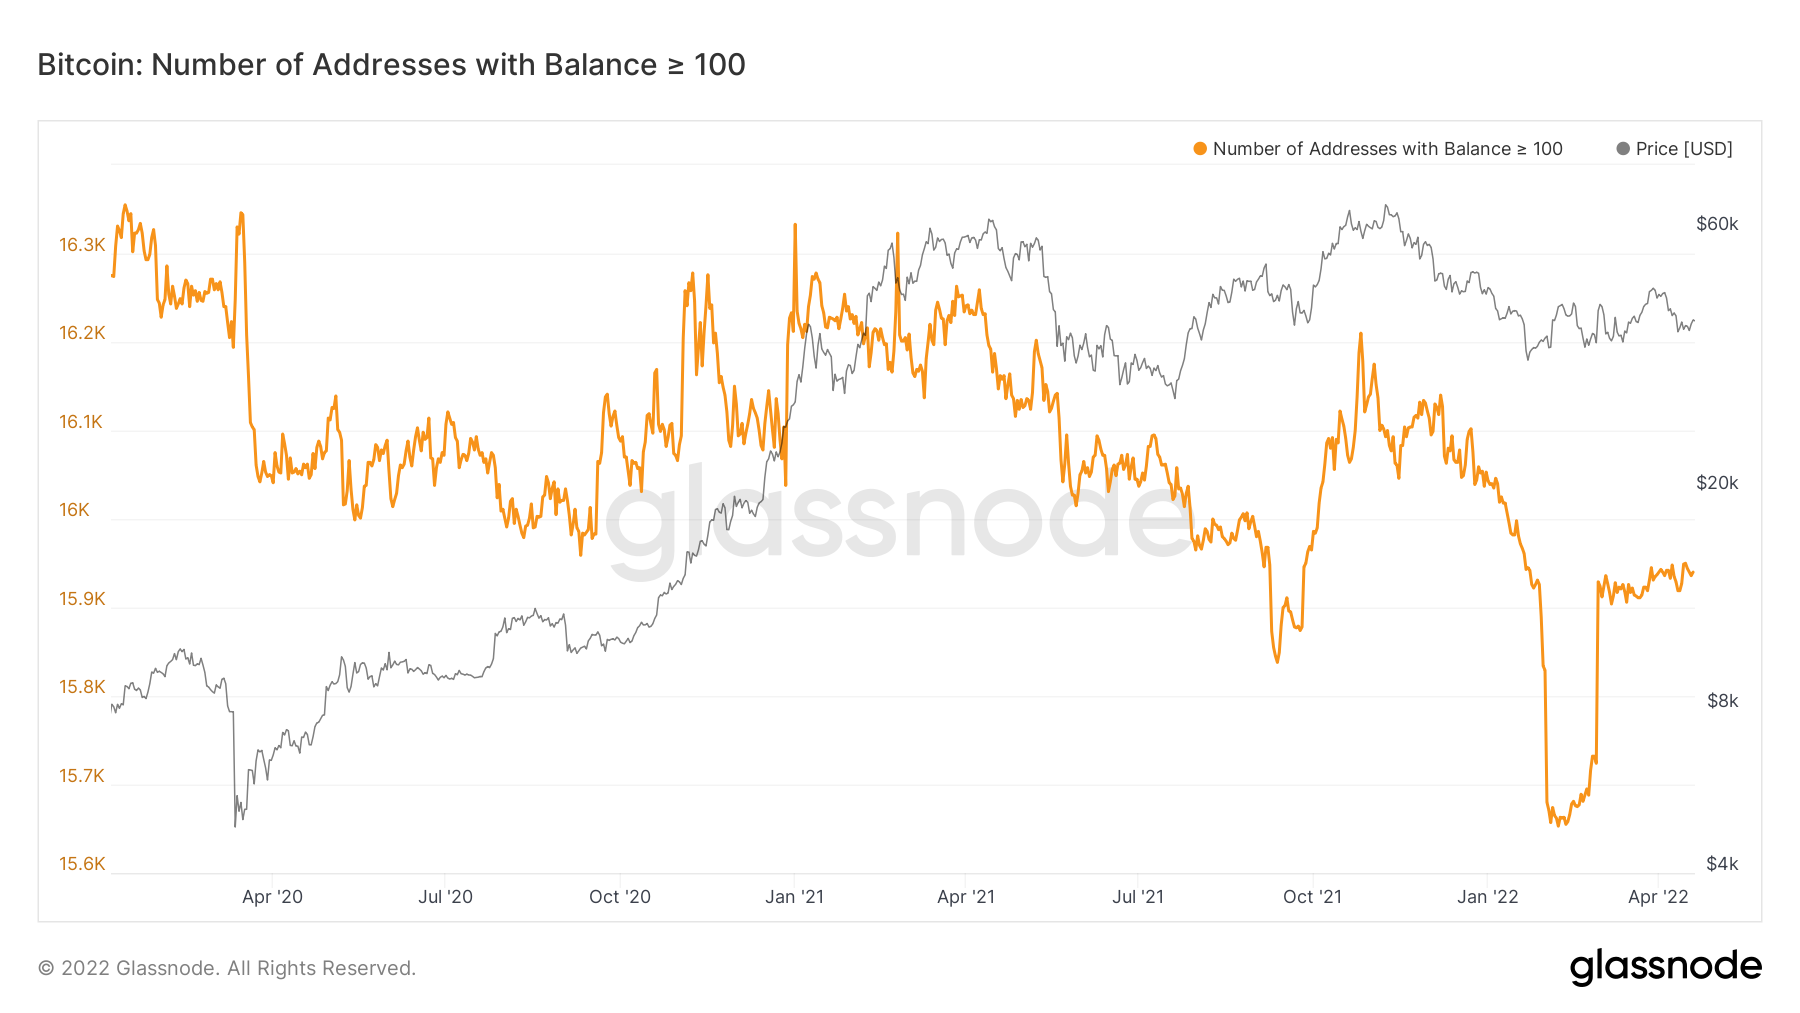
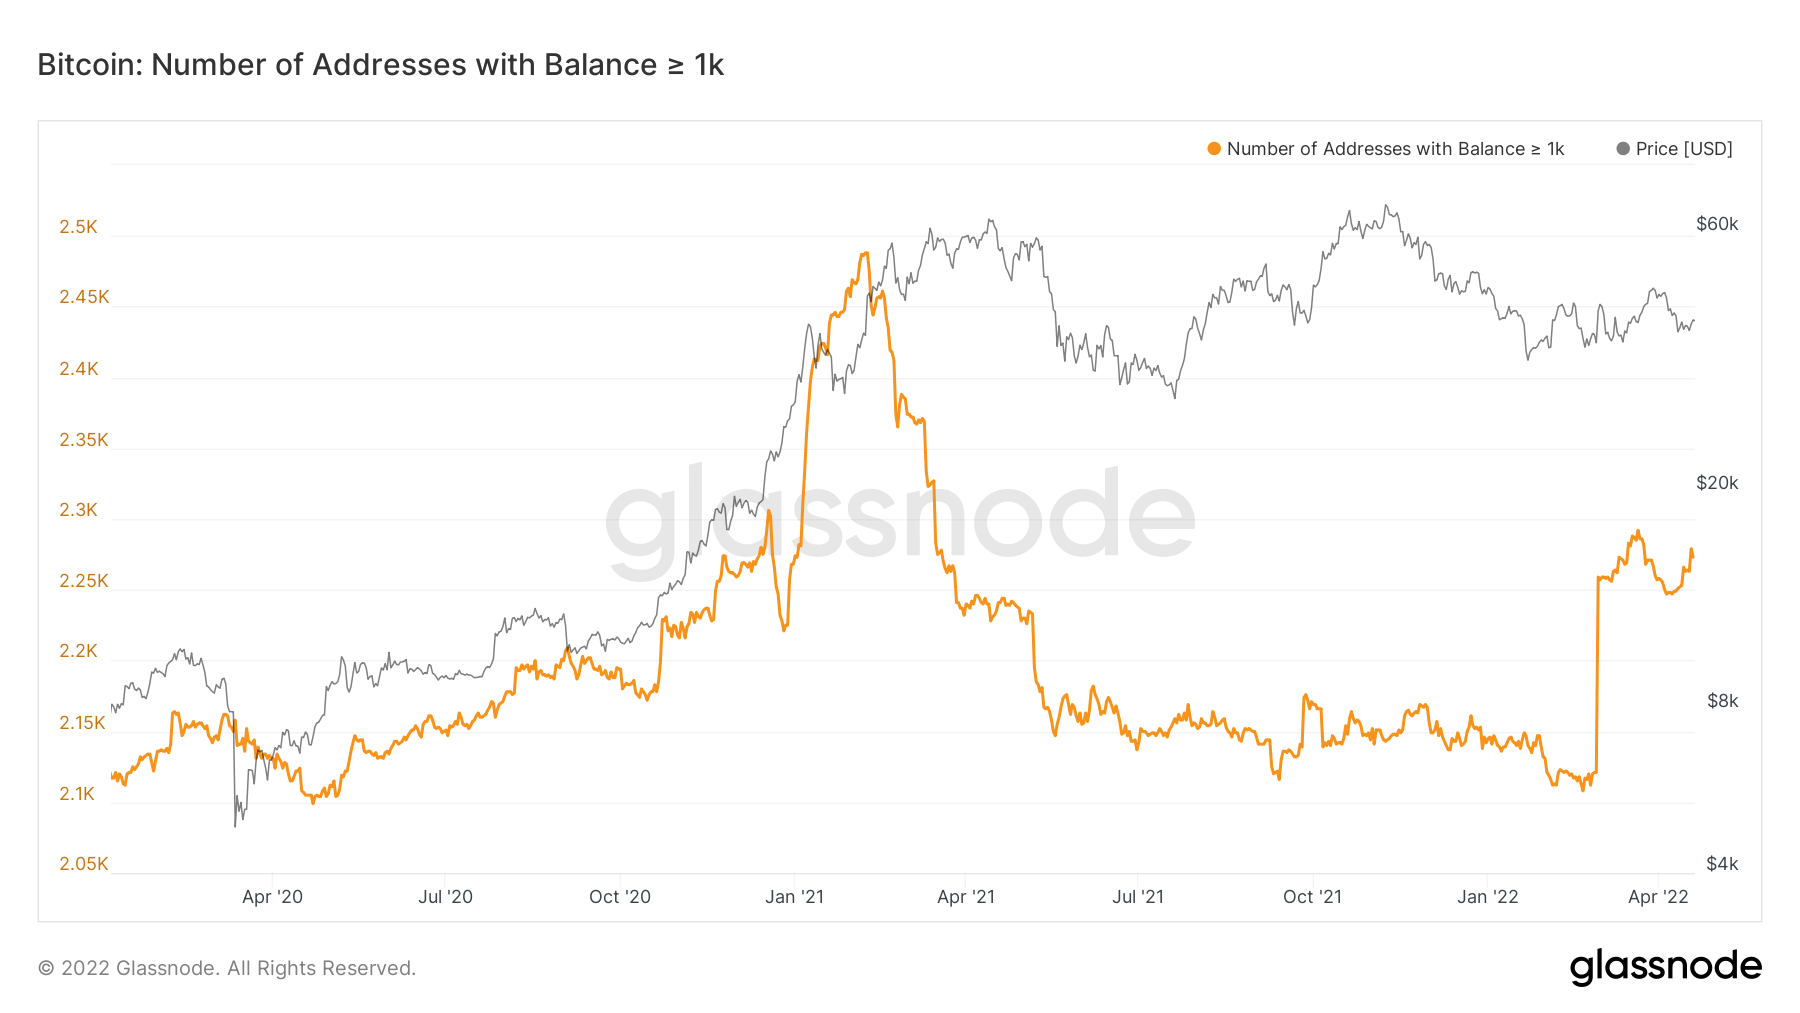
We will now turn our attention to the wallet cohorts to see where this accumulation (as seen on the Exchange Net Position Change) has taken place. We can see from the below charts that most of the accumulation has taken place by the smaller wallet cohorts (wallets holding less than 100 Bitcoin), as we see these number of wallets continuing to increase. It must be noted that the cohort tracking the number of wallets holding more than 100 Bitcoin has been range-bound at low levels; this cohort is not responsible for the accumulation. We have seen in the last day the wallet cohort tracking the wallets with more than 1,000 Bitcoin in them has turned up quite sharply, however just not with any real size, but certainly worth continuing to track for now. This would be the first sign that the big boys have begun to re-accumulate again. Up until now though, the graphs below suggest that the strong majority of the accumulation of Bitcoin has been done by the smaller wallet cohorts.
Addresses with Balance > 0.01 Bitcoin
Addresses with Balance > 0.1 Bitcoin
Addresses with Balance > 1 Bitcoin
Addresses with Balance > 10 Bitcoin
Addresses with Balance > 100 Bitcoin
Addresses with Balance > 1,000 Bitcoin
Metric 3 – Institutional Outflows
Another important metric used to see the what the largest Bitcoiners are doing is the Insitutional Flows. These set of metrics track what the institutional money is doing i.e, is it flowing into Bitcoin ETFs or out of them. An inflow into Bitcoin ETFs would suggest that the institutional players are bullish on the space, an outflow, the opposite.
Bitcoin – Purpose Bitcoin ETF Flows
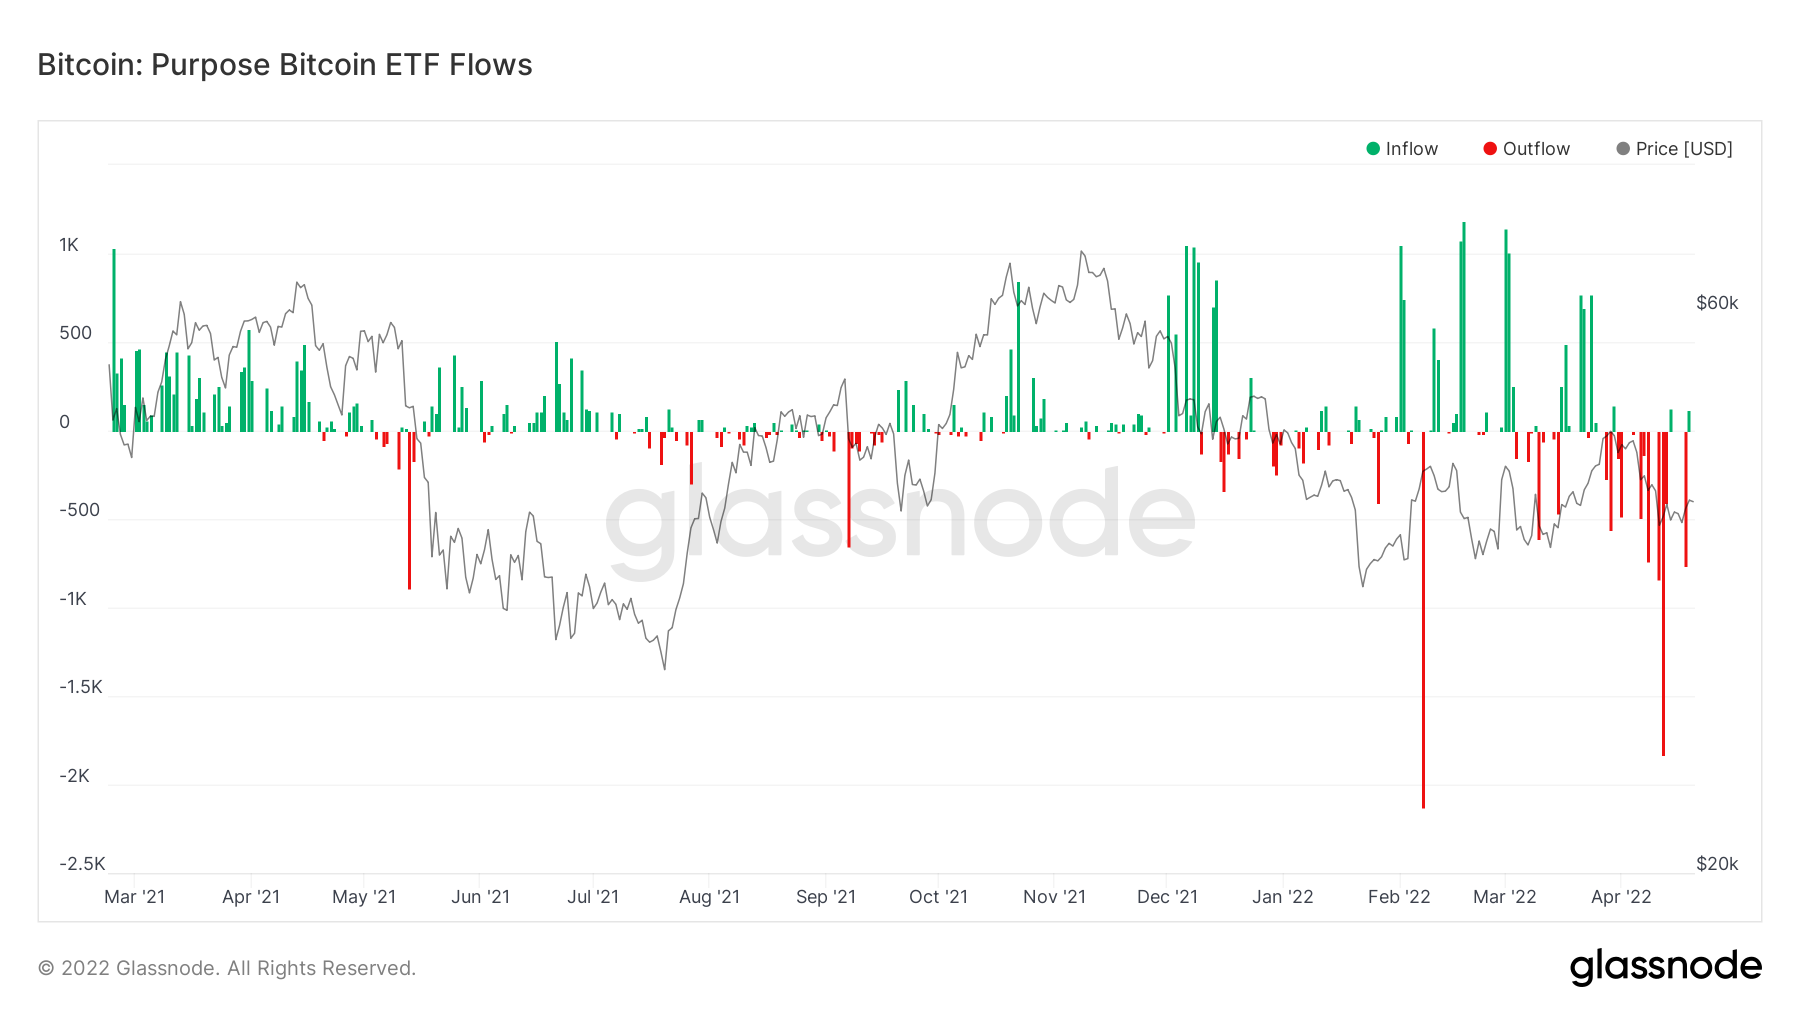
The above graph shows that there have been significant outflows (red spikes) of Bitcoins from this ETF (users likely looking to sell their Bitcoins). We can also look at the Purpose Bitcoin ETF Holdings to see just how many Bitcoins has flown out of this ETF over the past week or so.
Purpose Bitcoin ETF Holdings
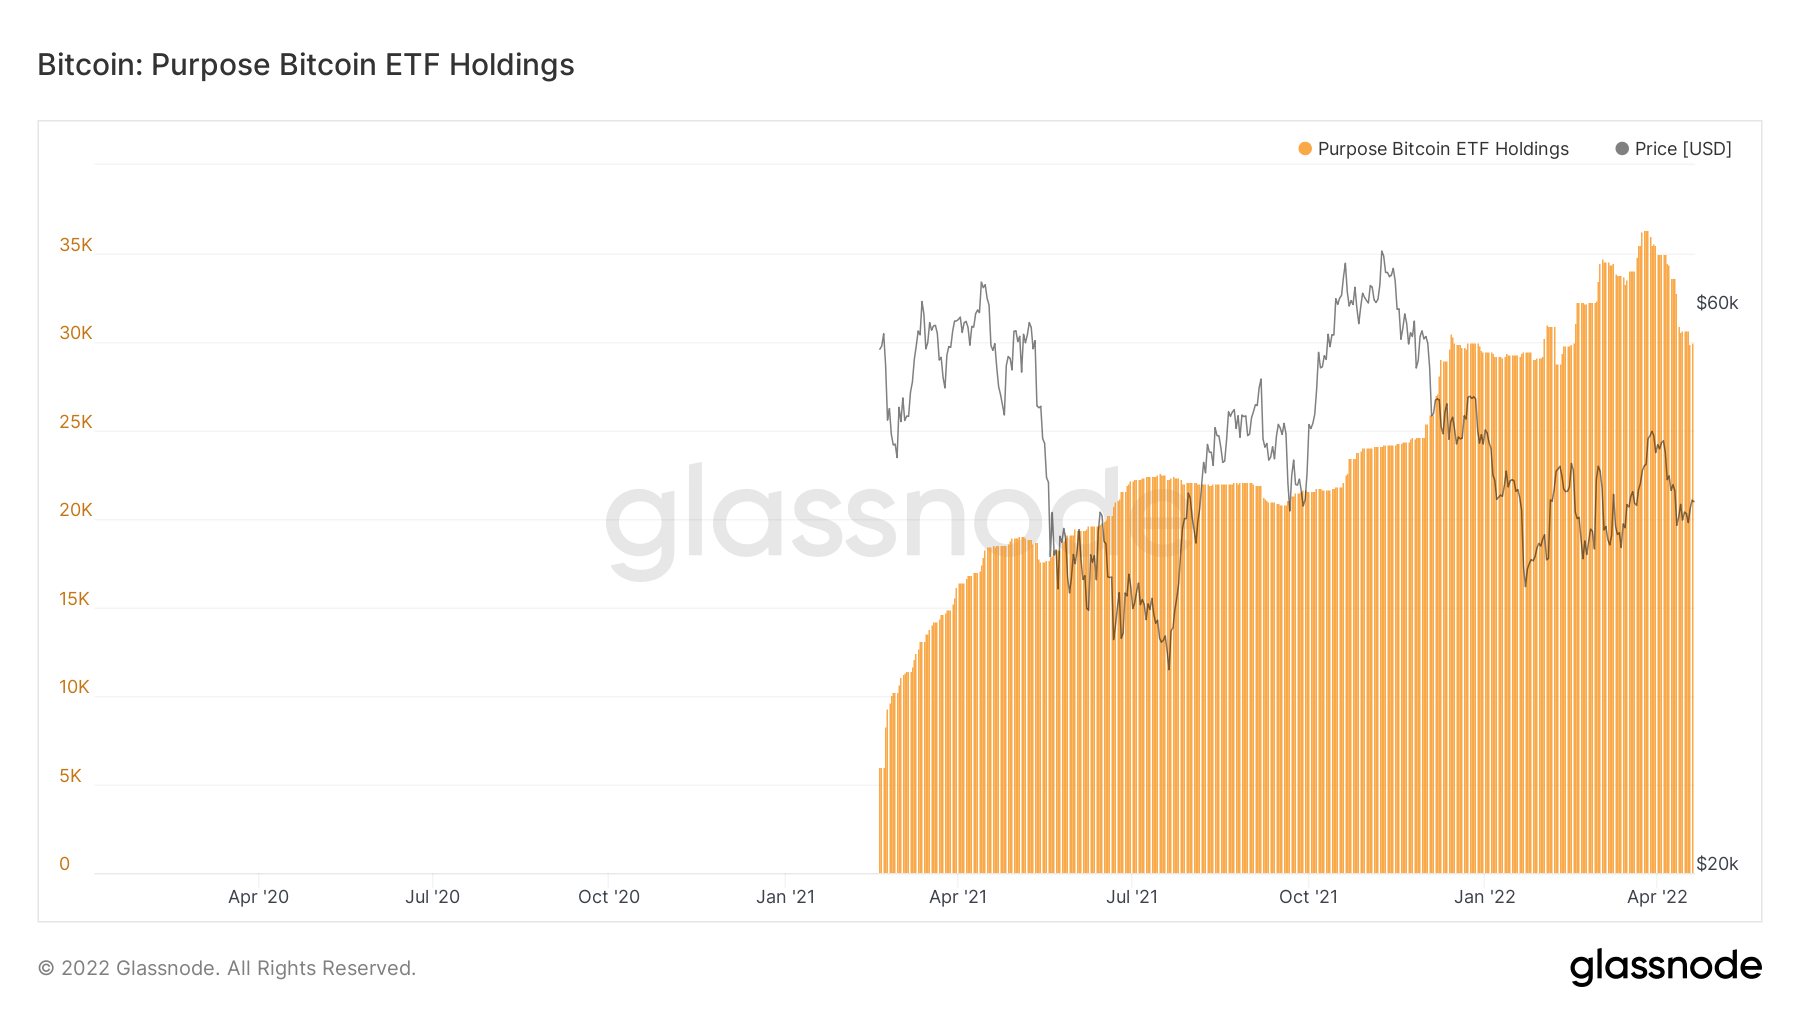
The above graph shows that in the last week of March 2022, there were just over 36,000 Bitcoins in the Purpose ETF, however, just a handful of weeks later, we find that there are less than 30,000 Bitcoin in this ETF. This is a 20% decline in the amount of Bitcoins in the ETF and suggests to us that institutions are likely to be risking off ahead of what looks like an aggressive FED tightening cycle in the coming months.
Metric 4 – MVRV Z-Score
The MVRV Z-Score suggests that there may be some more room to go lower. The score seems to have found a base between 1 and 1.15, however, in all the prior bear markets, we have seen that a base is usually found significantly higher up than the score of 0 before a capitulation event brings the score into the green buy zone. It is possible with the upcoming FED tightening cycle, risking off from the institutional players, increasing geopolitical tension between Russia and Ukraine may see markets retract more.
Bitcoin – MVRV Z-Score

Summary
After laying out the macro conditions the market currently finds itself operating in, the main question will likely be; if demand does not increase to a level that drives prices higher, will the current hodlers continue to hold or will a loss of confidence seep in and cause prices to spiral lower and eventually cause price to test the main Bitcoin cost basis between $24,000 and $27,000? We are seeing the institutional players having already exited the market and have yet to risk back-on to any significant degree. With this being noted, the smaller addresses are the ones that have been most responsible for the accumulation, however, if prices do come back further, will they be willing to hold through significant unrealised losses?
Recommended from Cryptonary


