Save 23% ($351) & Get a Free 1-1 Call with our Team ⏰ : 0d 2h 59m 43s

- Bitcoin price has fallen approximately 22% over the past week, mostly due to LFG selling its Bitcoin holdings.
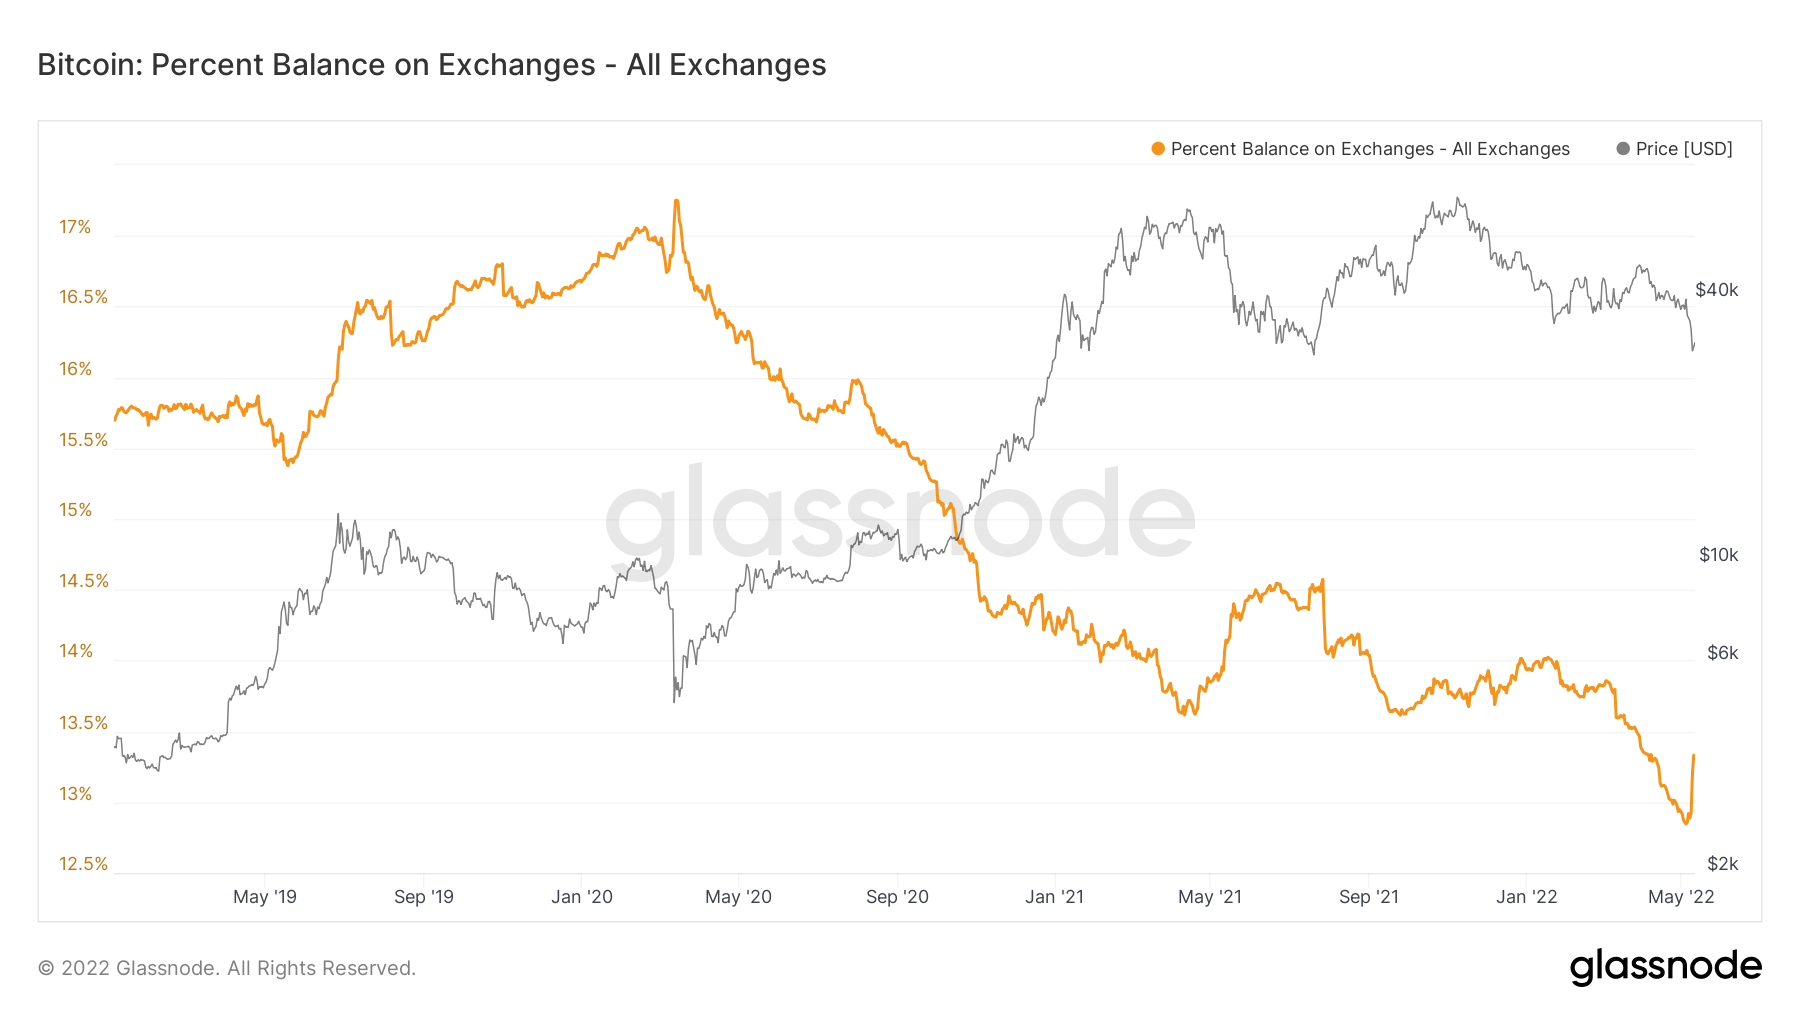
- The percent of Bitcoin supply spiked up on Exchanges this week, breaking its long-term downtrend.
- The smallest wallet cohorts continued to accumulate, but the biggest Bitcoin wallet cohort reduced its exposure to Bitcoin around the $37,000 level (before price plummeted).
- Futures volume and Funding Rates would suggest that Bitcoin’s move down in price was not due to a leverage flush out.
- Metrics such as the Realised Price and MVRV Z-Score suggest a bottom may be in the near term and possibly around the $25,000 - $27,000 mark.
Over the last week, the crypto markets have seen some volatility. Prices of the major asset, Bitcoin, saw a peak of $40,000 exactly a week ago, yet today’s price is hovering around the $31,000 mark, having seen a low of $29,800.
This week’s report is slightly longer than usual as it were necessary to cover a number of metrics in order to assess the chaos we have seen in the market this week.
Macro
Today (11/05/2022), we saw the inflation number come in at 8.3%. On the surface this does not look disastrous, however, the metrics now suggest that inflation is being caused by several factors, making the FED’s job more difficult and potentially pushing them to force a recession as one of the few “tools” left to squash demand and bring inflation down. This makes the next FED meetings even more interesting.
Metric 1 & 2 – Exchange Balances
We will begin this report by assessing the net flows of coins in and out of Exchanges. This week we will investigate two metrics to help formulate an opinion of what has happened over the past few days.
The first metric we will look at is Exchange Balance (Percent). We can see that from effectively the March 2020 market crash, the percent of the total supply of Bitcoin held on Exchanges has constantly been decreasing, suggesting that more are being accumulated and held in cold storage wallets. However, the sell-off in the last few days has seen the percent of Bitcoins held on Exchanges increase dramatically, where it now looks rather significant even on a zoomed-out chart.
Bitcoin – Exchange Balance (Percent)
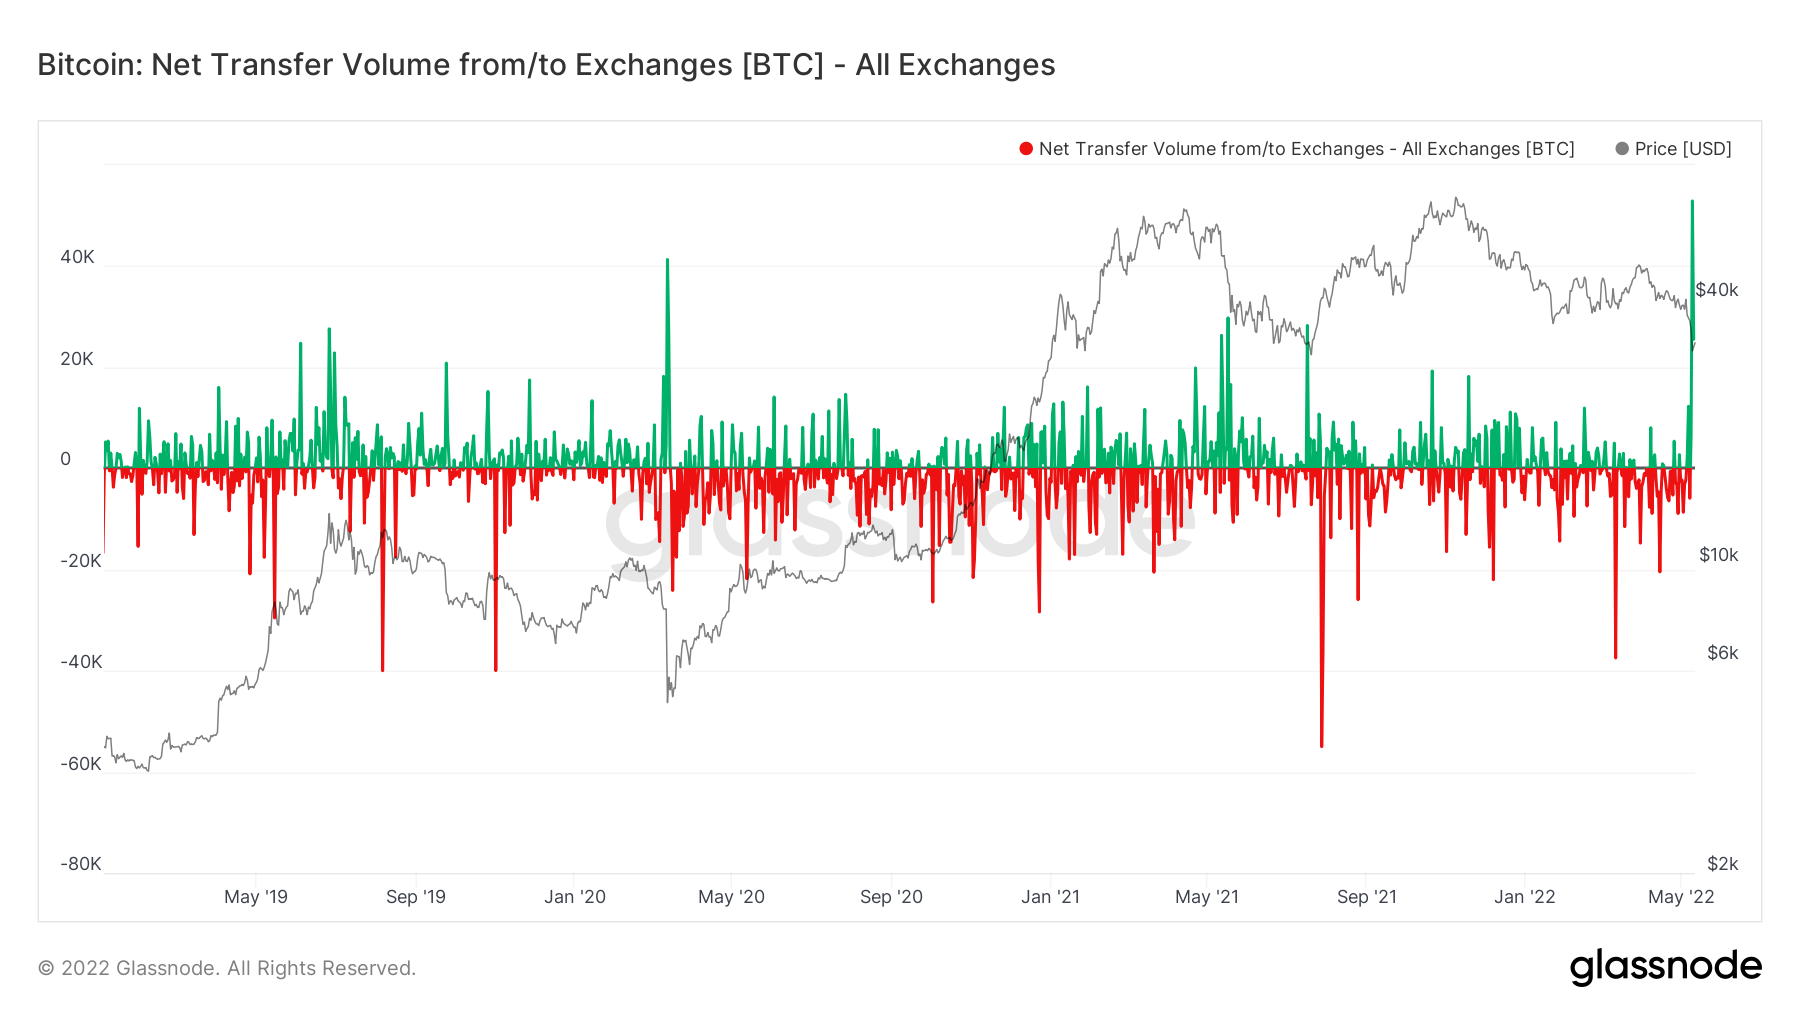
The second metric is the Exchange Netflow Volume. This chart shows the difference of in volume flowing into Exchanges and out of Exchanges. The green spike shows the number of Bitcoins flowing into Exchanges was the largest number in any single day since November 2017. This suggests that many investors in the last days have sold, and have sold possibly in a capitulatory like fashion, however we will continue to assess throughout the report if this was the capitulation event we have been anticipating.
Bitcoin – Exchange Netflow Volume
Metric 2 - Addresses
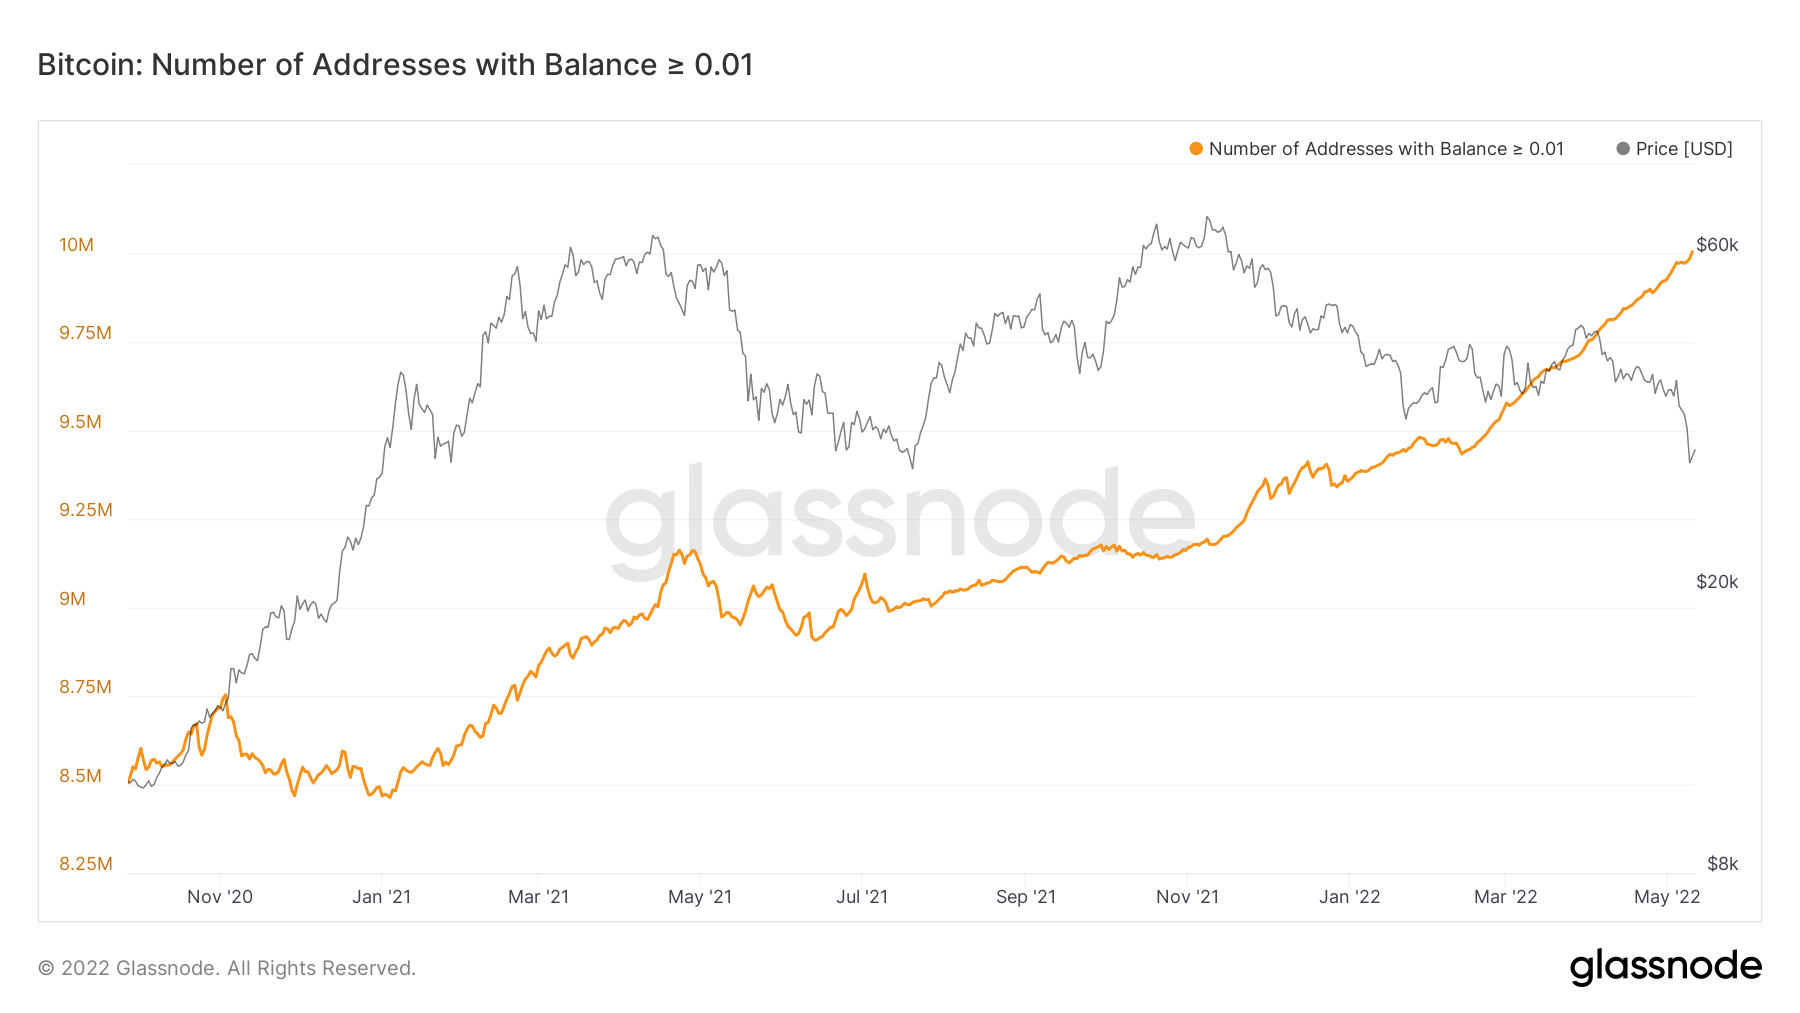
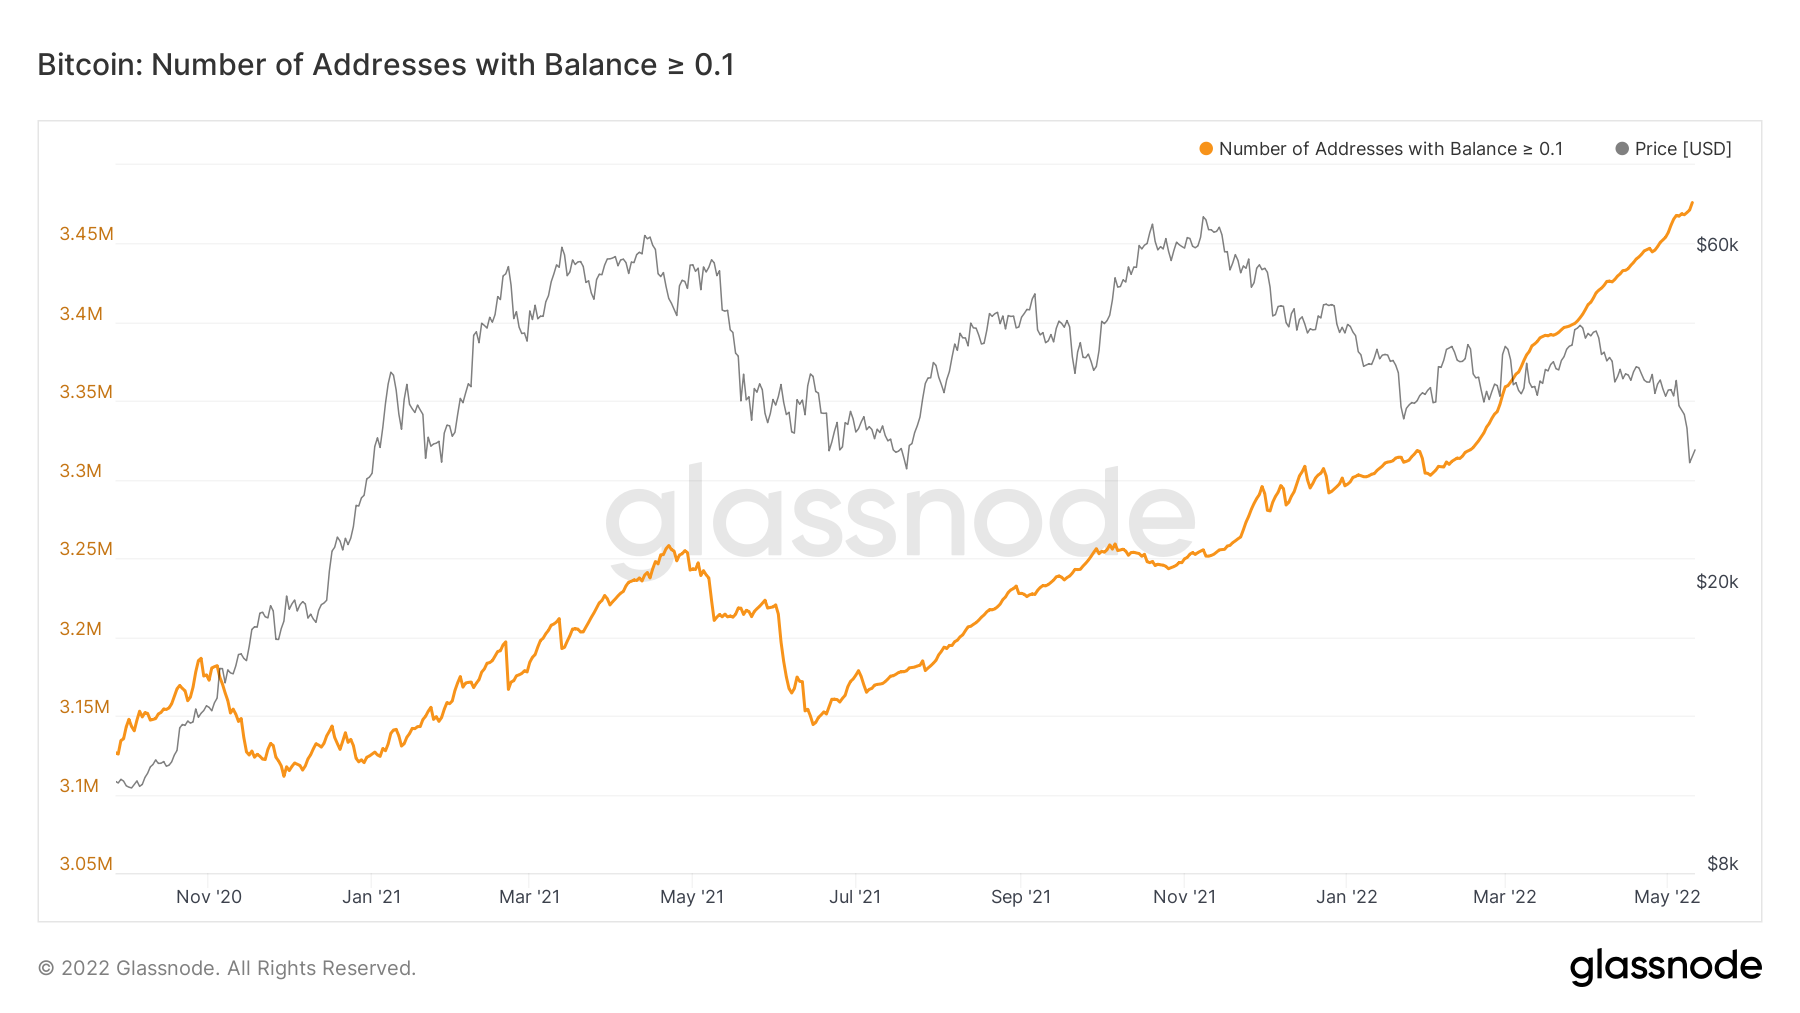
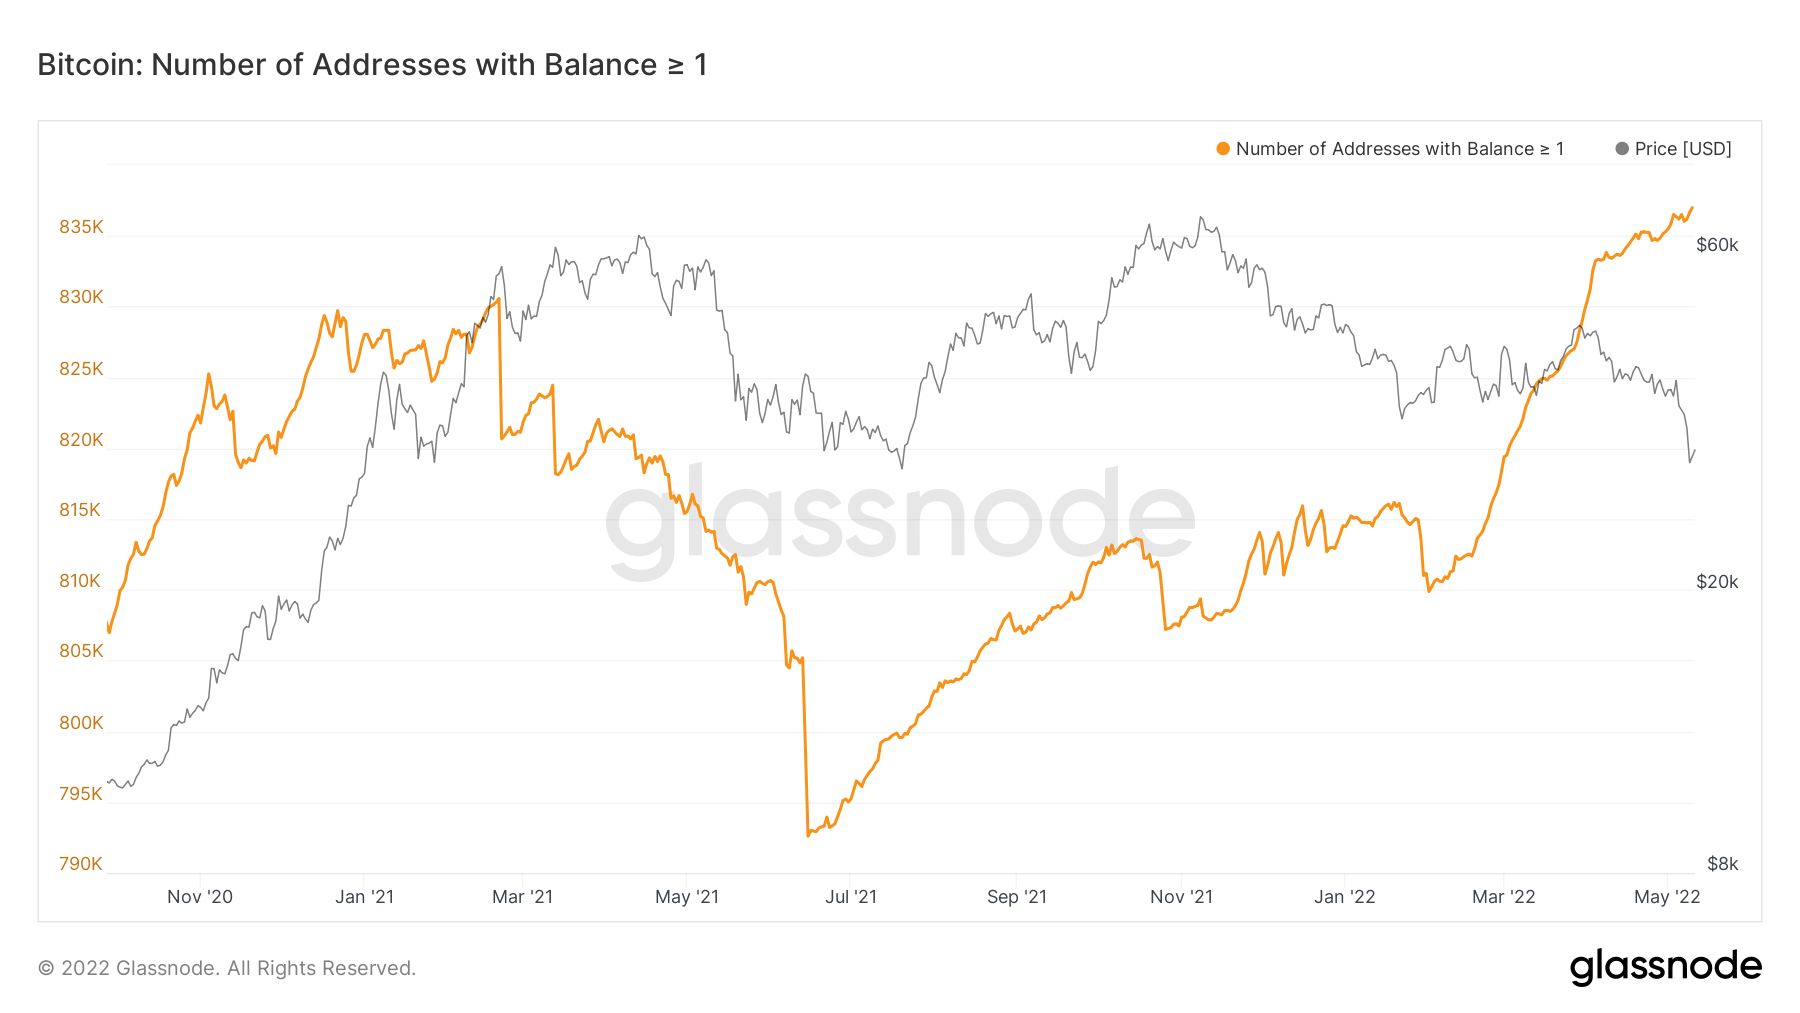
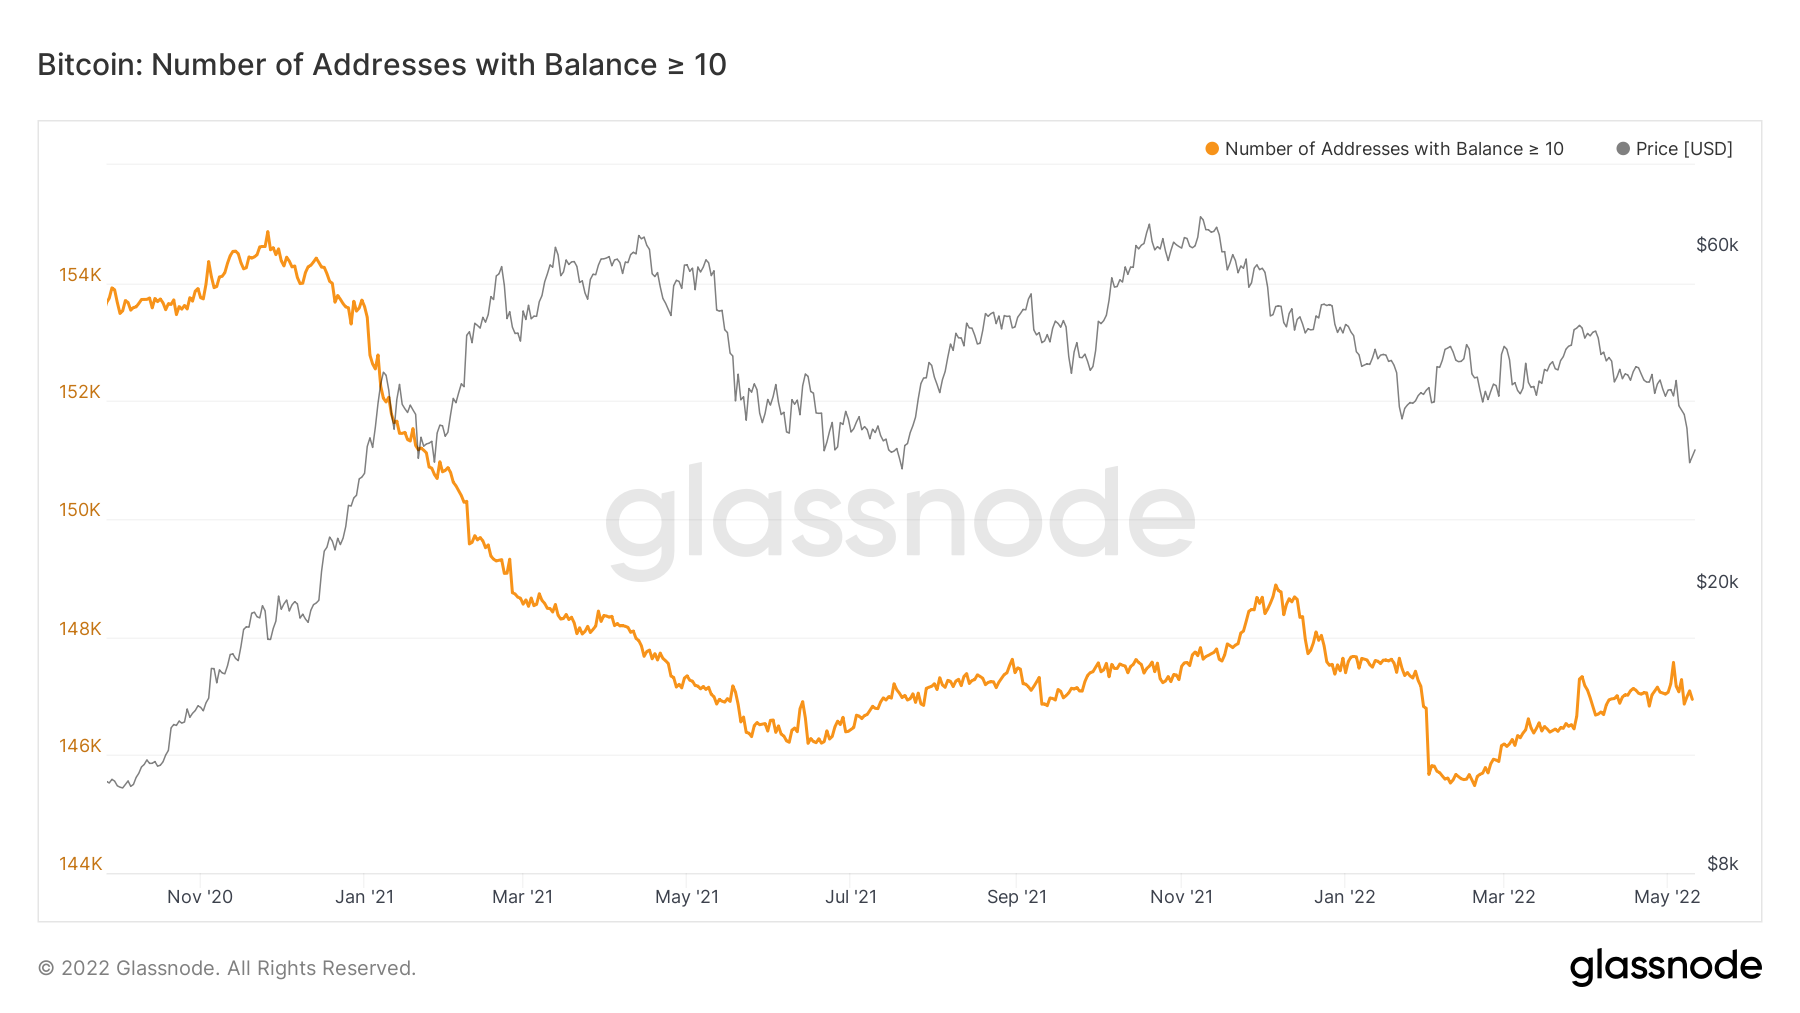
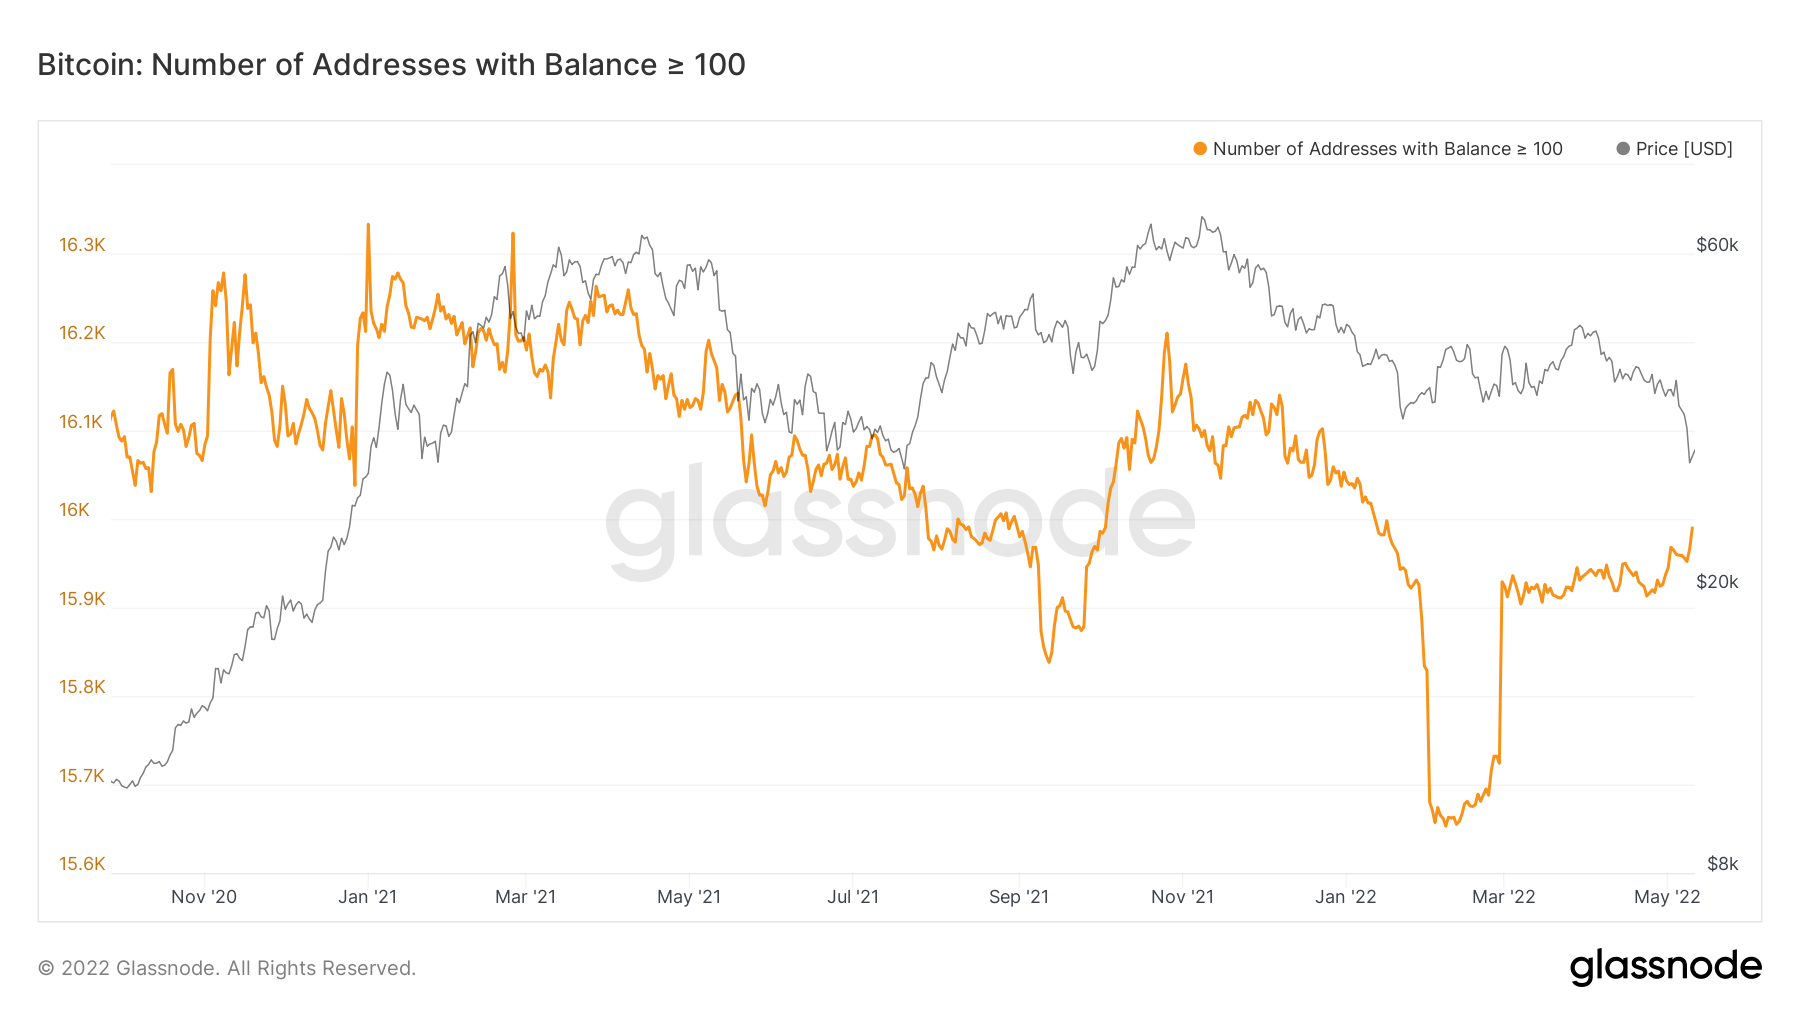
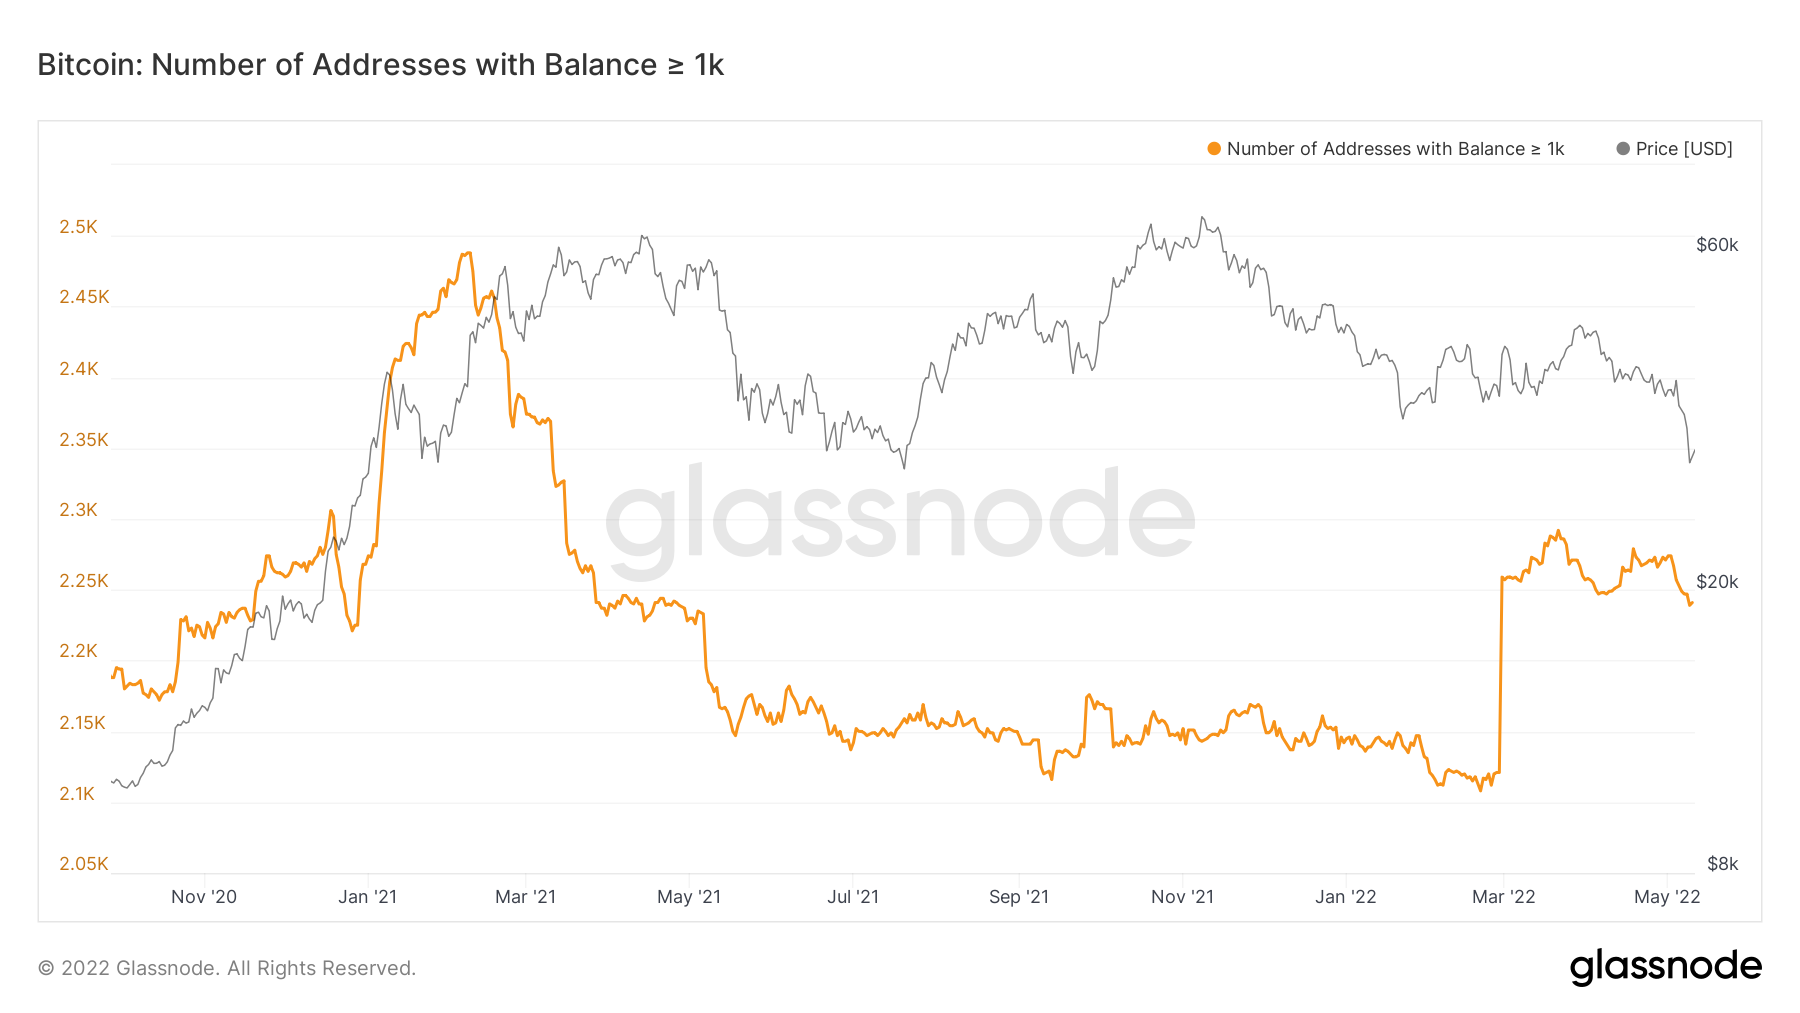
If we investigate the cohort of addresses, we can see that the smallest wallet cohorts have continued to accumulate over the last week but in a less consistent uptrend, perhaps showing some hesitancy in a market with continued declining prices. The largest wallet cohort (Addresses with Balance > 1,000 Bitcoin) has seen a decrease in the number of wallets, suggesting that this cohort has decreased its exposure even more greatly. Note, their decrease in exposure was around the $36,000 - $38,000 mark, so they decreased before the 20% price drop. Similar behaviour was seen in the cohort with Addresses with Balance > 10 Bitcoin, however, the cohort with Addresses with Balance > 100 Bitcoin increased, however historically they are a far less profitable cohort than the largest Bitcoin wallet cohort (> 1,000 Bitcoin wallets).
Bitcoin – Addresses with Balance > 0.01 Bitcoin
Bitcoin – Addresses with Balance > 0.1 Bitcoin
Bitcoin – Addresses with Balance > 1 Bitcoin
Bitcoin – Addresses with Balance > 10 Bitcoin
Bitcoin – Addresses with Balance > 100 Bitcoin
Bitcoin – Addresses with Balance > 1,000 Bitcoin
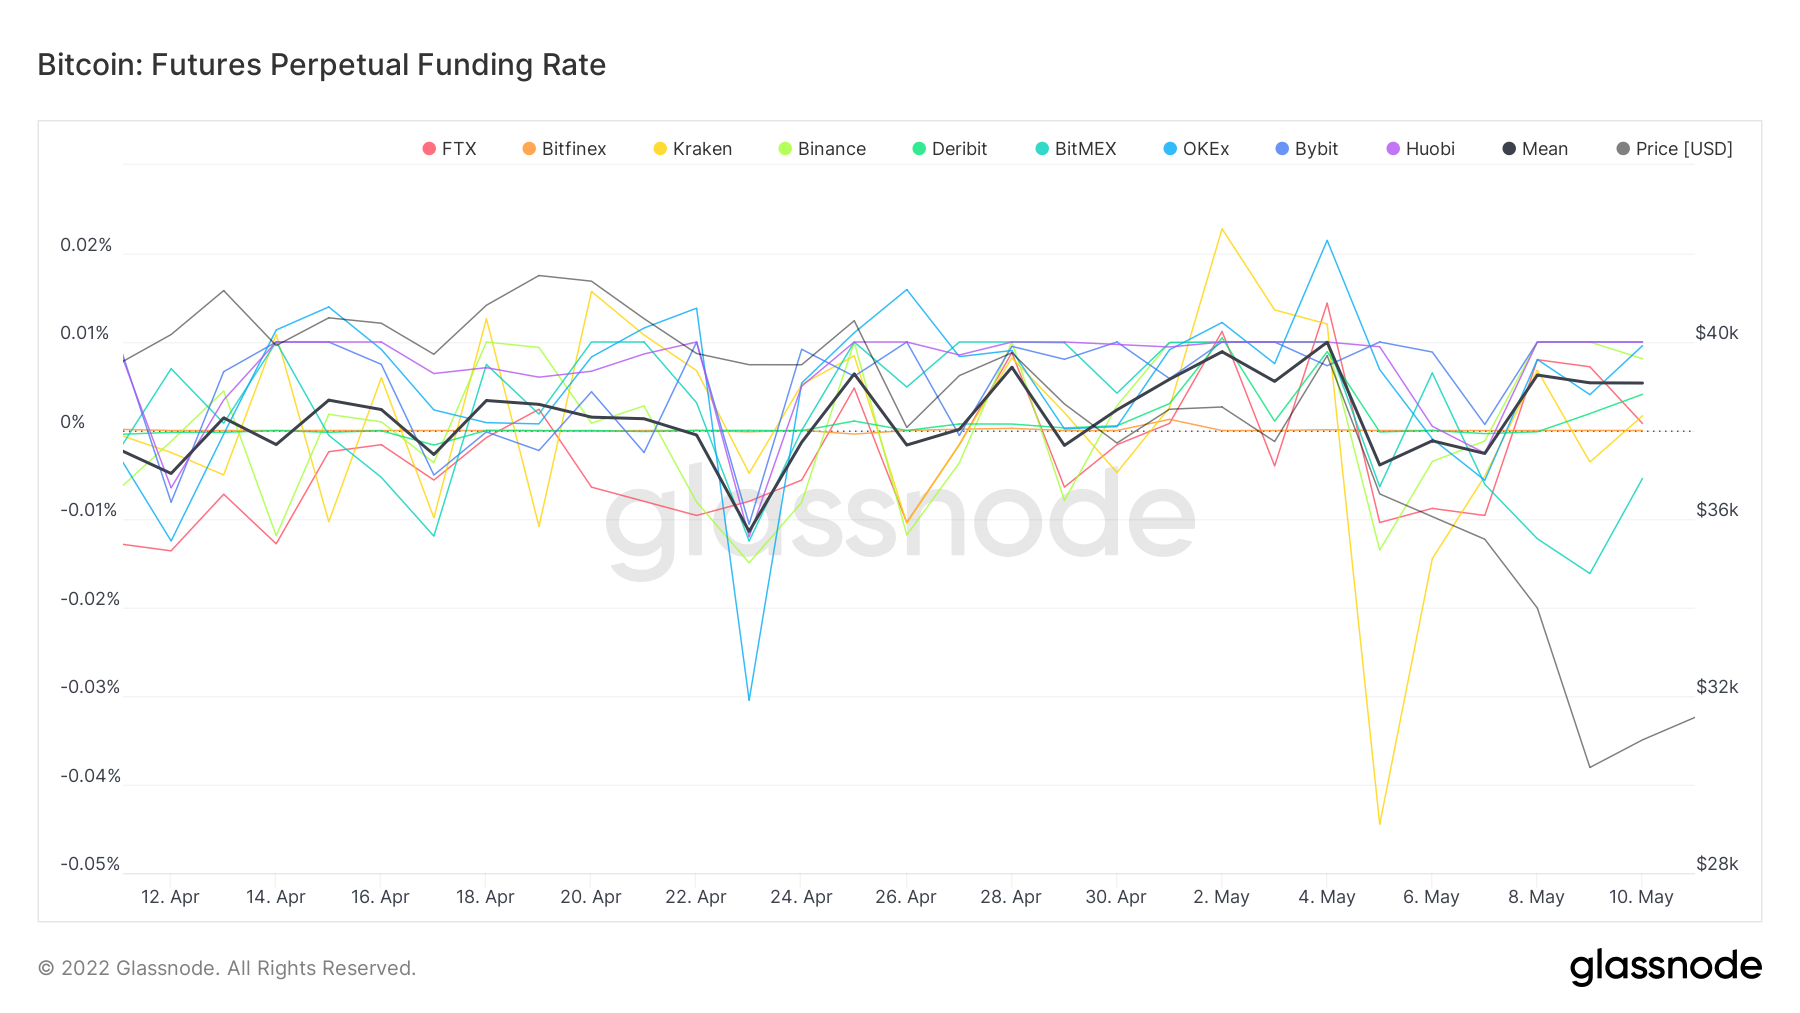
Metric 3 - Futures Perpetual Funding Rate & Volume
In assessing whether the last day or two was a capitulatory style event, two key metrics come to mind. The first of these is the Futures Perpetual Funding Rate. A healthy market has a funding rate of 0.00% - 0.01%, this suggests that the market is in the majority made up of Longs but not so many Longs that the market becomes over-heated. We can see in the below graph that before the move down in price from approximately $38,000 to $30,000, funding rates were at 0.01% on average. This tells us the Futures market was relatively healthy.
Bitcoin – Futures Perpetual Funding Rate
The second metric is the Futures Volume. We can see in the below graph that there was not an excessive amount of volume, in fact the volume increased when the crash happened, either late Shorts coming in or investors trying to Long what they think is the local price bottom at that time.
Bitcoin – Futures Volume
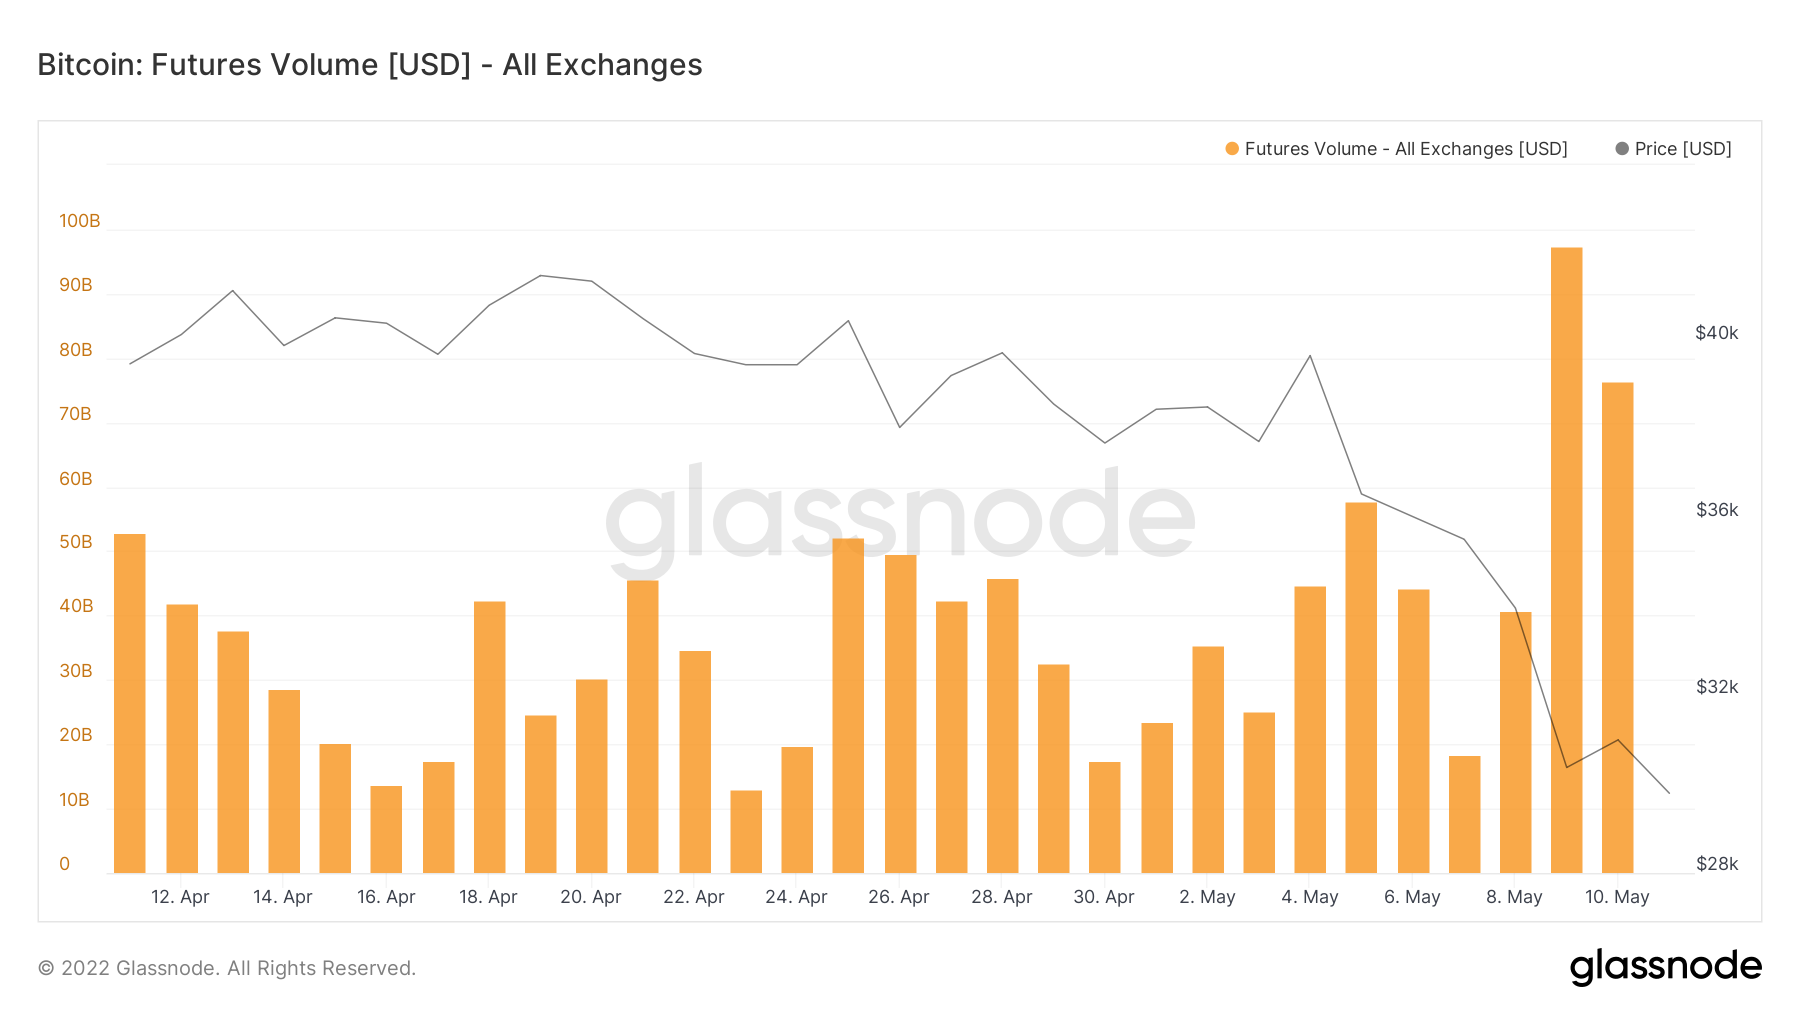
From investigating the above two metrics, it can be said that the move down in price was due to some significant selling rather than a leverage flush out.
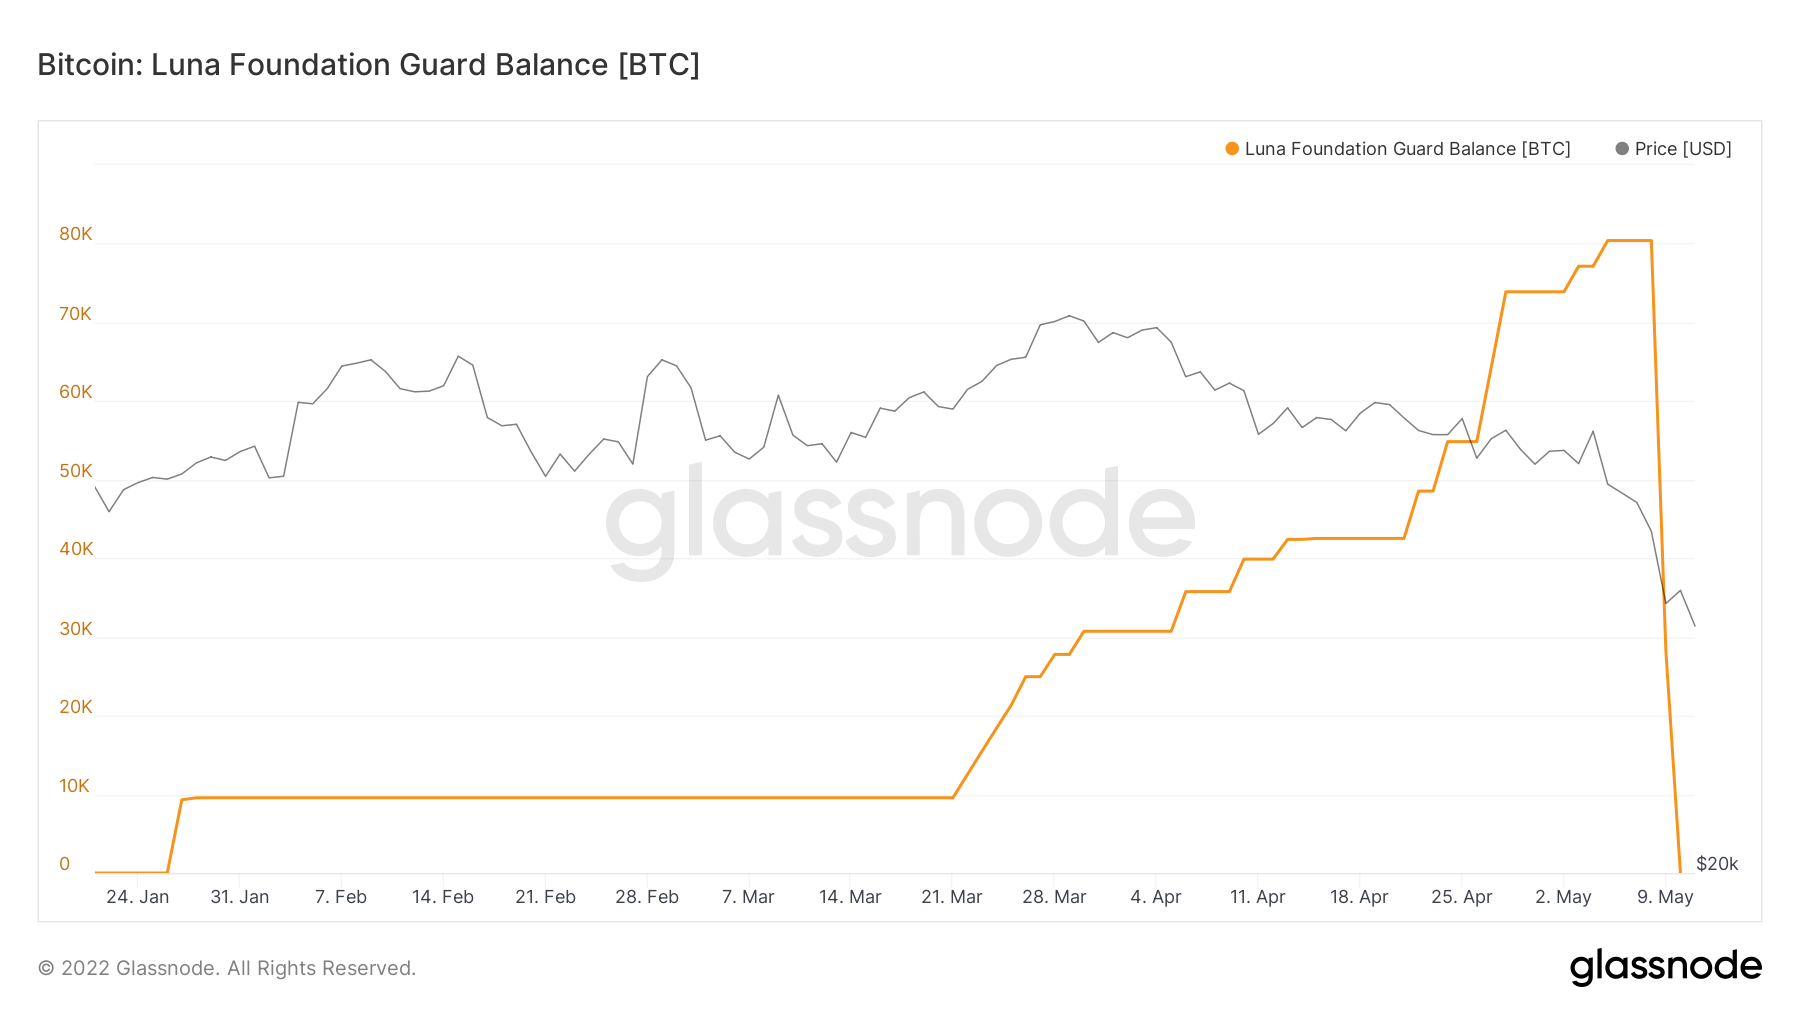
Metric 4 – Institutional Flows
If we look at the Institutional players, we can see two main holdings that can tell us a lot about the market. The first of these is the Luna Foundation Guard Balance, who accumulated over 80,000 Bitcoin in order to sell to help maintain the UST peg. However, with the collapse of this over the recent days, we have seen LFG reduce its Bitcoin balance to 0. At the moment, this seems to be the main reason for the decrease in Bitcoin’s price over the past week.
Bitcoin – Luna Foundation Guard Balance
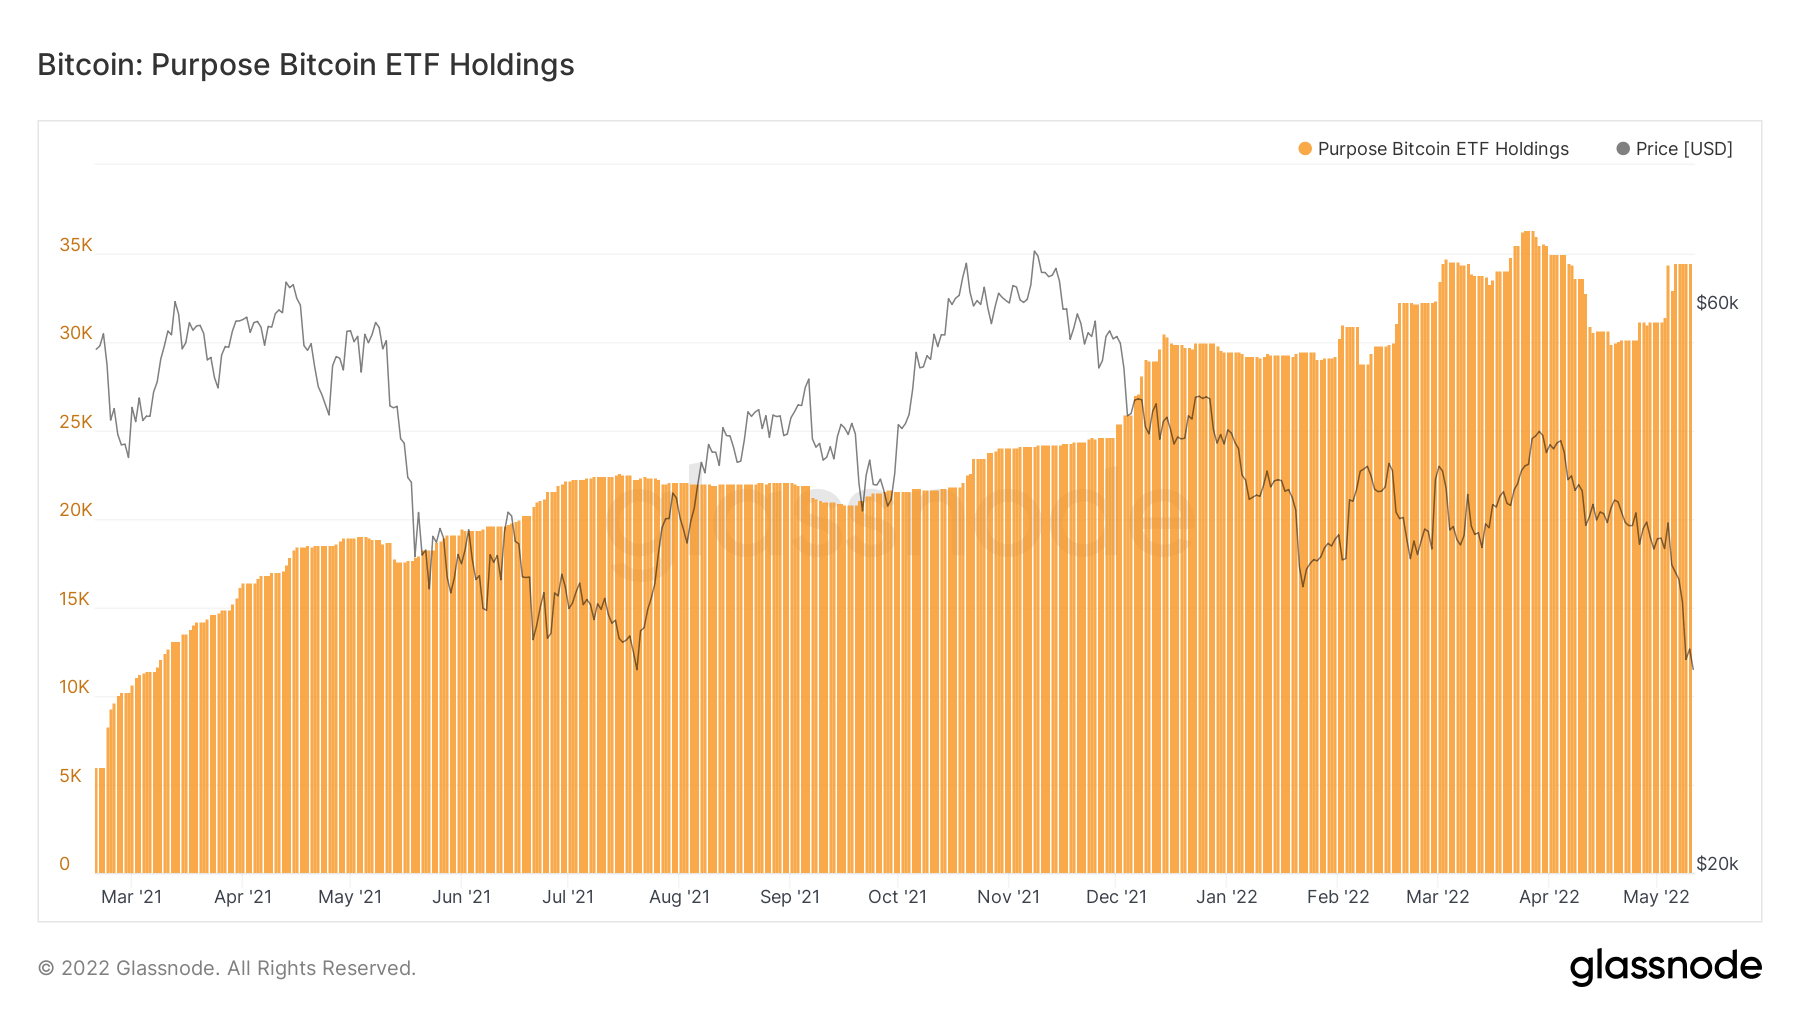
The second Institutional fund we can look at is the Purpose Bitcoin ETF, who we can see have added to their holdings in the last week as Bitcoin has become cheaper to purchase. In the last week, the Purpose ETF has added approximately 3,500 Bitcoin’s to their ETF, representing an approximate 10% increase.
Bitcoin – Purpose Bitcoin ETF Holdings
Metric 5 - Spent Outputs
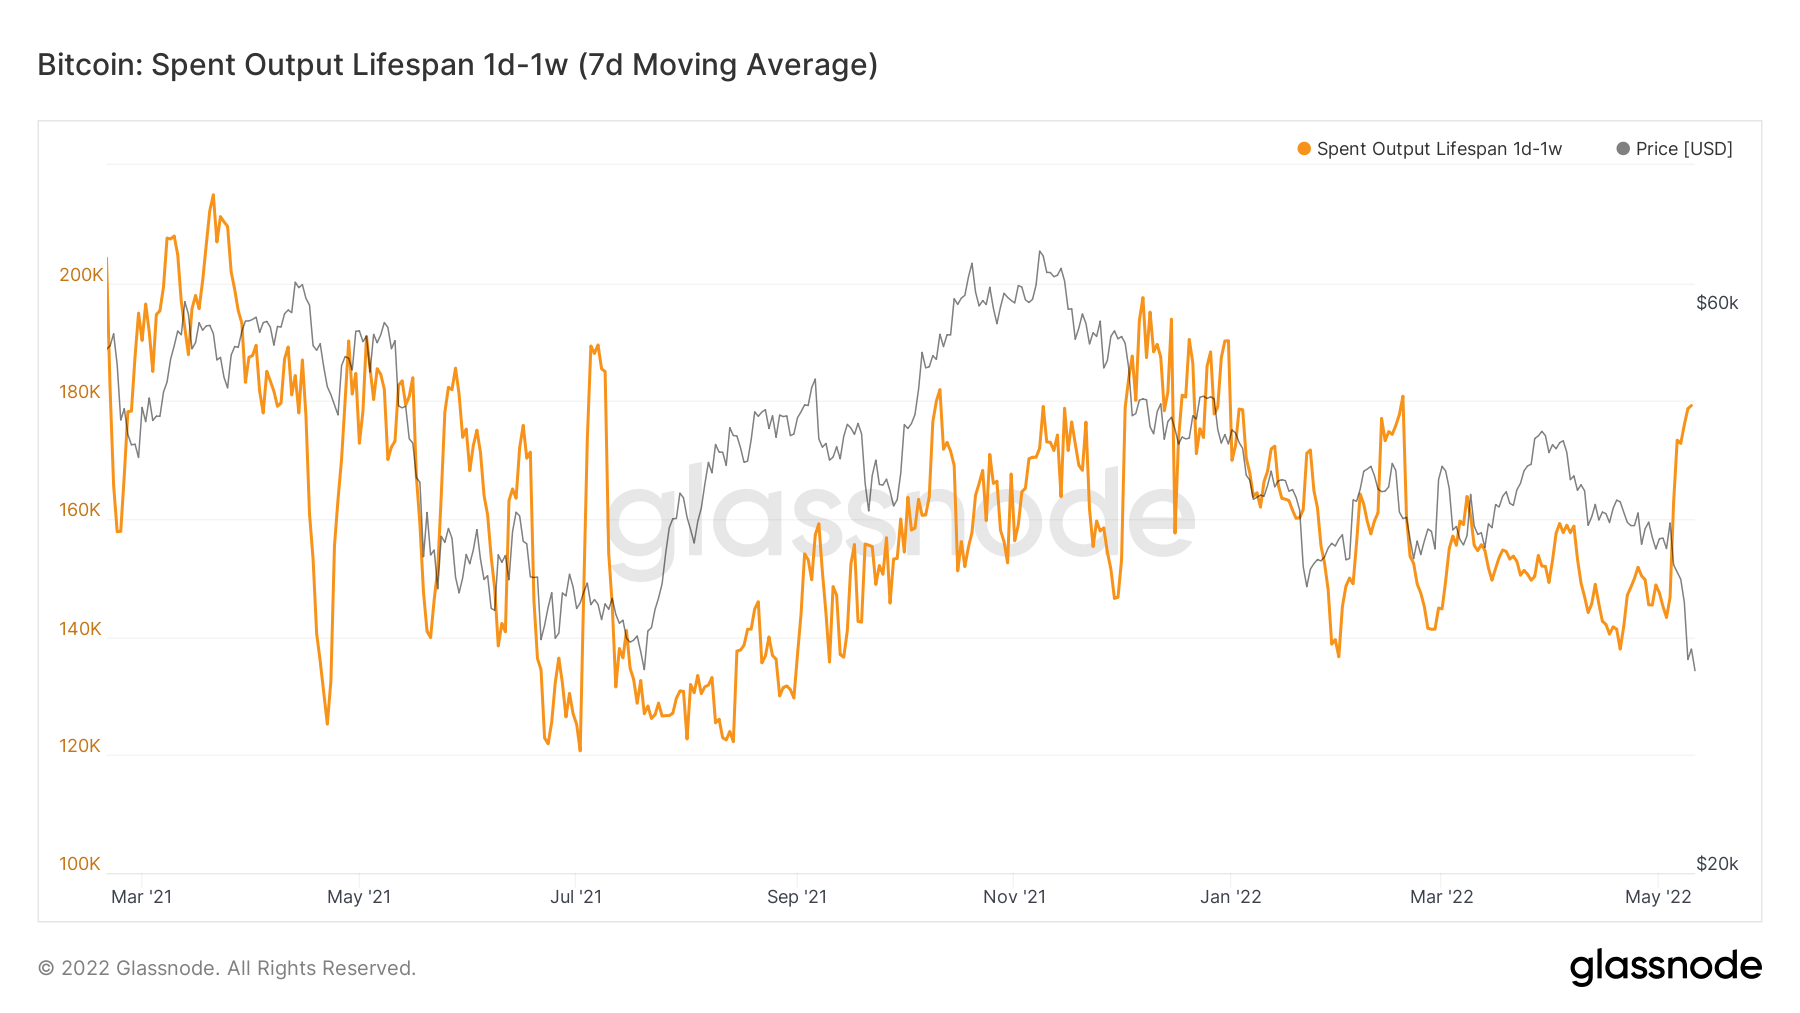
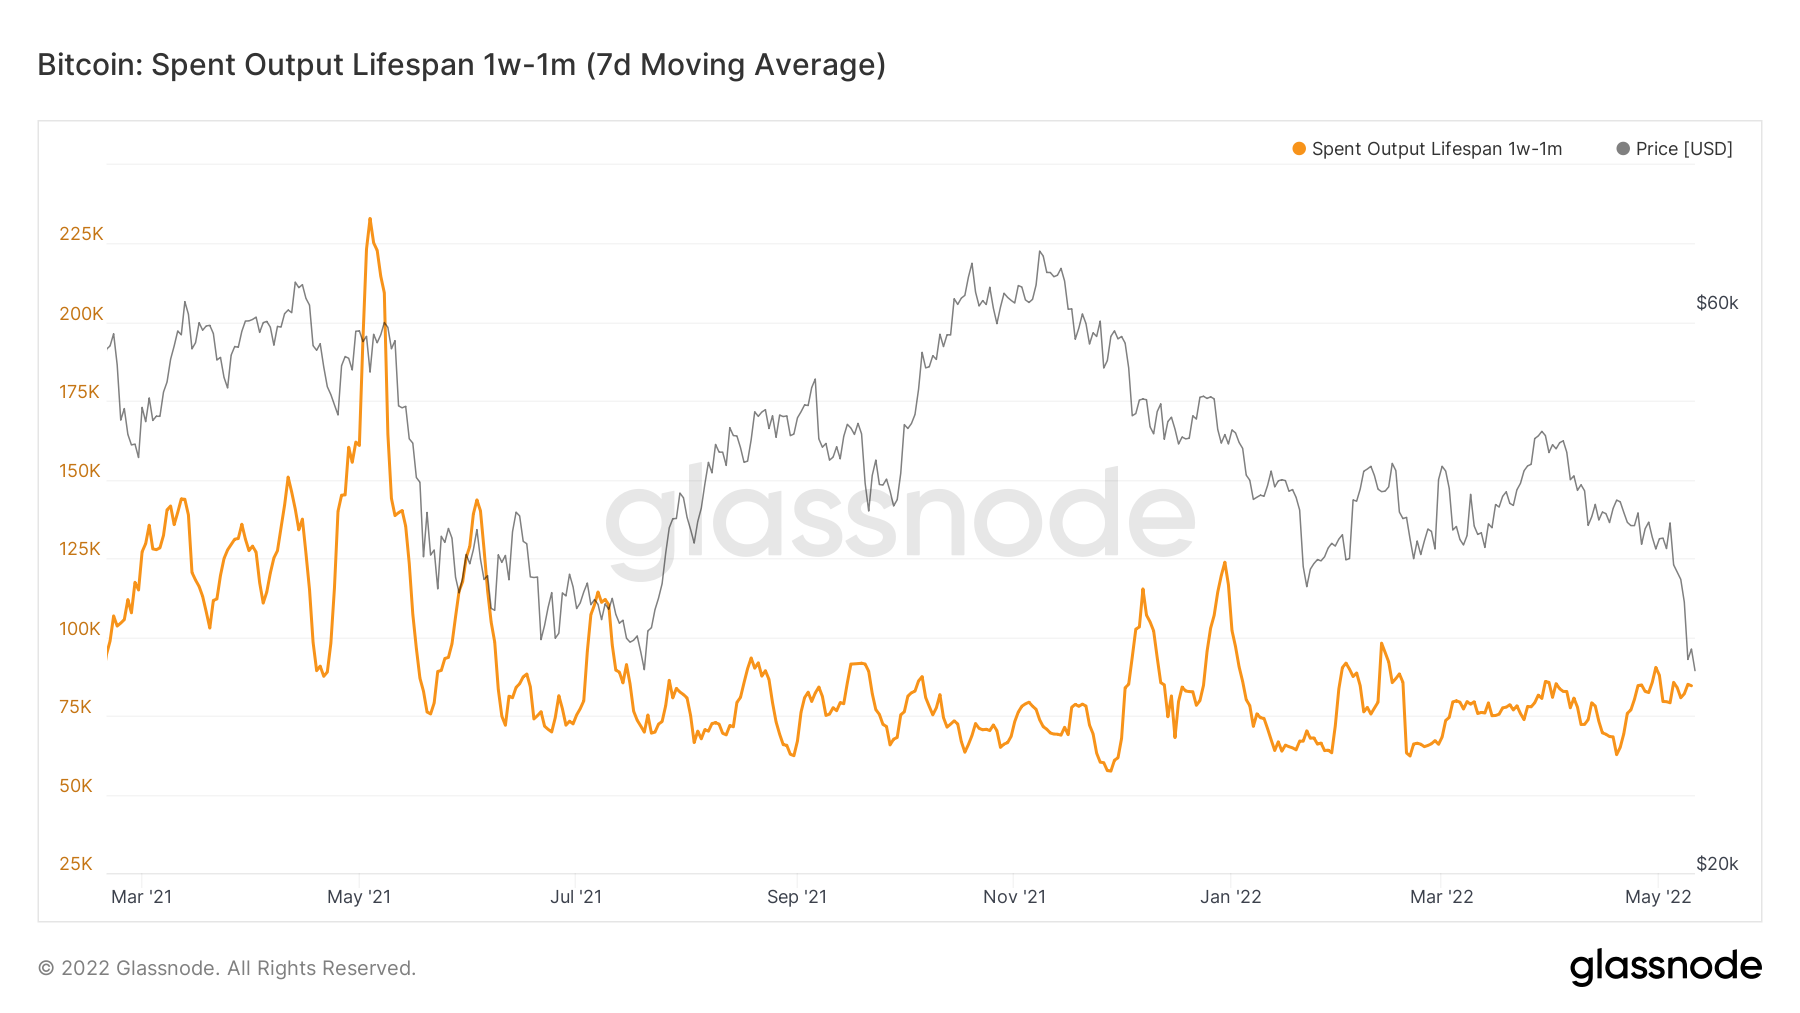
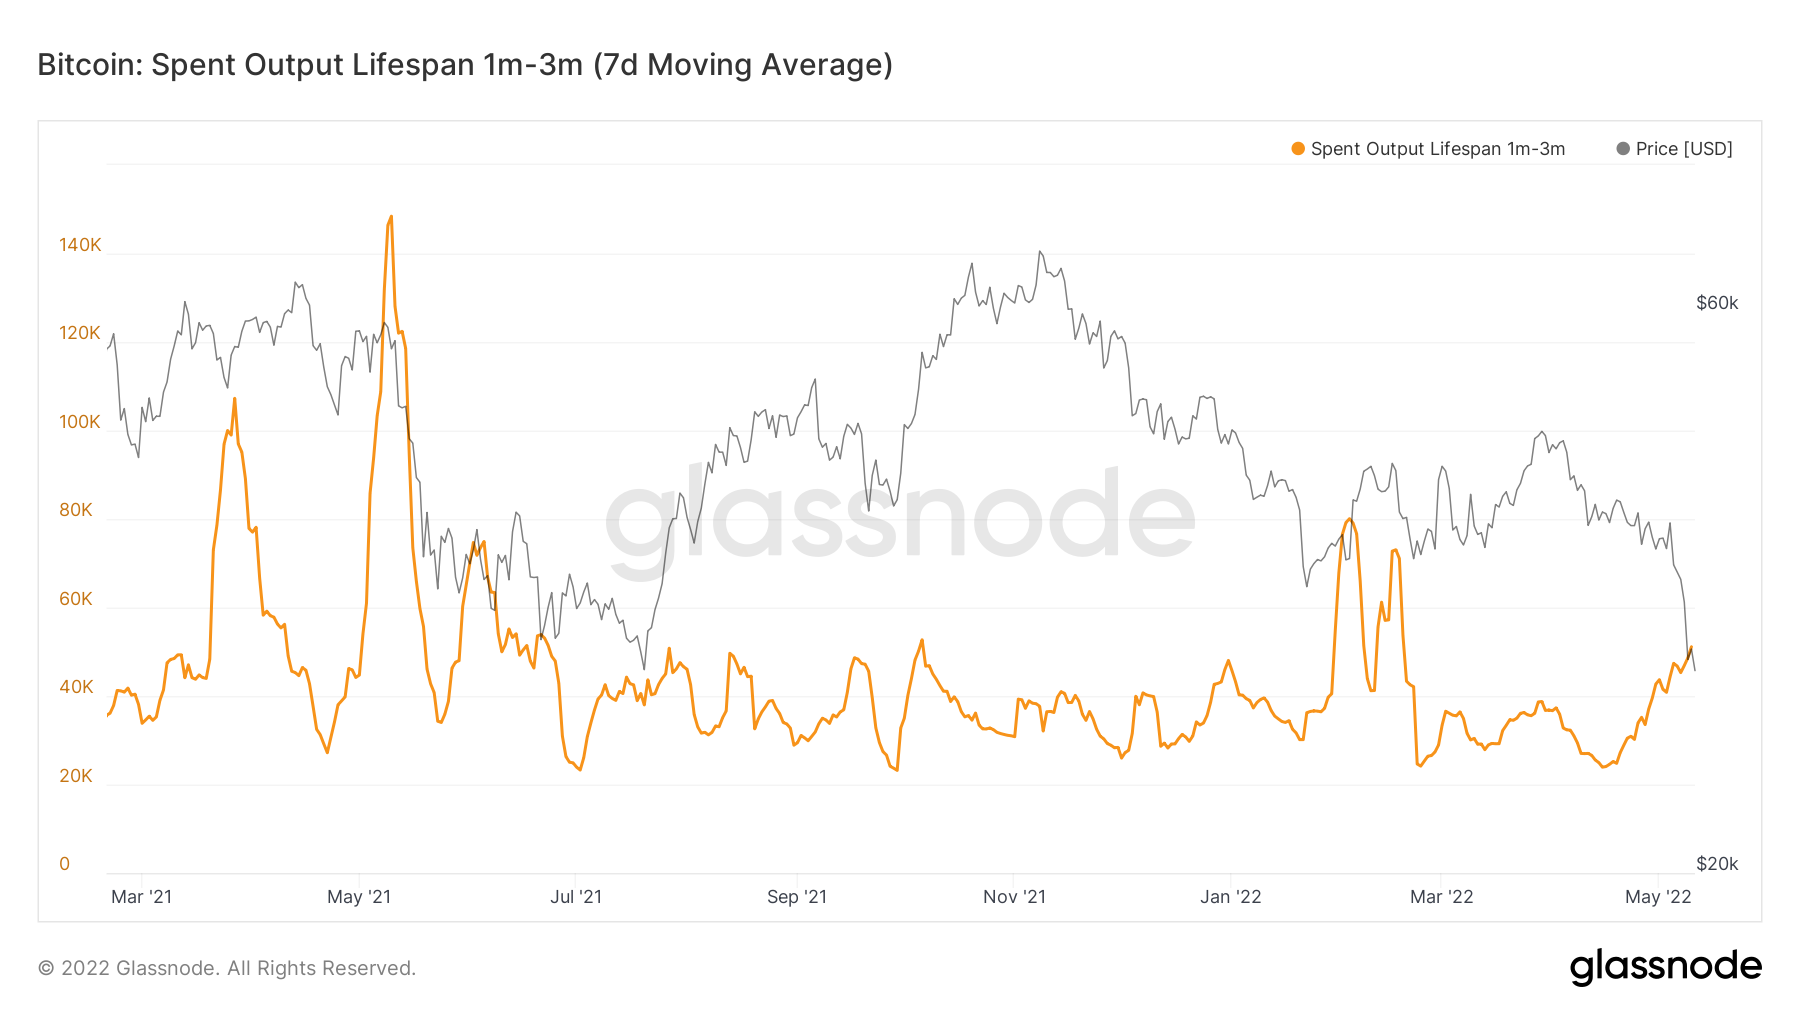
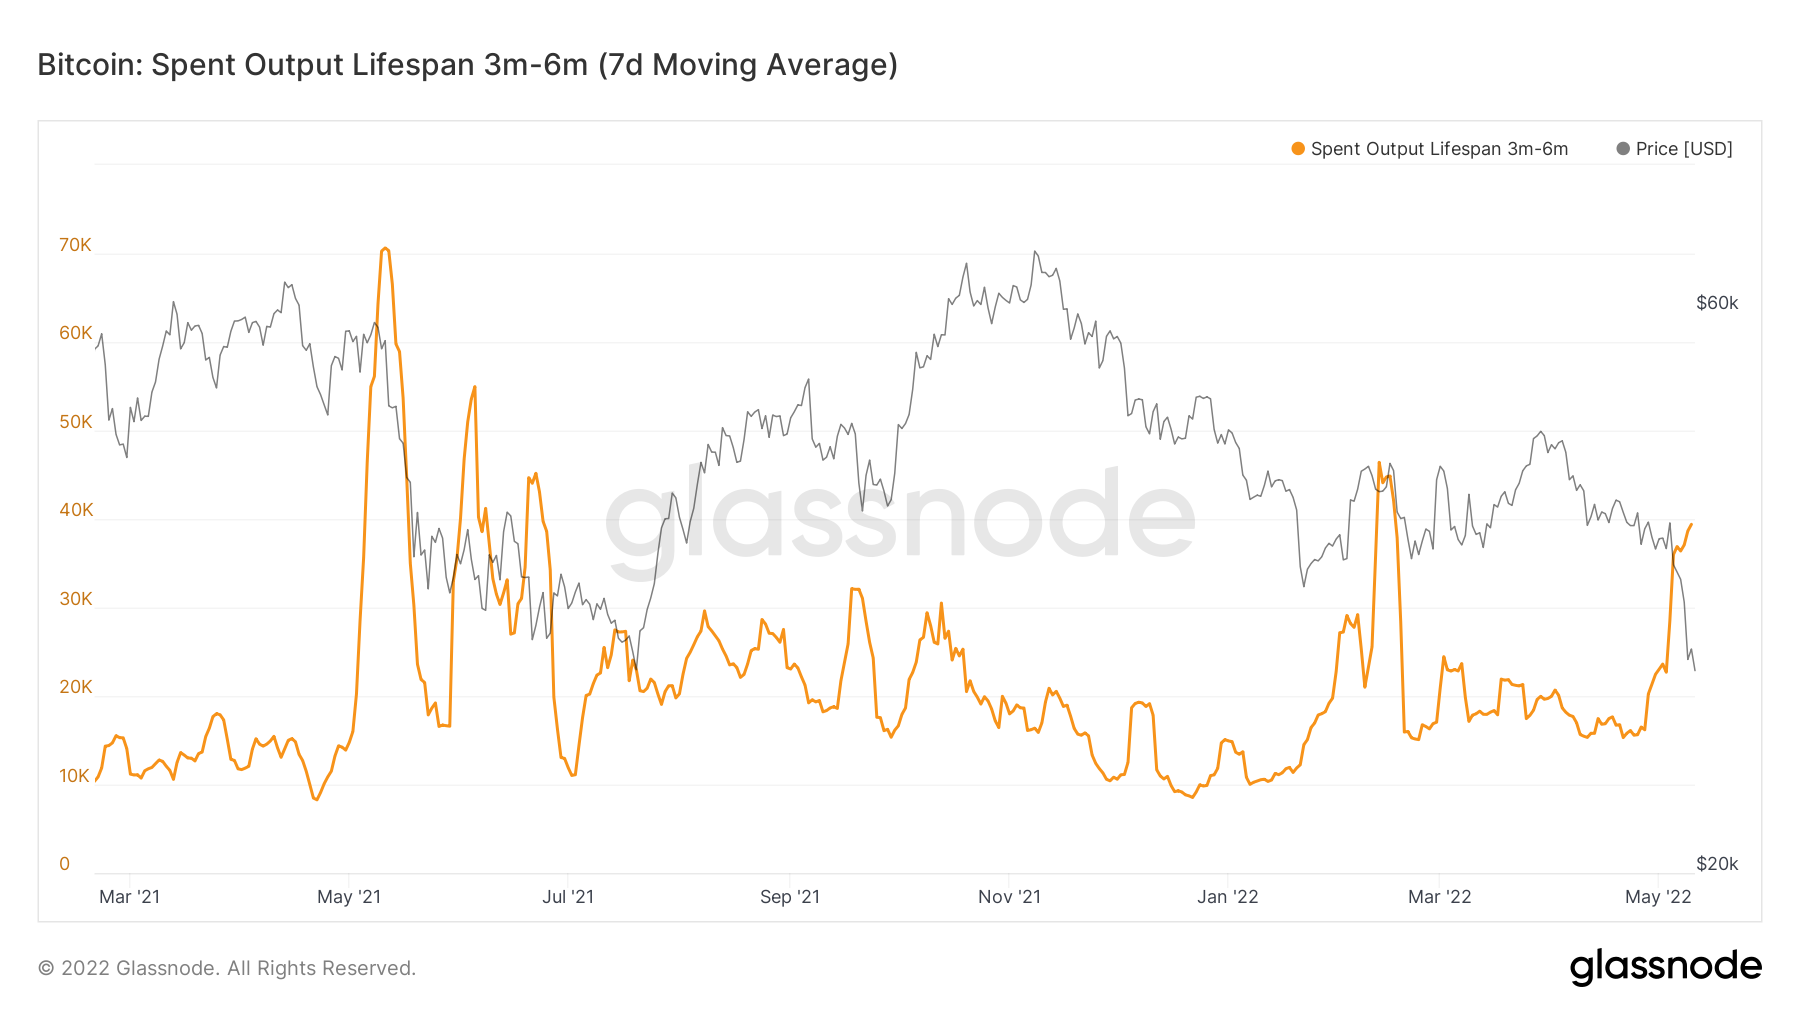
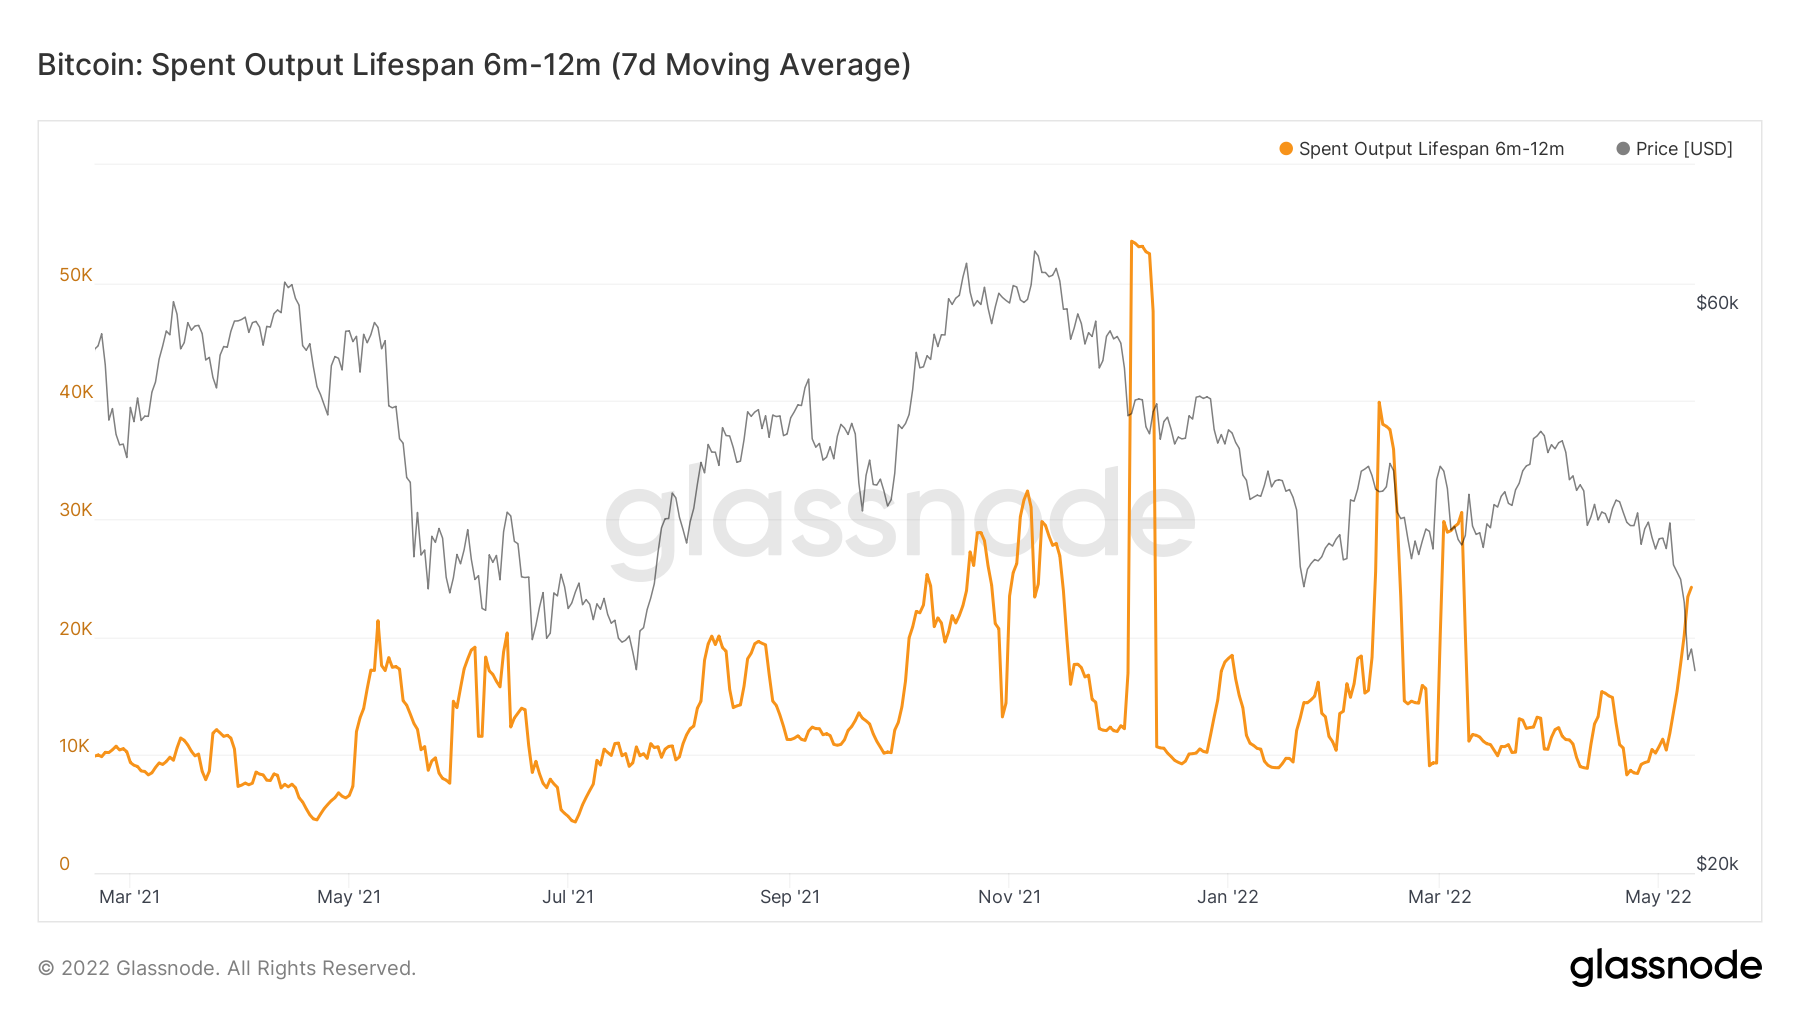
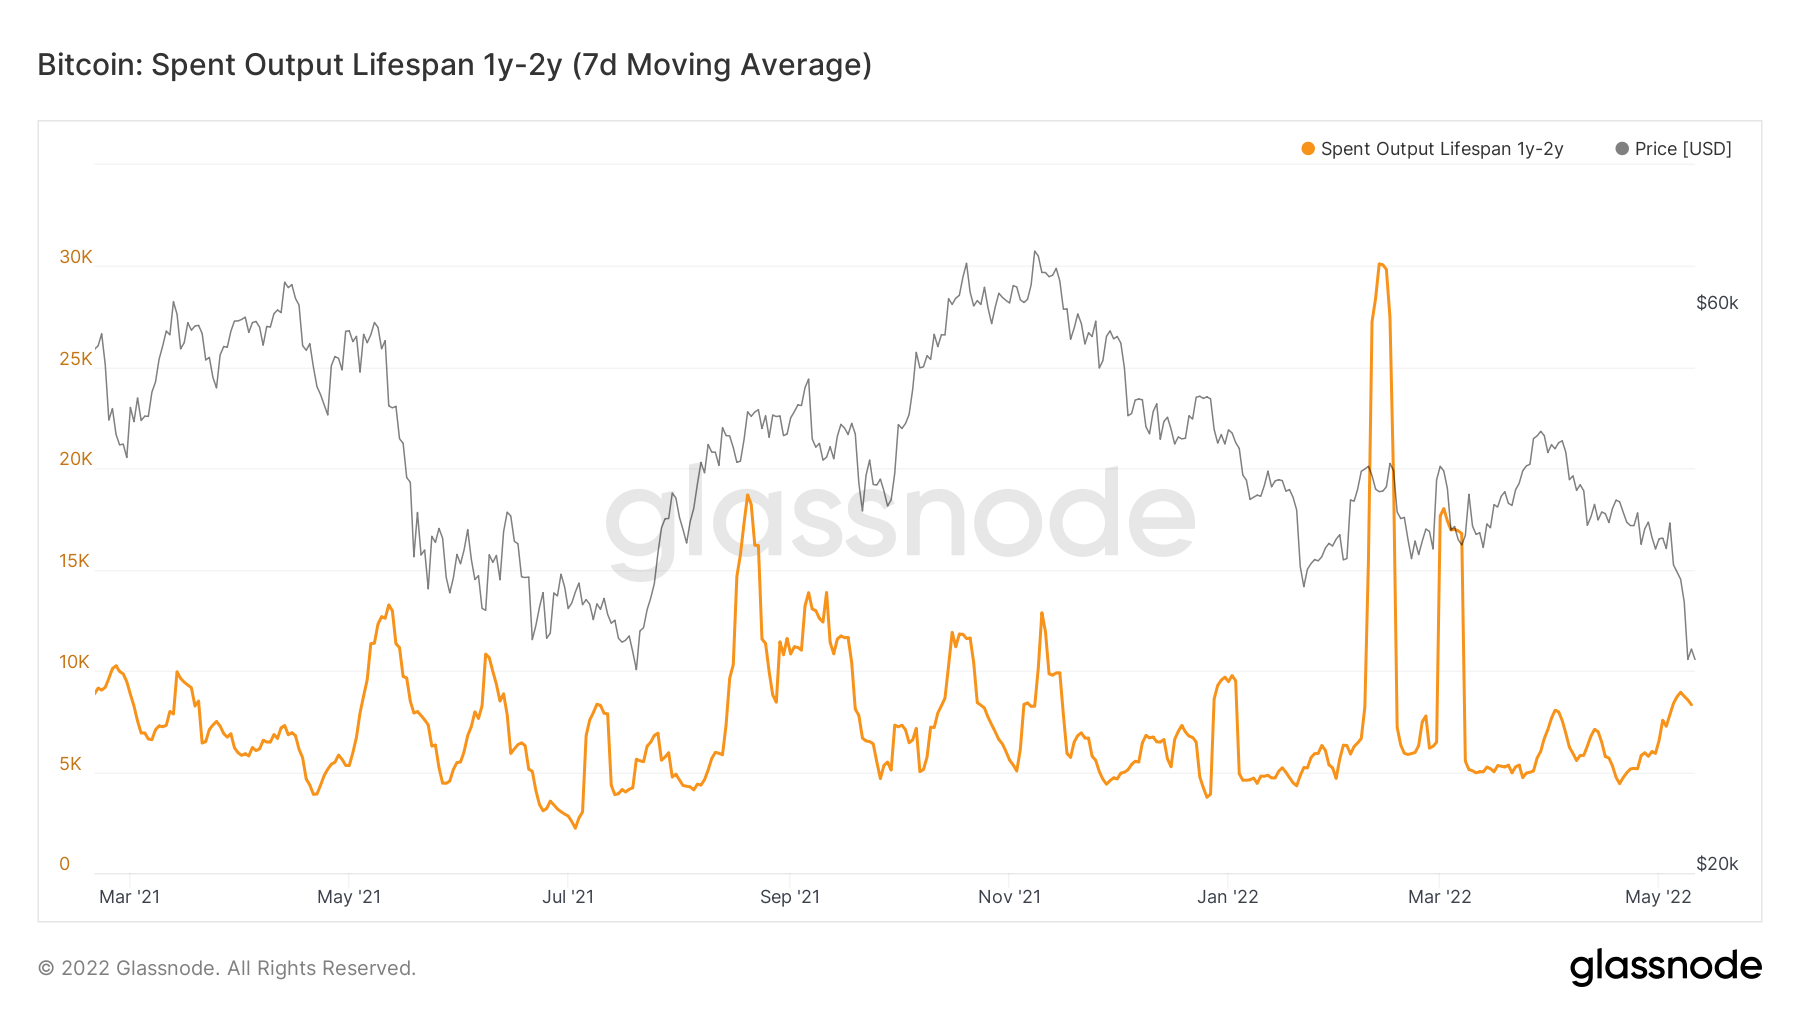
One of the last set of metrics we’re going to cover is the Spent Outputs. This shows us if it is young or old coins that are being spent on-chain. It is usual for quick flush outs to be caused by young (short-term holders) coins being spent on chain.
Bitcoin – Spent Outputs 1D – 1W
Bitcoin – Spent Outputs 1W – 1M
Bitcoin – Spent Outputs 1M – 3M
Bitcoin – Spent Outputs 3M – 6M
Bitcoin – Spent Outputs 6M – 1Y
Bitcoin – Spent Outputs 1Y – 2Y
Bitcoin – Spent Outputs 2Y – 3Y
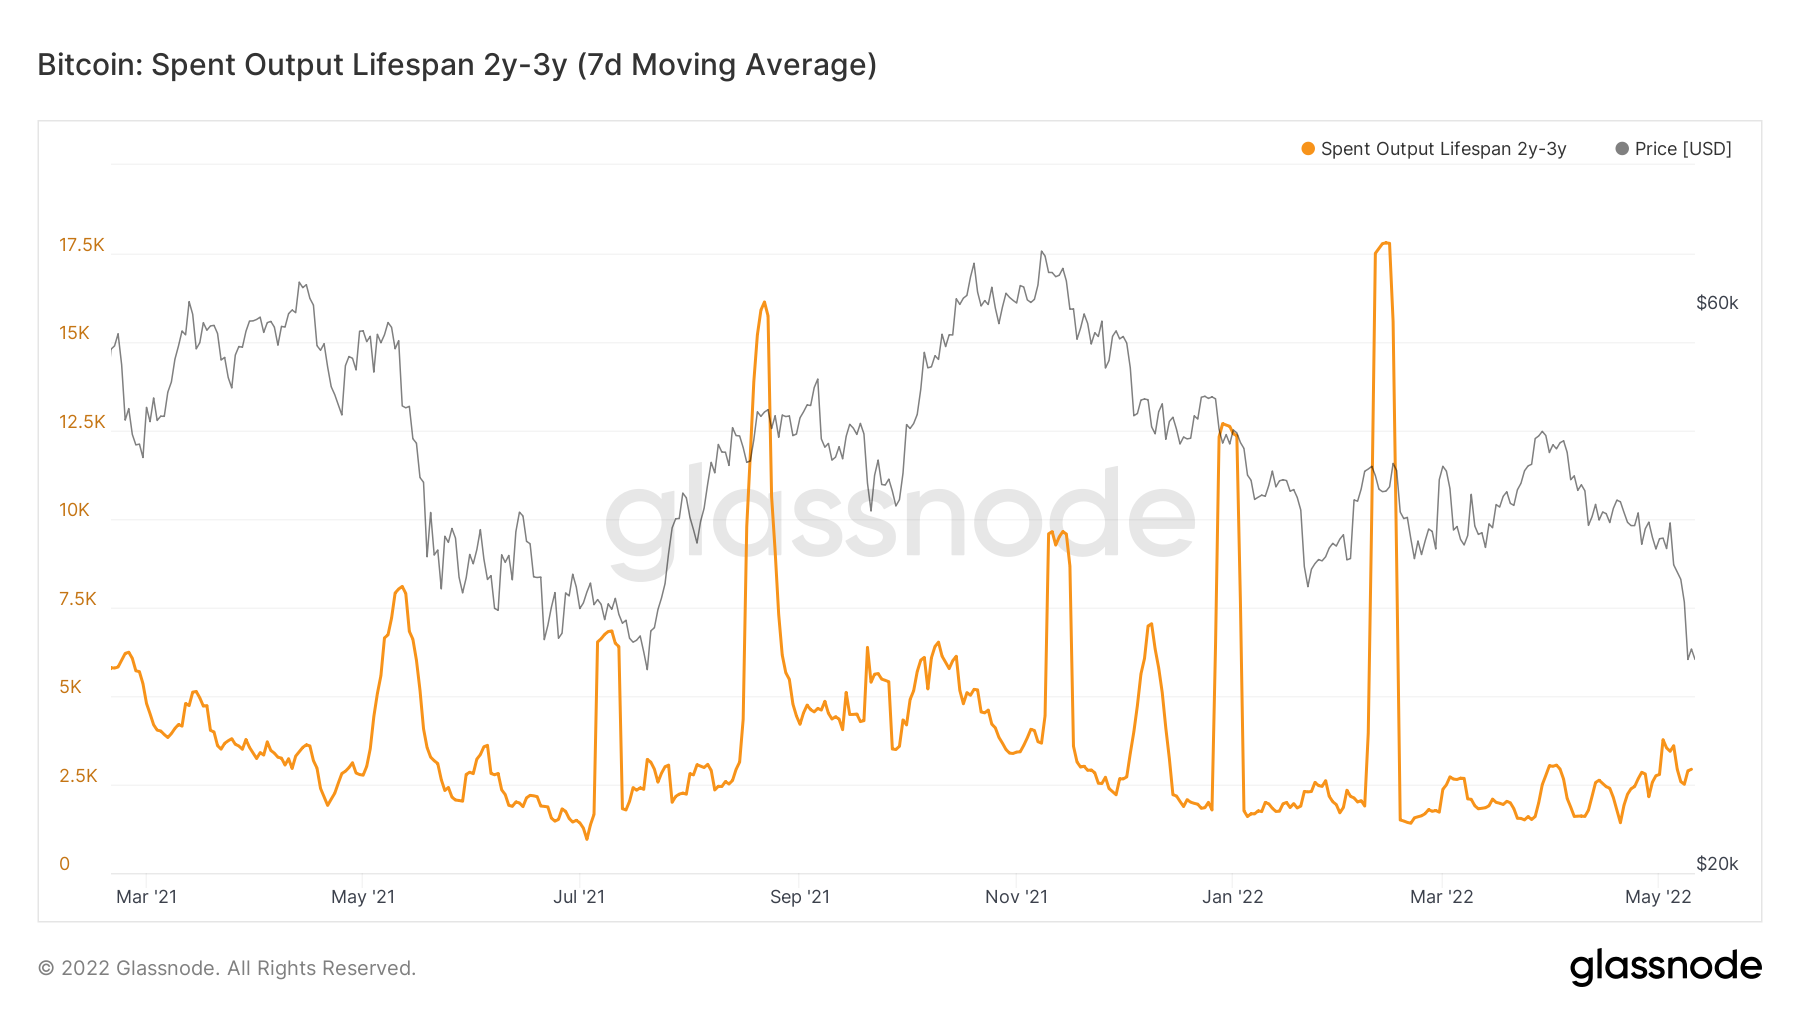
We can see from the above charts that there were spikes in the younger coin charts suggesting that the sell-off may have been initiated by LFG and then young coins have panic sold into the move down.
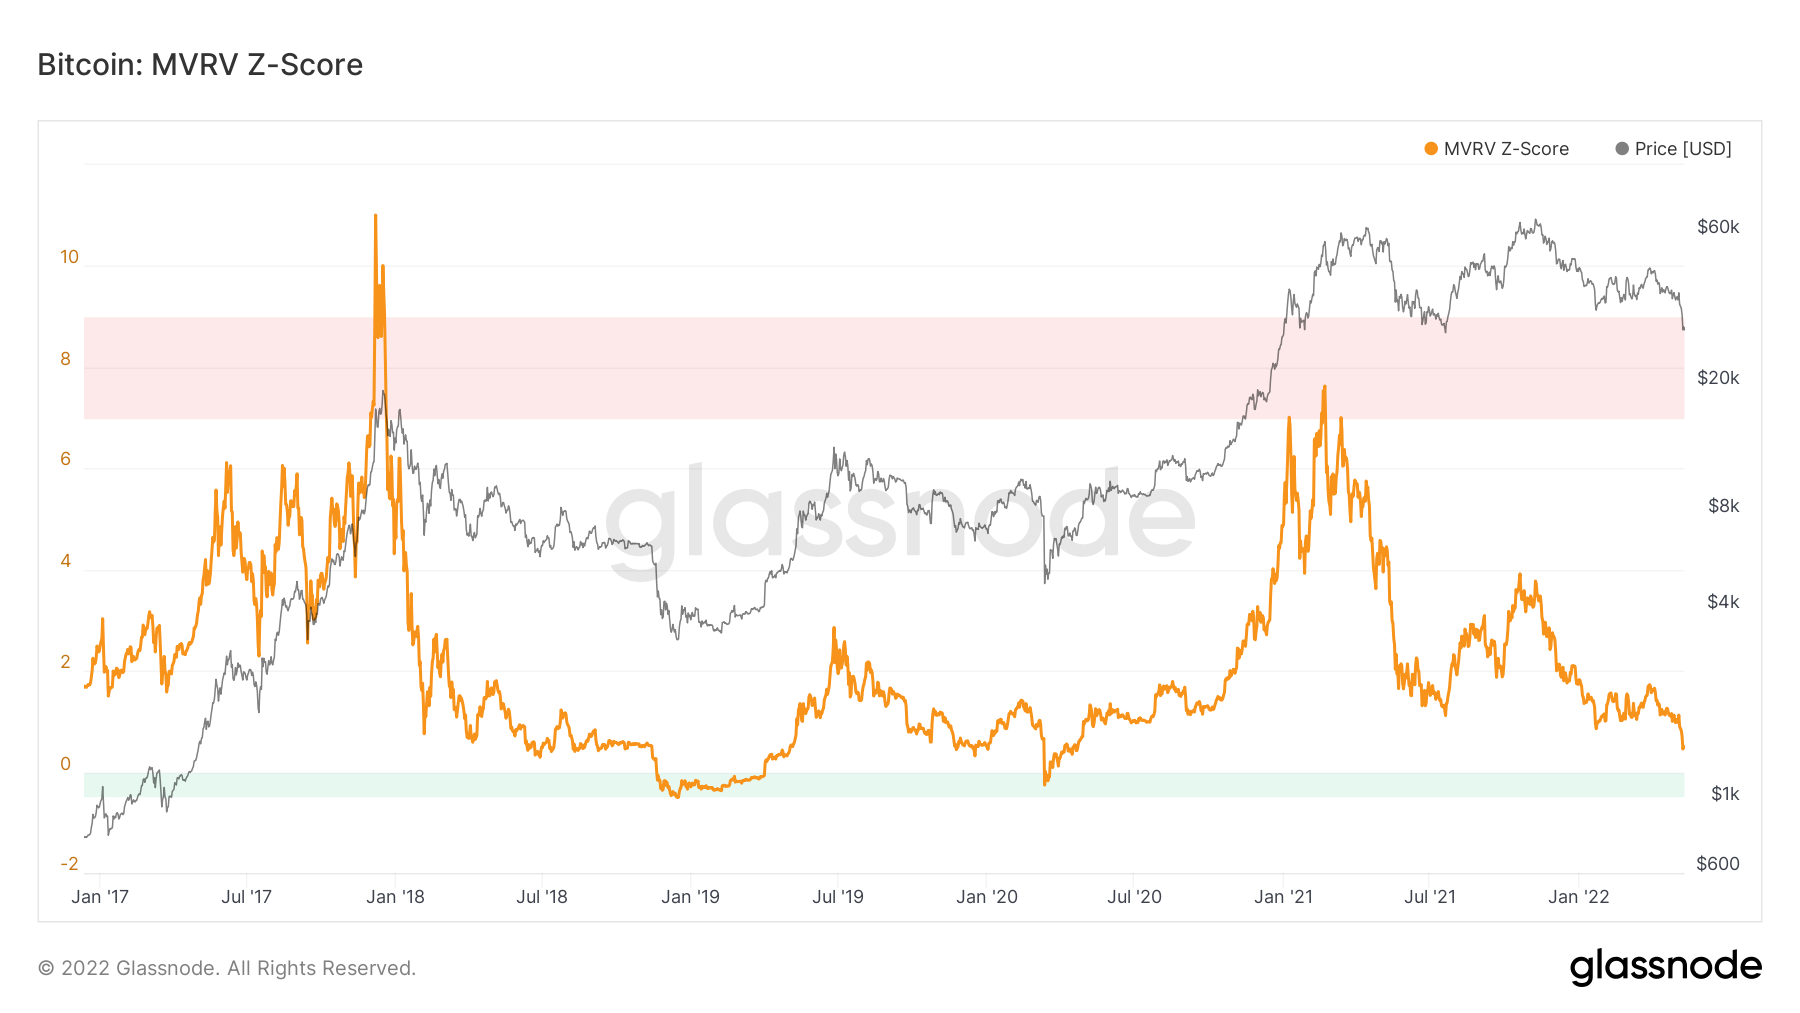
Metric 6 - MVRV Z-Score & Realised Price
The last metrics we will assess are the MVRV Z-Score and the Realised Price. The MVRV Z-Score suggests we may still have some room to go lower but that a macro bottom may be nearing. The green zone has historically been the place to confidently fill macro-Longs.
Bitcoin – MVRV Z-Score
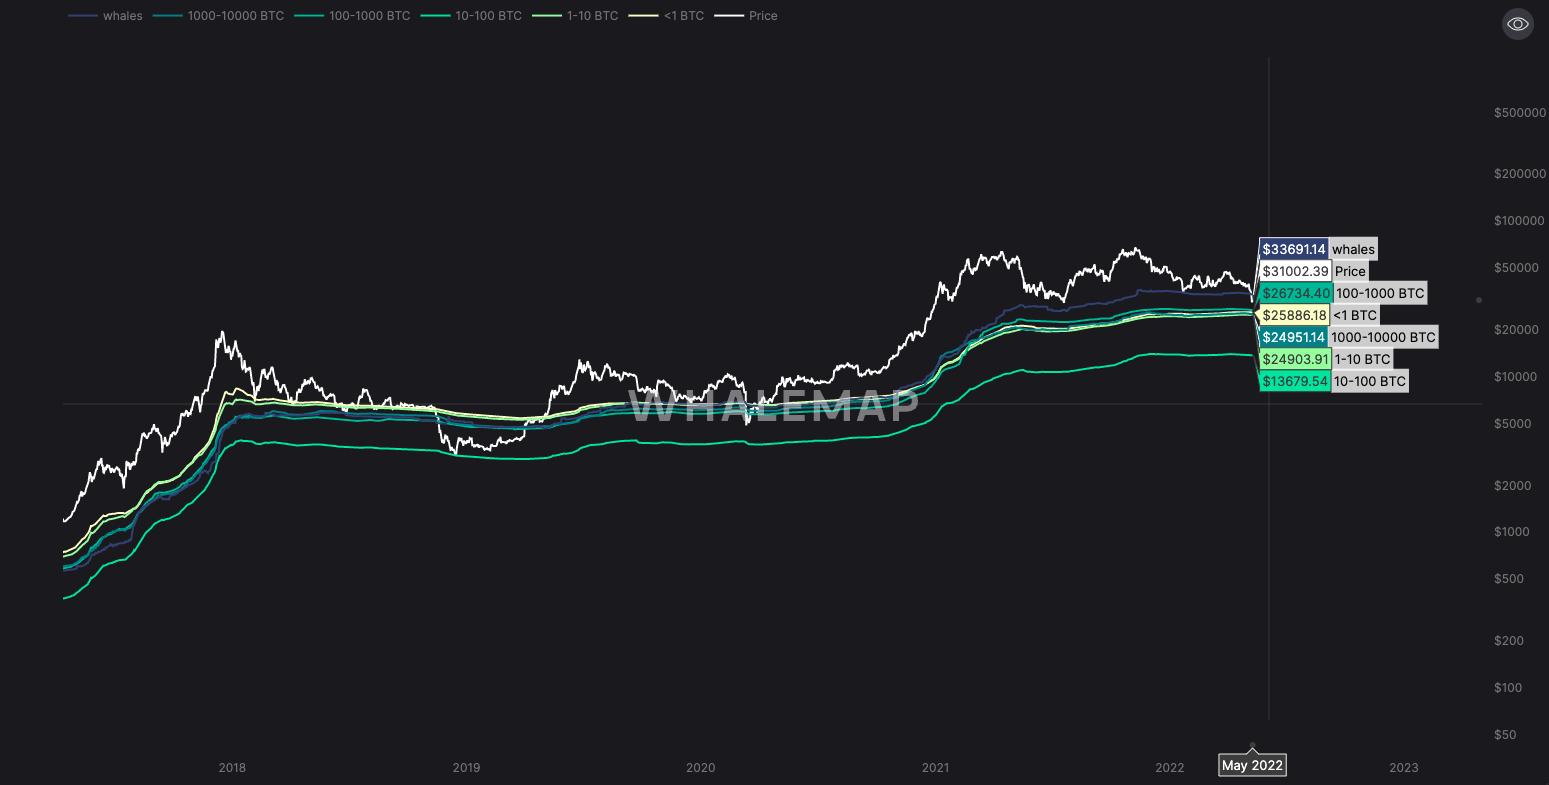
With this being said, we turn to a chart we have posted in a previous report as to where the macro bottom may be price wise. If we look at the Realised Price of the wallet cohorts, in all Bear markets, price has returned to test this realised price. Currently, there is a small range at which the realised price of many of the wallet cohorts sit. This price is between $25,000 and $27,000.
Bitcoin – Realised Price
Summary
In summarising this week’s report, it can be said that perhaps the main driving factor in this week’s price decline was LFG dumping its Bitcoin holdings. This acted as the catalyst for short-term holders to then panic sell their holdings. With the macro environment still looking as if there may be more troubles on the horizon, it is possible that risk-on assets will continue to struggle. This may cause Bitcoin to retest its realised price where there is a tight range between $25,000 and $27,000. If price does retest and holders panic, we may see this be what triggers the capitulation that some investors are holding out for in order to buy back in.
Recommended from Cryptonary


