Save 23% ($351) & Get a Free 1-1 Call with our Team ⏰ : 0d 2h 59m 44s
PEPE, WIF, POPCAT, SPX, LTC—crypto volatility continues
Meme coins remain uncertain as PEPE eyes a breakout, WIF consolidates lower, and POPCAT fights to hold support. Meanwhile, SPX moves toward resistance. Let’s dive into the charts and see what’s next for these assets.
Disclaimer: This is not financial or investment advice. You are responsible for any capital-related decisions you make, and only you are accountable for the results.
PEPE:
- PEPE managed to find support at the $0.00000826 level and the price has since sat 10% above that level.
- Price is also now grinding closer towards the main downtrend line. A break out of this line would likely see a price retest of $0.00001137.
- $0.00001137 is the next major horizontal resistance as well, so this would be the clear horizontal line that the price would need to reclaim in order to see a bullish reversal.
- The main support zone remains between $0.00000711 and $0.00000826. This zone is a potentially good long-term buying opportunity should price get there.
- The RSI has moved out of oversold territory and now it's also above its moving average. However, we'd have preferred to see a bullish divergence form in oversold territory, and we didn't quite get that.

- Next Support: $0.00000826
- Next Resistance: $0.00001137
- Direction: Neutral/Bearish
- Upside Target: $0.00001137
- Downside Target: $0.00000826
Cryptonary's take
It's possible that PEPE's lows are in or are very close. If the lows aren't in, then we think it'll be between $0.00000711 and $0.00000826, and we do still expect that area to be retested. We'll keep assessing how the price behaves, and if it does dip lower, or it just grinds towards its downtrend line.A move into the downtrend line, and then a squeeze to then break out of the downtrend line will likely be a good opportunity for a Long. So, do we get another downside move first or do we just grind towards the downtrend line to then break out to the upside? That's what we're debating. For now, we'll sit tight and keep watching how the price behaves.
WIF:
- Again, we're going to keep WIF short and sweet this week, and we've zoomed out and shown the 3D timeframe chart so that we can see the old ranges from way back in early 2024 as they're important from a TA perspective now.
- When the price lost $1.40, it was the 'line-in-the-sand' level and the price has essentially been down only since. Granted, the rest of the meme space has struggled also.
- In terms of support, the price has found a local level here at $0.60, but the major support is at $0.46.
- The old range is $0.21 to $0.46, so we wouldn't be totally surprised if the price returned back to this range in the coming weeks/months.
- The RSI has been extremely oversold, but this hasn't really helped WIF. The RSI hasn't produced any bullish signals really, and it hasn't aided us from a TA perspective.
- In terms of upside, for now, we think it'll be capped between $0.72 and $0.80.
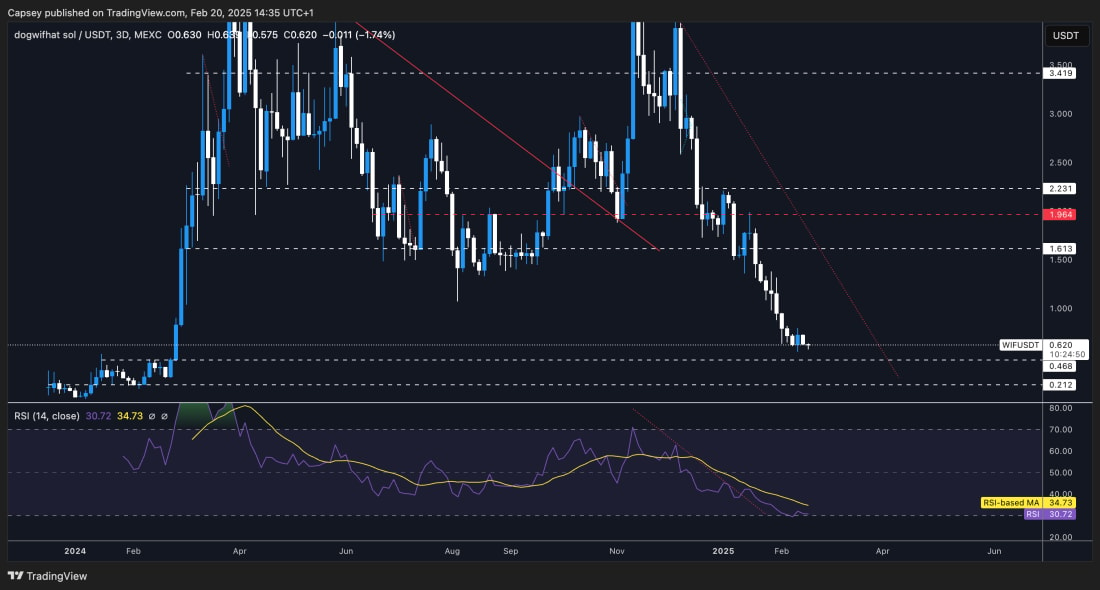
- Next Support: $0.60 (then $0.46)
- Next Resistance: $0.72 - $0.80
- Direction: Neutral/Bearish
- Upside Target: $0.80
- Downside Target: $0.46
Cryptonary's take
For now, the TA doesn't provide significant value when assessing WIF. This has been more of a narrative story, where WIF and memes in general just generally haven't had a supportive narrative and therefore we've seen them sell off substantially. Until there is a real change back to a risk-on environment, we're not too interested in WIF in the meantime.We'll take some time to see where WIF settles and where it forms a base. This is where a certain price level might hold over a 4-6 week period. Once we get that information, we can start assessing when there might be an entry for a Long. But for now, we need to see it settle and for price to form a base.
POPCAT:
- POPCAT doesn't look too bad here.
- On Feb 6th, the price put in a bullish divergence in oversold territory which helped the price to get a small relief rally.
- We saw the price break out of its main downtrend and its RSI downtrend, however price pushed to $0.38 and was rejected.
- Price is now back and battling at one of the main horizontal supports of $0.23.
- Beneath $0.23, the major support is at $0.15. It's possible we see POPCAT range between $0.15 to $0.23 for a while, and this is its version of forming a base, for the price to then go higher from there later on.
- $0.38 to $0.40 is the new major horizontal resistance level.
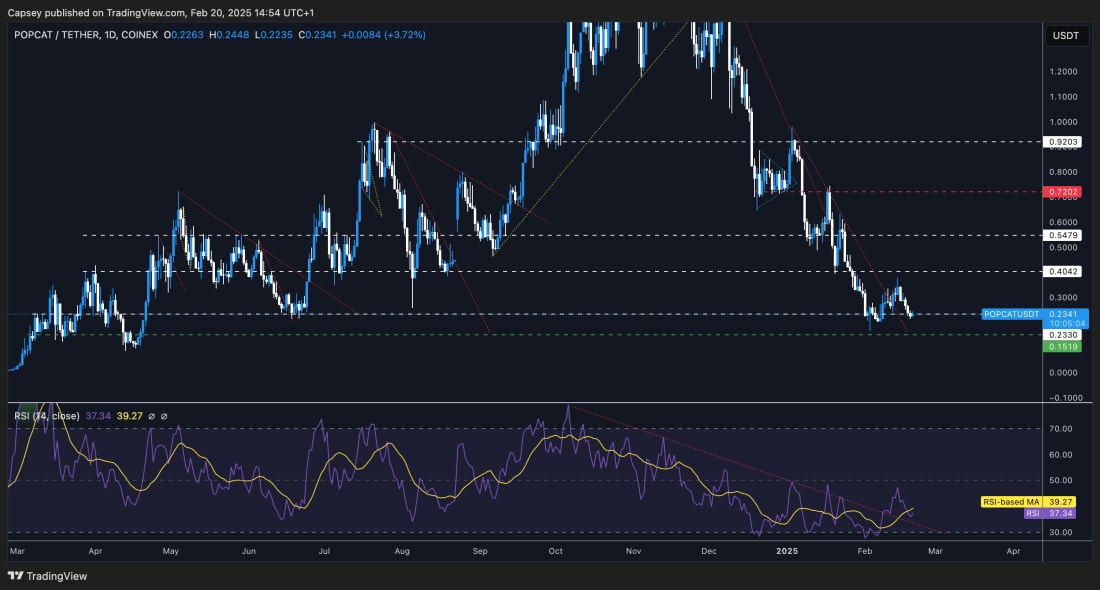
- Next Support: $0.23 (then ($0.15)
- Next Resistance: $0.38
- Direction: Neutral/Bearish
- Upside Target: $0.38
- Downside Target: $0.15
Cryptonary's take
SPX:
- So far, SPX has done well to hold the $0.56 level and the price has bounced twice from there.
- Price is now moving into the horizontal resistance of $0.76 and the main downtrend line. It's possible that SPX might buck the trend (of memes) and break out to the upside here.
- However, we do note declining volumes, and that'll need to pick up to see a more sustained break most likely.
- If the price does break out, the key level we'll be watching is $0.92, but call it $0.90 to $1.00. If the price were to reach this level ($1b MCap), SPX would look attractive as a Short opportunity.
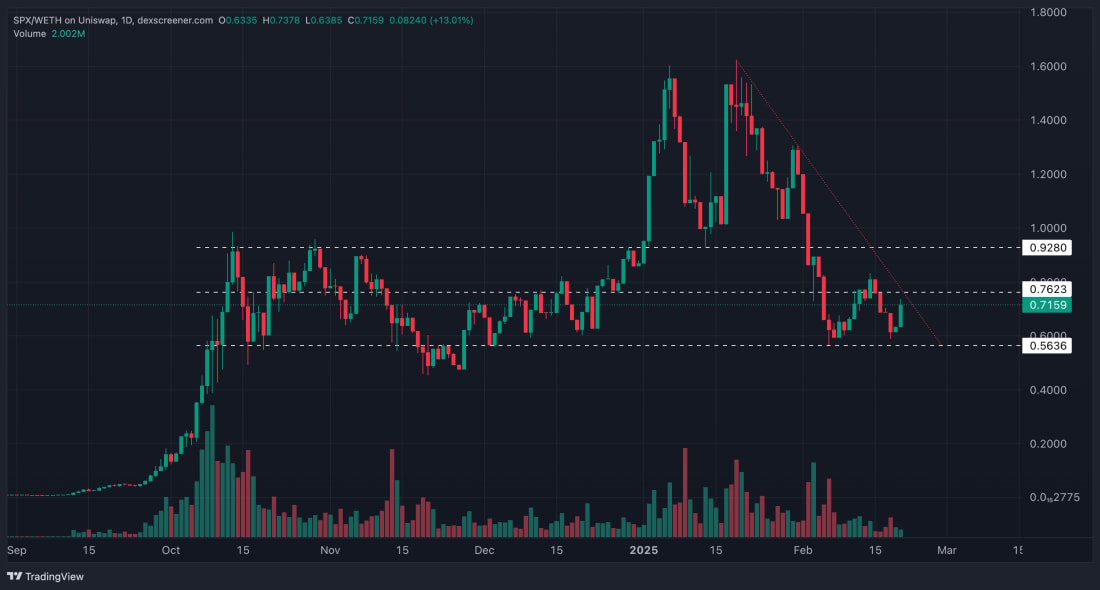
- Next Support: $0.56
- Next Resistance: $0.76 ($0.92)
- Direction: Neutral/Bullish
- Upside Target: $0.92
- Downside Target: $0.56
Cryptonary's take
LTC:
- Litecoin is one of the coins that's rumoured to likely get ETF approval in the coming months or quarters, hence it's been bid up.
- Currently, Funding is flat, so there is an even mix between Longs and Shorts here. Longs likely chasing ETF approval. Shorts likely getting in to anticipate the hype dying out and LTC pulling back.
- We're seeing the price but up into its horizontal resistance at $136 and also the downtrend line.
- A break out of the downtrend line and horizontal resistance, and the price could be $150 to $160.
- The RSI is also in a downtrend with it also above its moving average, along with not being in overbought territory.
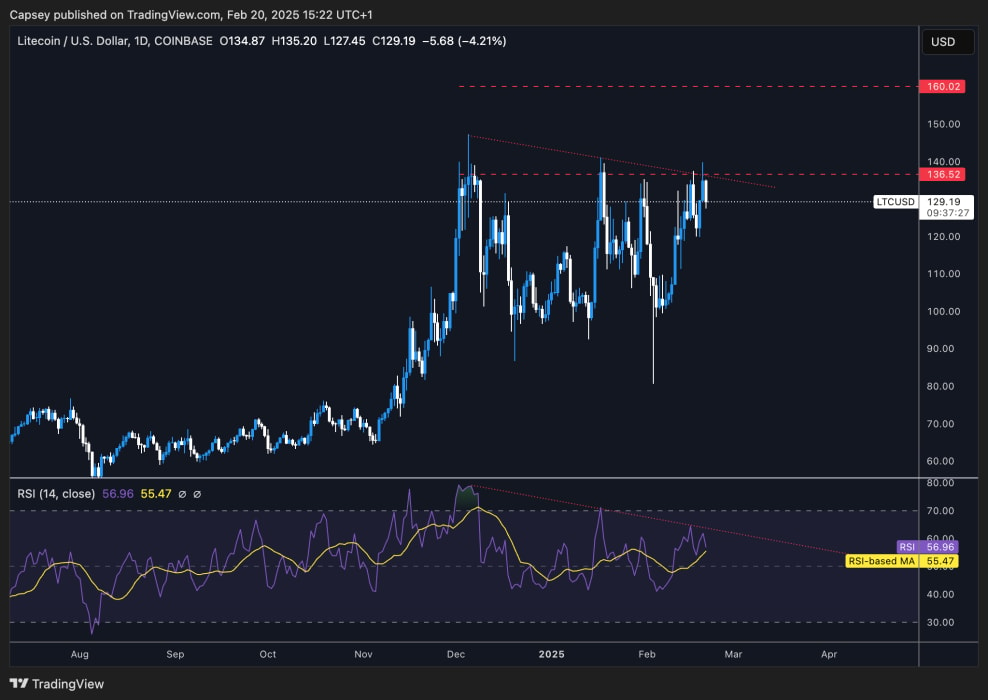
- Next Support: $110
- Next Resistance: $150 - $160
- Direction: Neutral/Bullish
- Upside Target: $160
- Downside Target: $110
Cryptonary's take
If the price were to break out and head towards the $150 to $160 area, this may set up an opportunity for Short Litecoin. This would likely see Litecoin be overbought and fundamentally Litecoin isn't a great play. The only thing it's really got going for it is the ETF narrative.For now, we'll wait and see if the price can break out to the upside and give us the opportunity.
Recommended from Cryptonary


