Save 23% ($351) & Get a Free 1-1 Call with our Team ⏰ : 0d 2h 59m 43s
Price prediction on Bitcoin, Ethereum, Solana & memecoins
The crypto market is poised for action as major assets show signs of potential volatility. Bitcoin, Ethereum, Solana, and meme coins all display intriguing market mechanics that could lead to significant price movements in the coming days.

Bitcoin's open interest has surged to recent highs, but with a twist - a substantial build-up of shorts could fuel a squeeze.
Dive into our detailed analysis to navigate these choppy waters and position yourself for what's to come.
Key questions
- BTC: Is the recent surge in open interest setting the stage for a dramatic short squeeze, or are we on the verge of a leverage flush? What key price levels should traders be watching?
- ETH: With the ETF launch and rising open interest, how vulnerable is Ethereum to a potential pullback? What's the significance of the current battle at critical technical levels?
- SOL: Solana has broken out, but is it overextended? Discover the key support zones that could make or break SOL's next move.
- WIF: This meme coin darling continues to impress, but where might the next buying opportunity arise? Find out our long-term price targets that may surprise even the most bullish investors.
- POPCAT: After invalidating bearish signals, what's the next major hurdle for POPCAT? Learn about the potential consolidation zone that could fuel an explosive move.
Disclaimer: This is not financial or investment advice. You are responsible for any capital-related decisions you make, and only you are accountable for the results. "One Glance" by Cryptonary sometimes uses the RR trading tool to help you quickly understand our analysis. These are not signals, and they are not financial advice.
BTC
Market mechanics
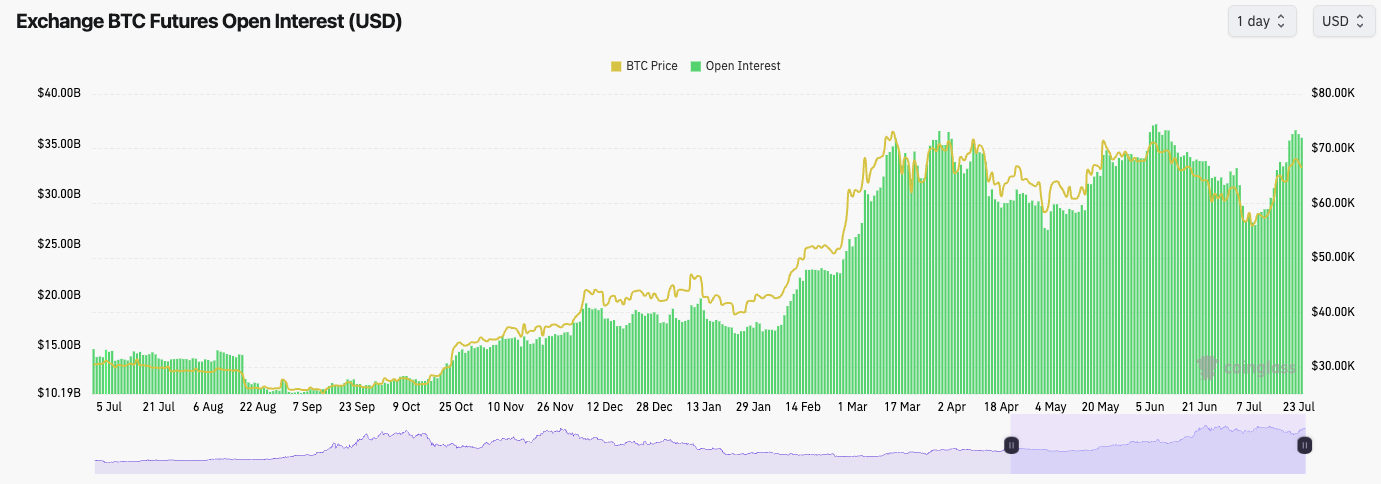
In the last few days, Bitcoin's Open Interest (amount of leverage) has returned to the highs we saw in early June and late March. On each of these occasions, the excess leverage was flushed out due to a sharp move down in price. Longs being liquidated.However, this time, the Funding Rate is positive, but it's close to flat. This means that in this leverage build-up, there is a substantial amount of Shorts built up. This opens the door to a further Short Squeeze, although now less likely due to the price being down 3% from its local highs.
Over the coming days (1-7 days), we should expect a more volatile move that will likely wipe out the Open Interest.
BTC Open Interest:
Technical analysis
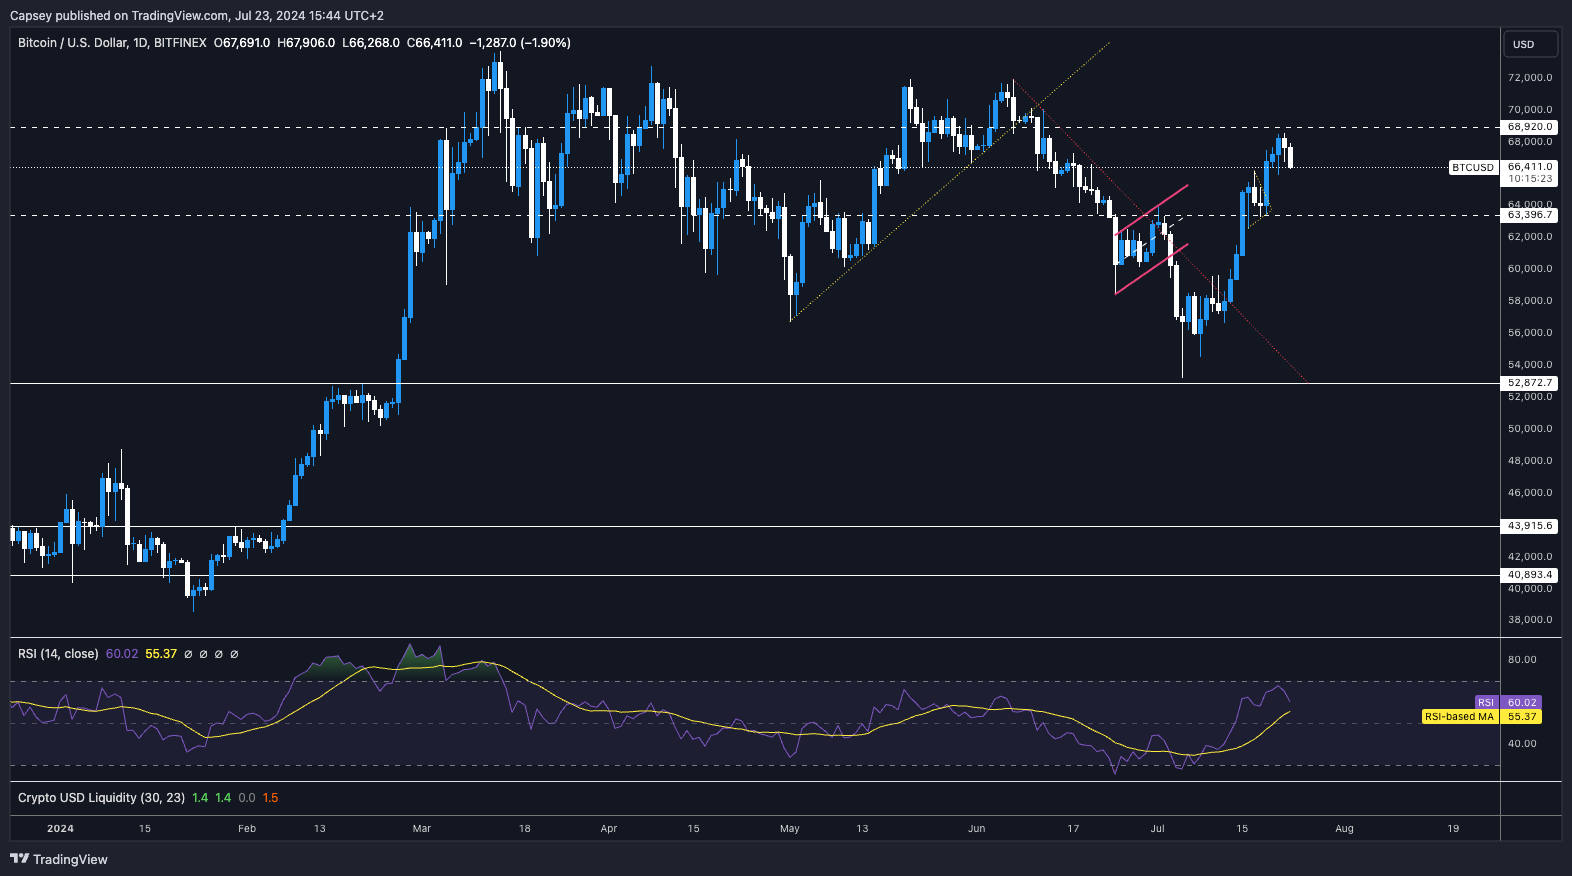
- Price has found some resistance at the horizontal level of $68,900, having risen tremendously following the breakout of the downtrend line.
- The key levels to the upside for price to break out from are $68,900 and $71,500.
- If price were to break down in the short term, we would expect the $63,400 horizontal level to hold as support. Local support is also at $65,000.
- As BTC approached the late $68,000s, the RSI approached very close to overbought territory.
- If the price dropped to $63,400 and bounced, that would begin the formation of a Head-and-Shoulders pattern (a bearish pattern). We will need to keep a close eye on this.
Cryptonary's take
The amount of leverage that has built up is now at the higher levels we've seen over the last few months, resulting in a price pullback.Now, the setup this time is different because not all the added leverage (Open Interest) is Longs, but the chances are that we get a slight flush out, which likely see price come down a tad.
If $65,000 can be held, fantastic, but we'd be open to this next move, potentially pulling back to the horizontal support of $63,400. If $63,400 is broken to the downside, then essentially, we'd have seen a lower high put in, and Bitcoin would no longer hold a bullish structure. This could then lead to a move back to $60,000. However, this would still be within Bitcoin's macro range.
Ultimately, we believe $63,400 is enough of a support, that if it is retested, BTC can hold above this level and then grind on higher from there.
So, we expect a slight pullback in the coming days, and then we believe that Bitcoin can recover from the weekend. Let's see.
ETH
Ethereum faces its own challenges as it battles key resistance levels amid the launch of spot ETFs.Market mechanics
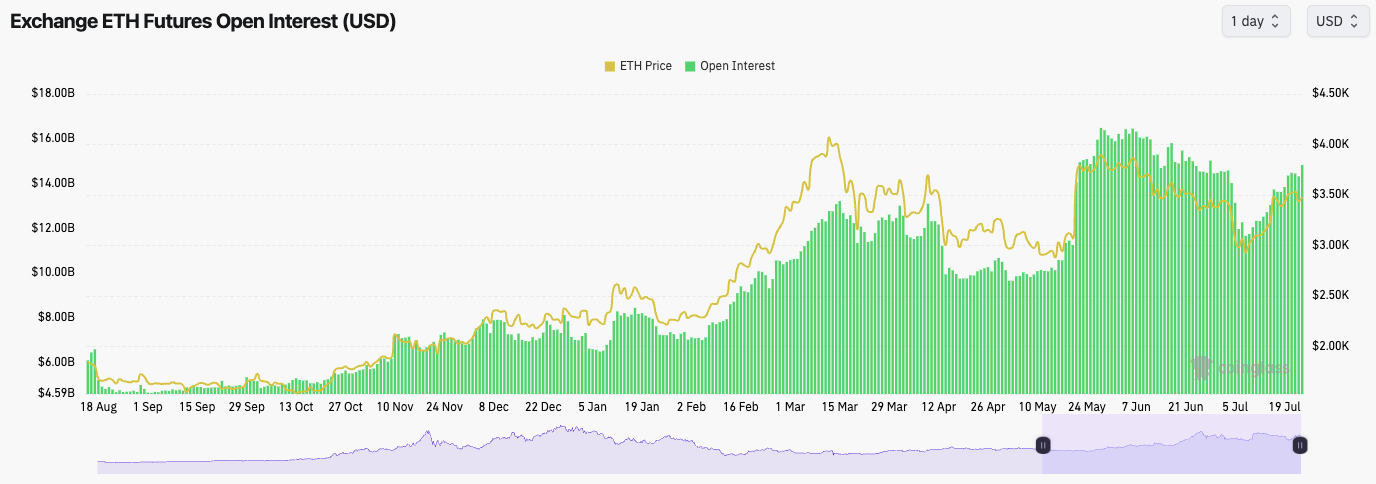
Like Bitcoin's Open Interest (amount of leverage), ETH’s Open Interest has also risen since the price lows in early July.ETH's Funding Rate, unlike Bitcoin's, is quite positive, meaning that most of the Open Interest that has gone on is Longs. This does potentially open the door for a flush out in price = price lower.
ETH Open Interest:
Technical analysis
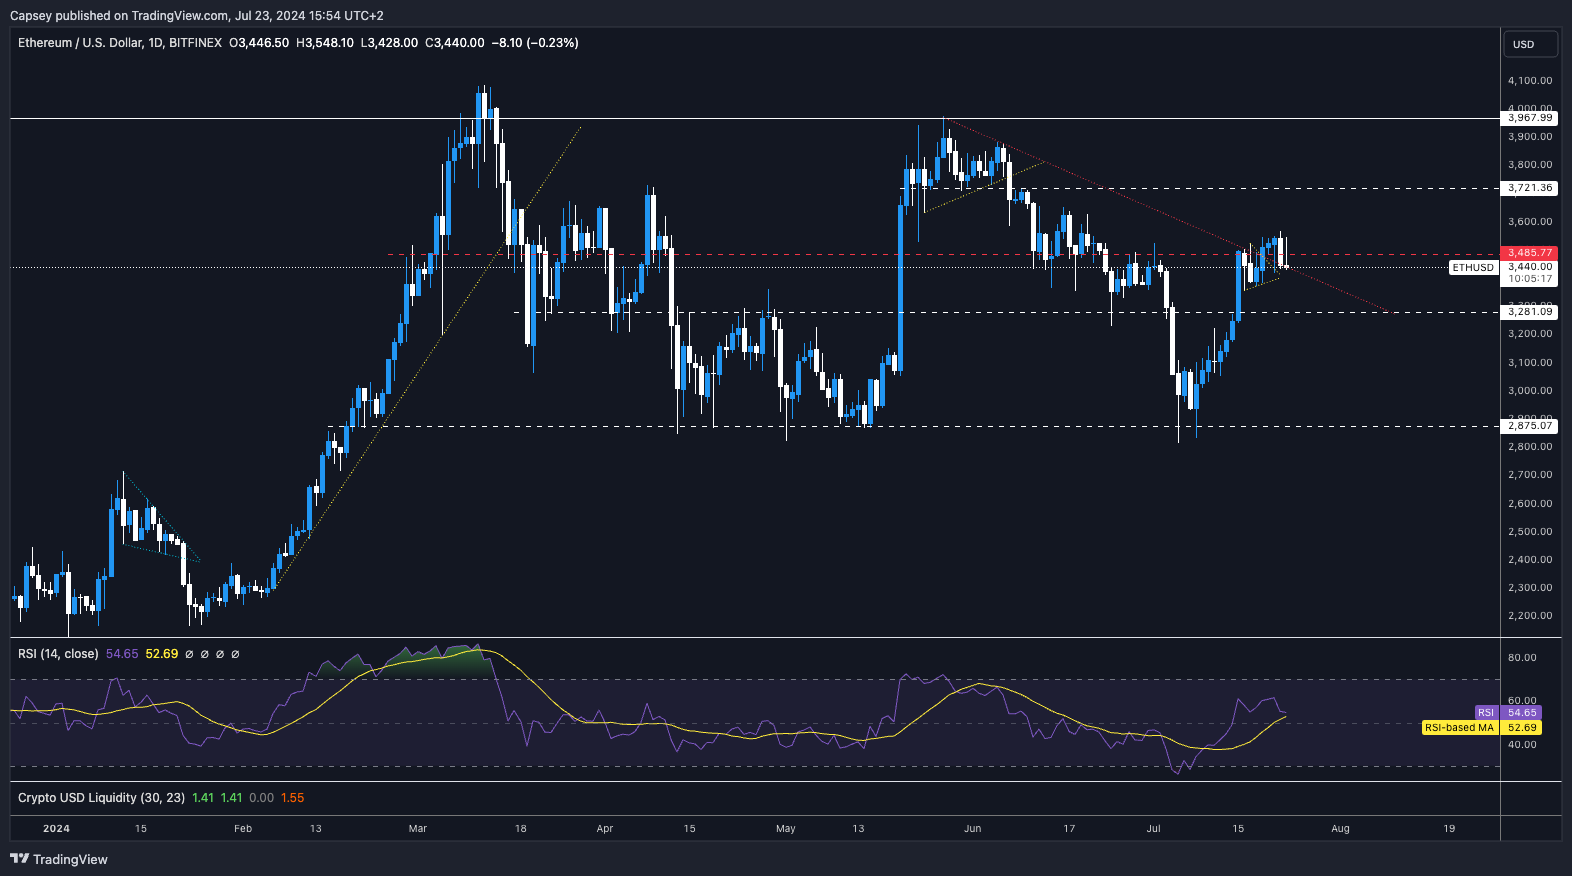
- ETH is still battling to break out from the downtrend line; however, it is also battling at the horizontal resistance of $3,485. These two levels together provide a sticking point for ETH here.
- To the upside, the $3,720 is the main resistance to clear in the short term.
- To the downside, the level to hold for price is the horizontal support at $3,280. We're expecting a move down to retest this level.
- The RSI is still in clean territory at 54, neither overbought nor oversold. From this perspective, there are no worries.
Cryptonary's take
With the ETH ETF going live and with Open Interest ramping up going into it, especially with the majority of this being Longs, ETH could be vulnerable to a pullback here unless the ETF inflows are super strong.The overall setup here isn't as positive today as it was a week ago, given we've had a potential breakout of the downtrend line, which is struggling to see momentum, and now we have a large buildup of Open Interest.
The most likely outcome in the short term is a retest of $3,280, but we think price could bounce from that level.
SOL
Solana, despite its recent breakout, may be overextended and due for a pullback.Market mechanics
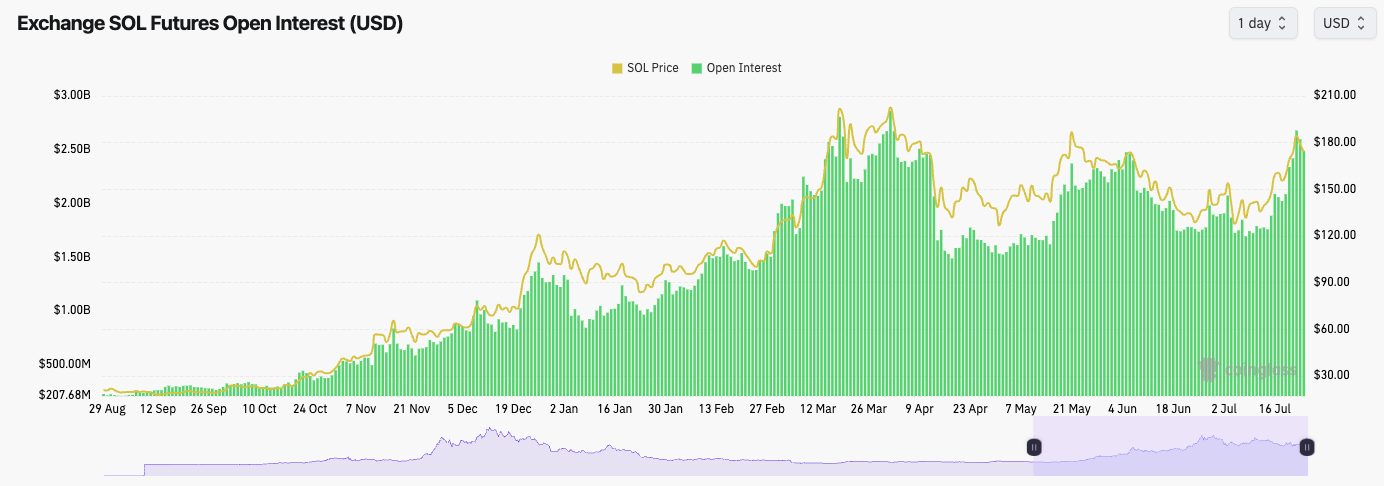
Similar to BTC and ETH, but perhaps even more exaggerated, SOL has seen a substantial increase in Open Interest, up more than 30% in just the last 10 days alone.SOL's funding rate is positive here, which suggests that a lot of the open interest that has come on recently (the leverage positions taken out) is Longs.
From a mechanics perspective, SOL might also be vulnerable to a slight flush out here.
SOL Open Interest:
Technical analysis
- SOL has gotten a clean break out of the horizontal resistance of $162 and the main downtrend line.
- There is local support at $170, but the major support is at $162. If the price pulls back, which we believe it might, we'd like to see this zone (between $162 and $170) held and the price bounce from there.
- If price cannot hold above $162, then technically, the next major support is $131, but we're not confident that we see SOL pull back as far as that.
- To the upside, the key level for SOL to break out from is $190 and then $205. Clearance above $205 and the all-time high of $255 is next.
- On the recent move higher, price did move into overbought territory, so it's not unusual that we see a slight slowdown here.
Cryptonary's take
Long-term, we're super bullish on SOL, but in the short-term, it's possible we see a slight pullback, possibly back to $162. However, we do think this level can hold and provide support for price to bounce on higher. Ultimately, prices are still range bound until we see that major break out to the upside. Key levels there are as we suggested above; $190 and $205.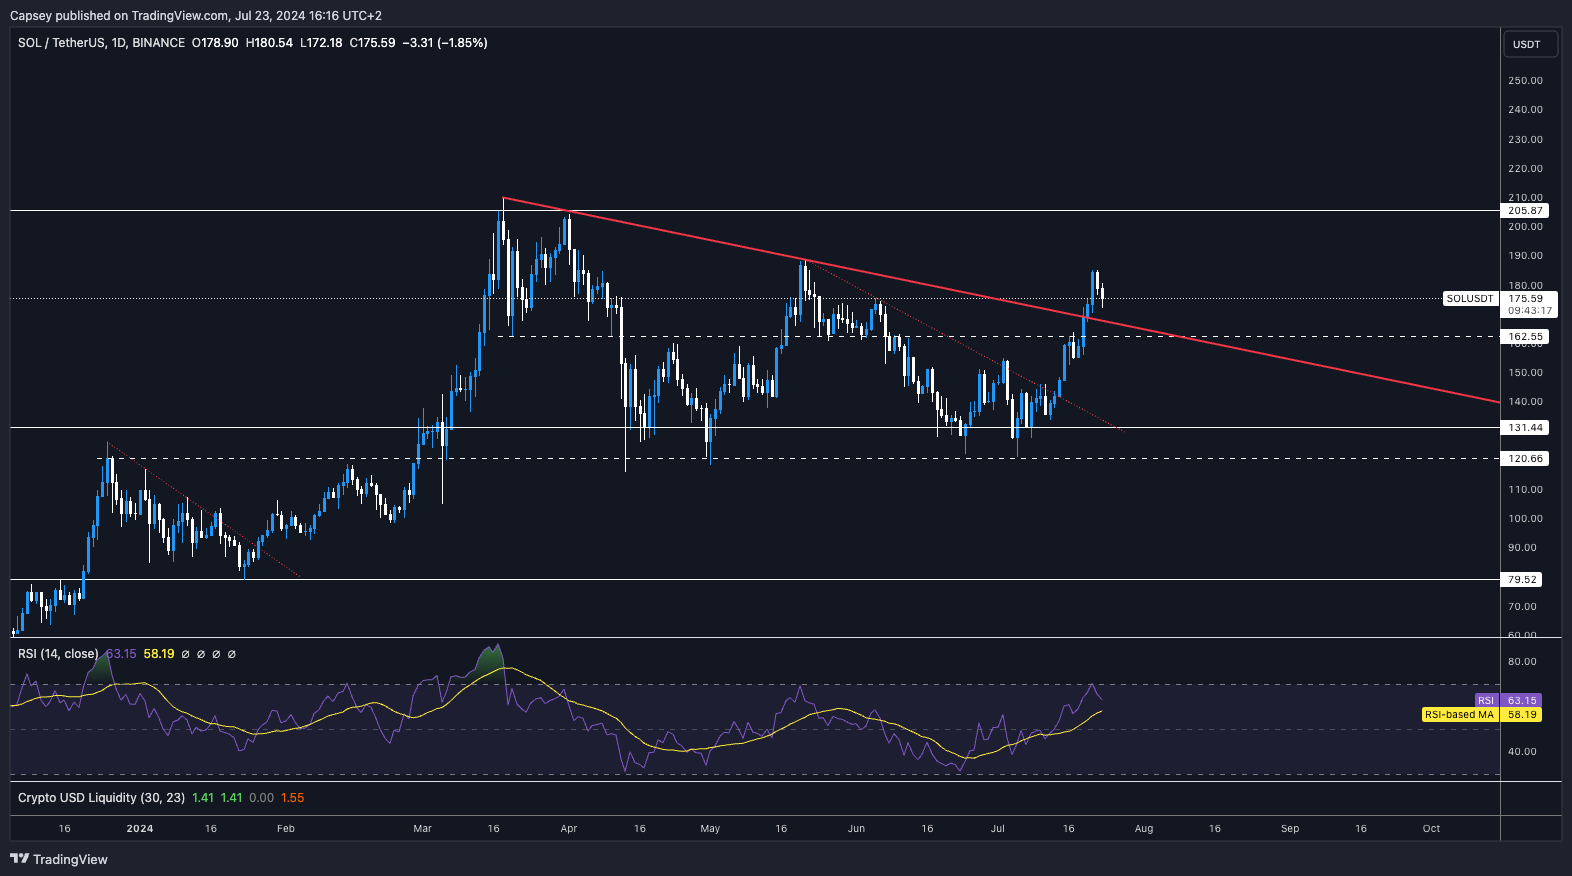
WIF
WIF has seen an increase in Open Interest, but nowhere near the highs it saw back in late May.The funding rate is at 0.01%, indicating that the leverage that has come on is the majority, Longs.
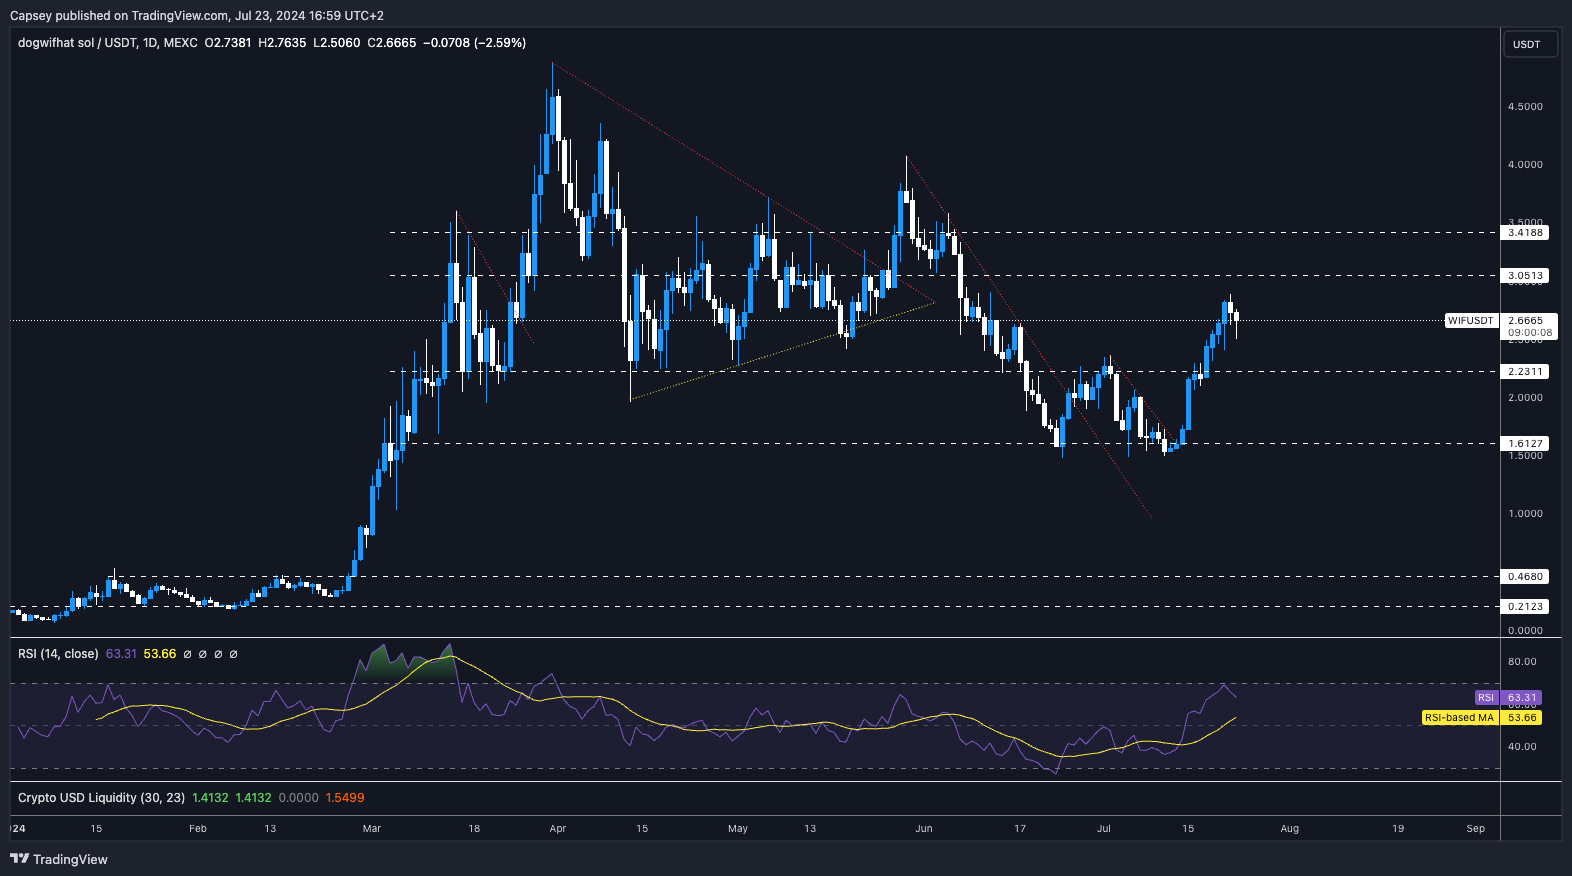
WIF has done superbly to climb back above $2.20 and make further progress higher. Price has stalled out around $2.80 after the RSI moved into overbought territory.
To the downside, the $2.20 area seems to be the most likely major support. If price were to re-visit this area, we would consider buying more WIF.
To the upside, the key level to still break above of is $3.05.
For an in-depth look at market performance, see our analysis on dogwifhat (WIF).
Cryptonary's take
The last 10 days or so have shown us that when WIF begins a move, it can really move, and if you're not exposed, you feel very left behind. WIF is one of our best long-term plays for this cycle. Therefore, we continue to hold Spot bags, and we'd consider adding to our Spot bags if price retests $2.20.However, we did risk-on more with WIF in the $1.60s two weeks back. For those under-exposed, $2.20 is a potential area to add to bags. In the next 6-12 months, we expect upside price targets well north of $10.
$10 is likely a very conservative price target.
POPCAT
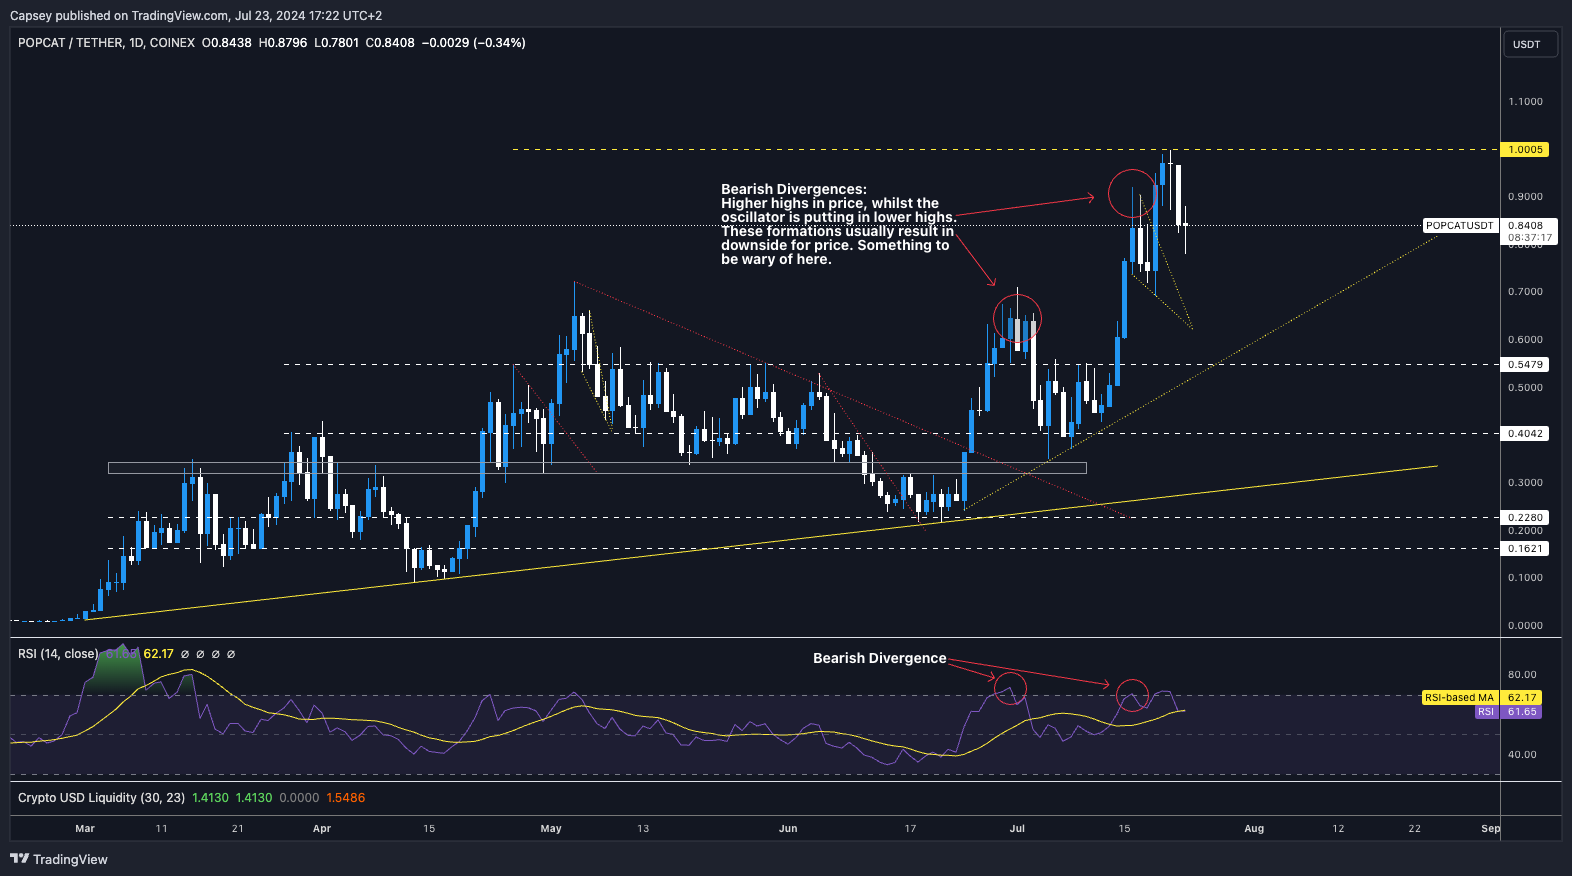
POPCAT managed to invalidate the bearish divergences it had picked up. However, price has still pulled back slightly, having been in overbought territory on the RSI.Price also rejected at the $1.00 level, which we had pointed out could be a slightly more tricky psychological level to clear above.
There is a local support at around current price, in the low $0.80s. The more major horizontal support is a zone between $0.65 and $0.72.
The major breakout level is the psychological horizontal resistance of $1.00. Beyond that, we could see short-term upside targets of $1.40 achieved relatively swiftly.
Cryptonary's take
We may see a small period of cooling off here, having put in a really good last 10 days or so.Ultimately, a building of support between $0.65 and $0.90 would be very good for a larger move higher at a later date. If we were to see a period of consolidation, that would then produce the next upside price targets of between $1.20 and $1.40.
If we were under-exposed to POPCAT, the place we'd be looking to bid it is between $0.65 and $0.72. But for now, we remain very patient in just holding on to our Spot bags.
Recommended from Cryptonary


