Save 23% ($351) & Get a Free 1-1 Call with our Team ⏰ : 0d 2h 59m 44s
Price prediction for BTC, ETH, SOL, WIF, POPCAT, and SPX
BTC is facing key resistance at $63,400, while ETH is trying to break above $2,557. SOL, WIF, and POPCAT are showing signs of moving up, and SPX is in a bullish pattern. Let’s take a look at the next moves for these assets.
Disclaimer: This is not financial or investment advice. You are responsible for any capital-related decisions you make, and only you are accountable for the results.
BTC:
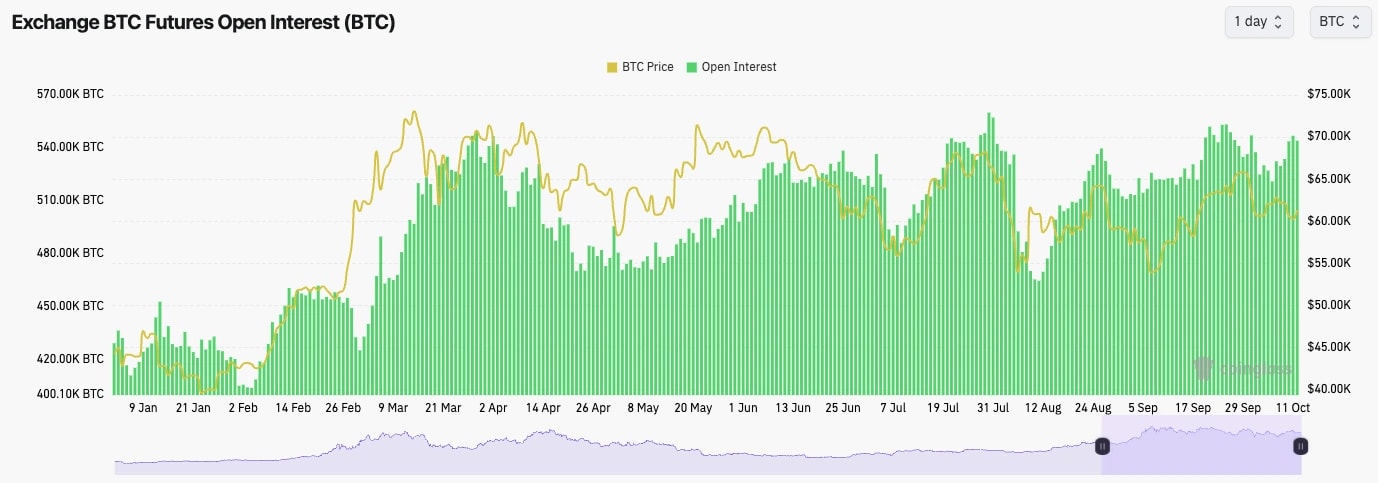
- BTC's Funding Rate has flip-flopped between slightly negative and slightly positive over the past few days, as traders have been shaken out of positions and are unsure of price direction in the near term.
- Overall, Open Interest remains high, indicating that there is still a lot of leverage.
Technical analysis
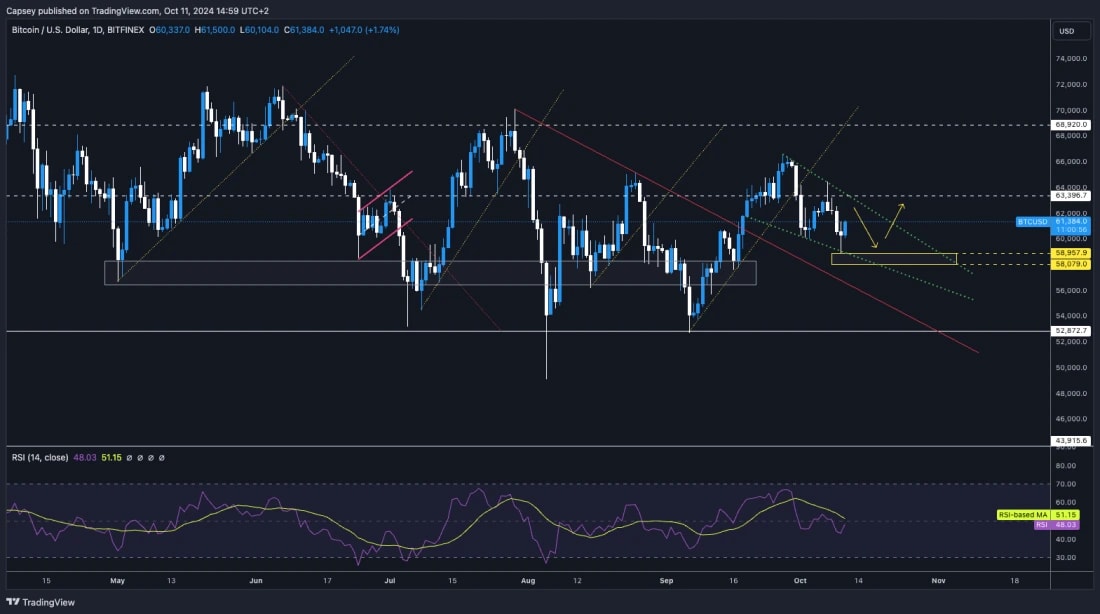
- Following the bounce from the $60k area, BTC rejected into the horizontal resistance of $63,400.
- BTC then bounced off the top of the Yellow support box between $58,000 and $58,900. We expect this area to continue to hold as the main support.
- BTC is also in a descending wedge on the local timeframe, which is a bullish pattern.
- The RSI has reset and is in the middle territory, with no divergences in play at the current time.
- To the upside, the $63,400 remains the main horizontal resistance over the shorter timeframes.
- To the downside, we'd expect the $58,000 to $58,900 area (Yellow Box) to hold as support if the price were to retest this area again.
- Next Support: $58,000
- Next Resistance: $63,400
- Direction: Neutral
- Upside Target: $63,400
- Downside Target: $58,000
Cryptonary's take
With not much data out over the coming weeks, and with the US election just 4 weeks away, risk appetite in markets may be more subdued. For this reason, we expect there won't be any major breakouts until after the election.In the short term, we expect Bitcoin to trade between $58,000 and $63,400, and our expectation is for the price to break to the upside when a breakout does eventually occur. Over the coming days and fortnight, we expect the price to follow a path similar to the Yellow arrows. Range-bound action for now, but it is possible we will see a light upside over this weekend.
ETH:
- Interestingly, ETH's Open Interest has soared to a new high.
- And whilst both BTC and SOL currently have negative funding rates (Short bias amongst traders), ETH's is positive at 0.01%.
- Perhaps we're beginning to see traders position bullishly for ETH.

Technical analysis
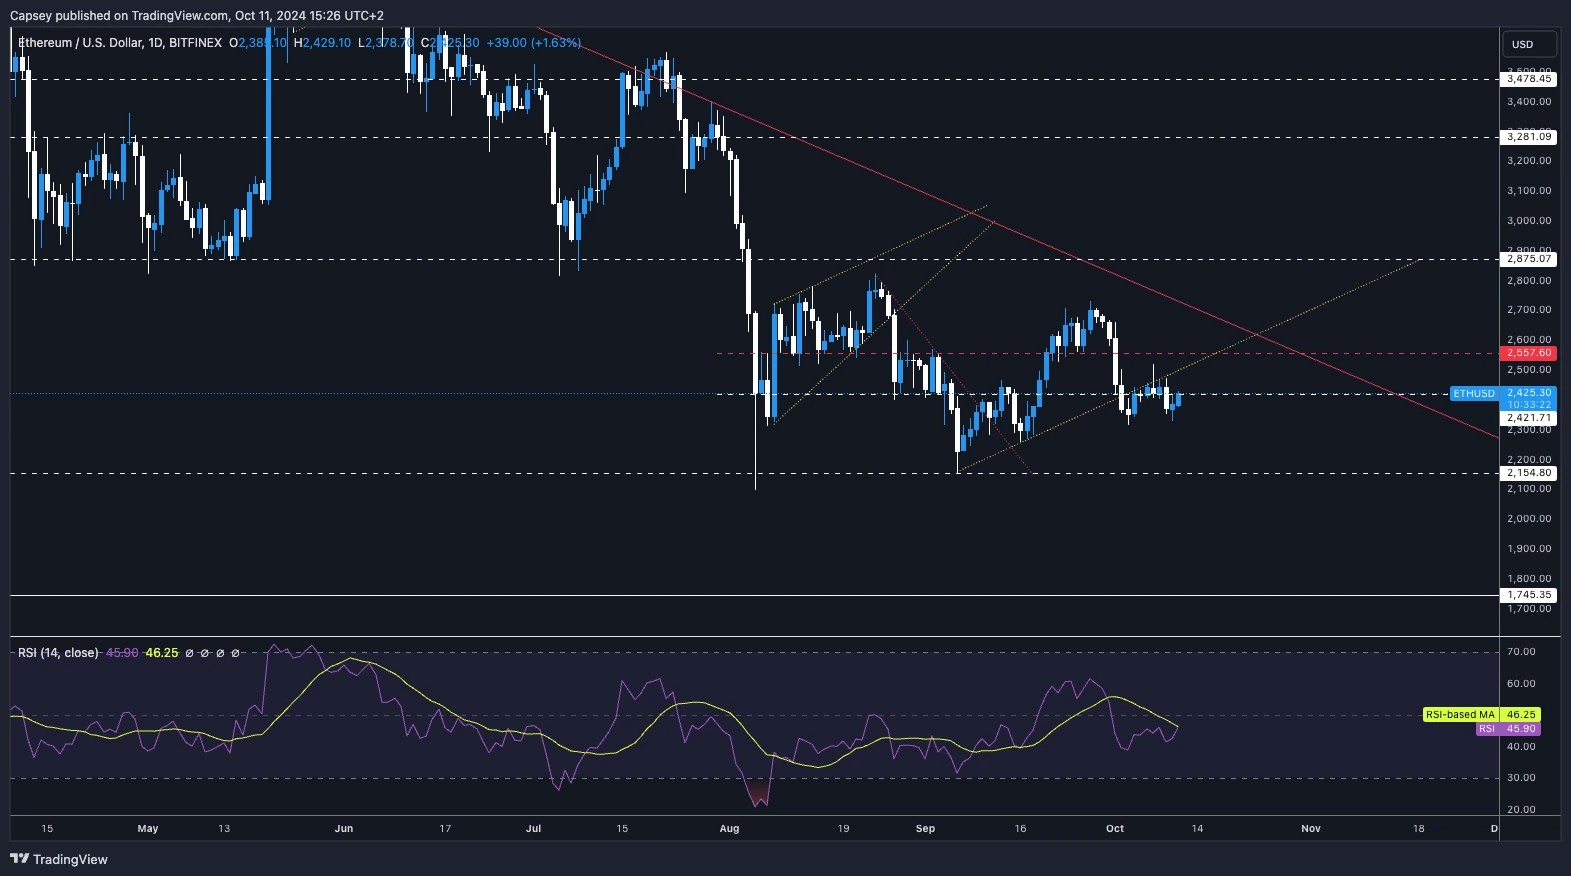
- ETH remains below its local uptrend line, whilst price is currently battling at the $2,420 horizontal level.
- If ETH can break out to the upside, it will need to reclaim the uptrend line, the main horizontal resistance at $2,557 and now potentially also the main downtrend line (red line).
- To the downside, we expect $2,300 to be local support, with the major support at $2,150.
- The RSI is in the middle territory but is not potentially running into resistance to its moving average.
- Next Support: $2,300
- Next Resistance: $2,557
- Direction: Neutral
- Upside Target: $2,557
- Downside Target: $2,300
Cryptonary's take
Chart wise, ETH still looks to be struggling as it's currently beneath a few key resistances. If we're right and Crypto in general can grind slightly higher over the weekend, then this may help ETH to move up to $2,557.However, we still expect the market to be somewhat subdued, so over the coming week, we'd expect the price to be range-bound between $2,300 and $2,557. A breakout of $2,557 we'd take as the bullish signal and the potential sign of a larger timeframe bullish reversal.
SOL:
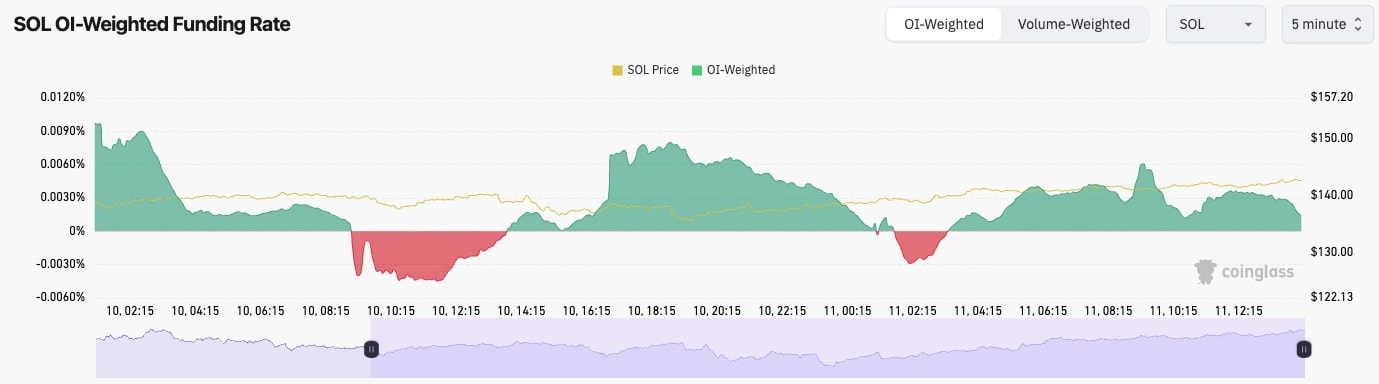
- SOL's Open Interest is back close to its highs, having spiked higher again over the last few days.
- Alongside this, the Funding Rate is currently negative, although it has flip-flopped from positive to negative a lot over the past few days. This indicates indecision amongst traders.
Technical analysis
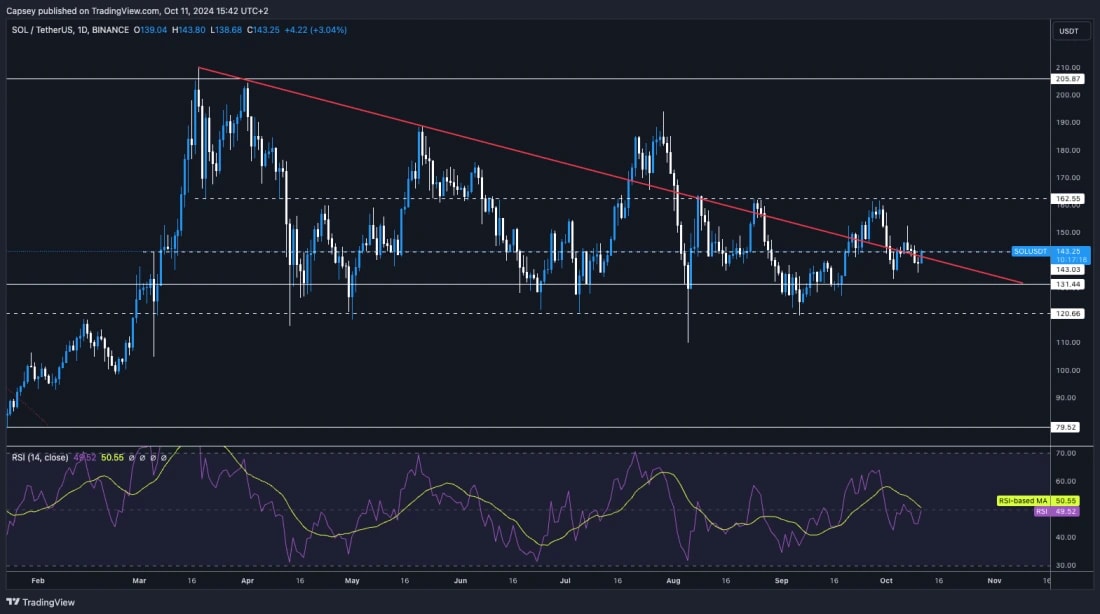
- And we continue with the range-bound price action, with $143 acting as a local horizontal level acting as both local support and local resistance.
- To the upside, the main resistance is at $162.
- On the downside, the main support is the zone between $120 and $131. We expect this area to continue to act as support.
- The RSI is in the middle territory but is now running under the Moving Average.
- Next Support: $131
- Next Resistance: $162
- Direction: Grind Higher/Neutral
- Upside Target: $162
- Downside Target: $131
Cryptonary's take
Very boring price action from SOL, and to be honest, probably up until the election we're expecting more continuation of this boring range-bound price action. However, this does give room to Meme's to garner the attention in the shorter term.Over the weekend, we might see a slight pop higher from SOL, potentially even close to retesting $162, however we're not sure we'll see a further bullish breakout of $162 just yet.
WIF:
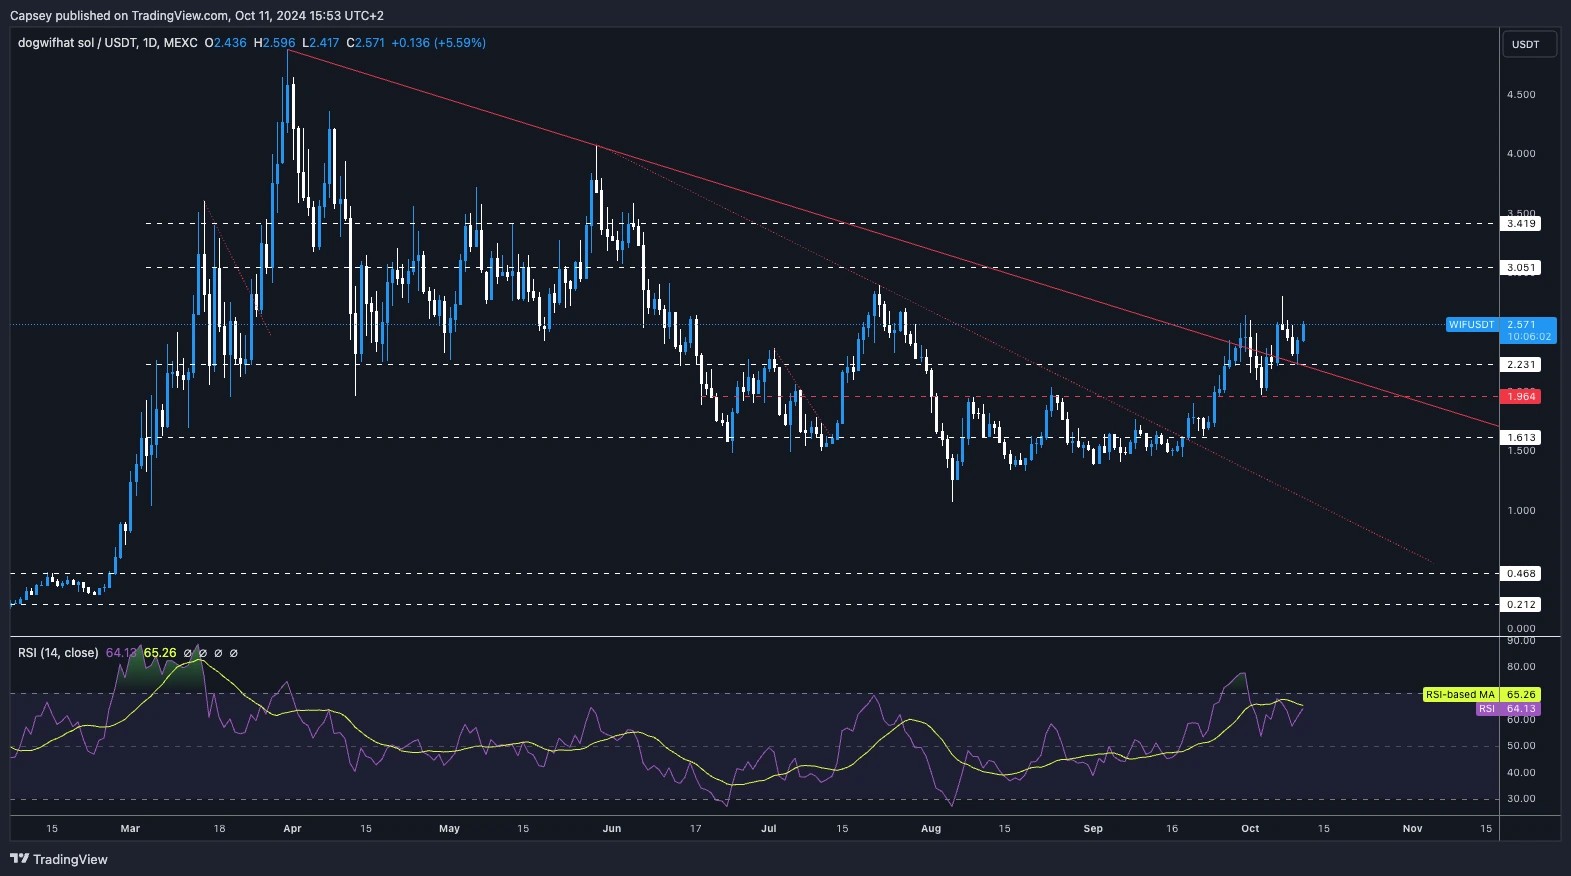
- WIF has broken out of the main downtrend line and is comfortably above what was previously a major resistance zone between $1.96 and $2.20.
- We had seen a bearish divergence (higher high in price and lower high on the oscillator) form in overbought territory, but that has reset somewhat now.
- To the downside, we'd expect $1.96 to $2.20 to act as a major support zone.
- To the upside, $3.05 is the next major horizontal resistance.
- Next Support: $2.20
- Next Resistance: $3.05
- Direction: Bullish
- Upside Target: $3.05
- Downside Target: $2.20
Cryptonary's take
WIF looks good to go higher here. If the wider market holds up well, we'd expect to see WIF at $3.05 sometime in the coming 7 days.POPCAT:
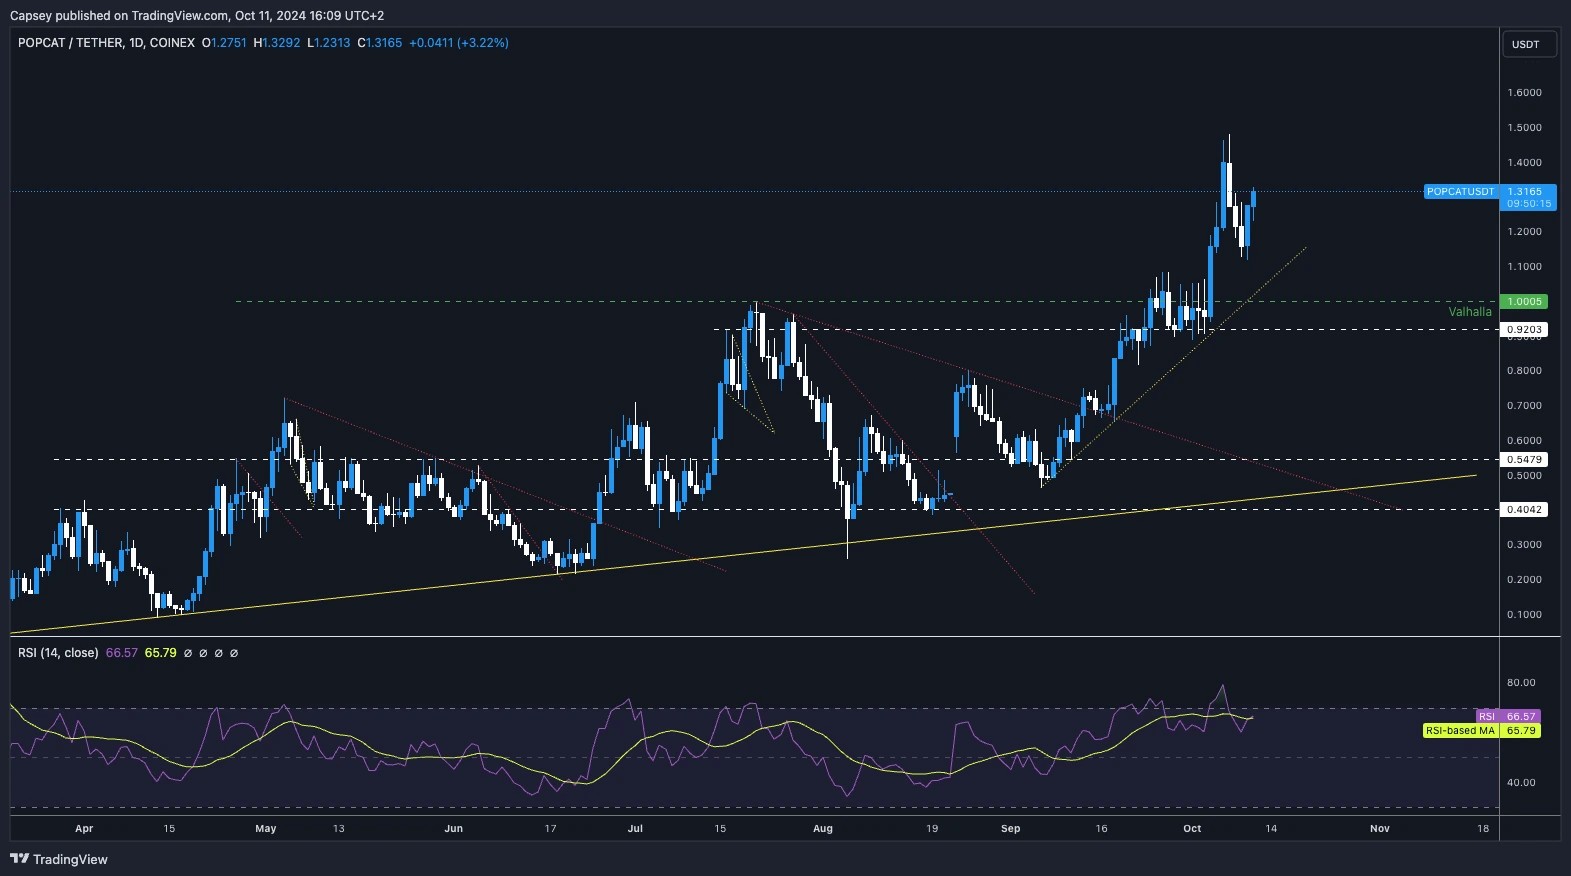
- After breaking out of the $1.00 to $1.08 region, POP went in to price discovery to the upside. It peaked close to $1.50 and then saw a more than 20% pullback.
- The price is now pushing higher again, with the RSI having reset somewhat, which had previously been very overbought.
- To the downside, we'd expect $0.92 to $1.08 to act as new support range with likely only a 'black swan' event taking price beneath this level.
- To the upside, the prior all-time highs would be the local resistance, but potentially not much of a resistance.
- Next Support: $1.08
- Next Resistance: $1.50
- Direction: Neutral/Bullish
- Upside Target: $1.60-$1.80
- Downside Target: $0.92
Cryptonary's take
If we're right on the wider market grinding higher over the weekend, and WIF pushing up to $3.05, then it's possible that POPCAT can break above it's all-time highs and potentially test to $1.60 to $1.80 region.SPX:
What. A. Move.Note, we're assessing SPX here on a 4hr timeframe chart just to give us more candle stick information.
- SPX is in a major uptrend and is now forming a bullish pennant pattern. If the price were to break out, the upside target would be a retest of the all-time highs.
- On the downside, we have support at $0.40 and $0.48. However, if SPX does go through a major pullback at some point (like most memes do), then it's possible we will see lower.
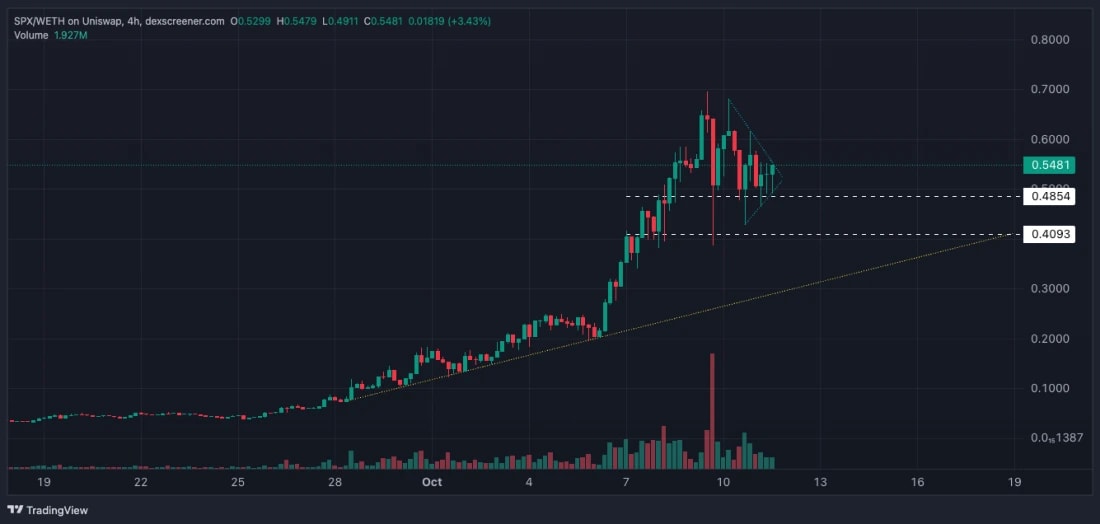
- Next Support: $0.40
- Next Resistance: $0.69
- Direction: Neutral/Bullish
- Upside Target: $0.70 (short-term)
- Downside Target: $0.40
Cryptonary's take
Just an unbelievable run, in my Crypto career so far, I haven't seen many things run like this. Crazy. It's possible that SPX has a major pullback at some point, however it's currently set up in a bullish pennant that could see price break to the upside and potentially retest all-time highs. Let's see what we get.Recommended from Cryptonary


