Save 23% ($351) & Get a Free 1-1 Call with our Team ⏰ : 0d 2h 59m 43s

Will Bitcoin break free from its short-term weakness? Can Ethereum capitalise on its positive momentum? And why are we sceptical about meaningful upside in Solana in the short term?
Today’s Market Direction report delves into the intricacies of these market dynamics.
The crypto market never sleeps, and neither should your vigilance.
Let's dive in!
Disclaimer: This is not financial or investment advice. You are responsible for any capital-related decisions you make, and only you are accountable for the results.
BTC
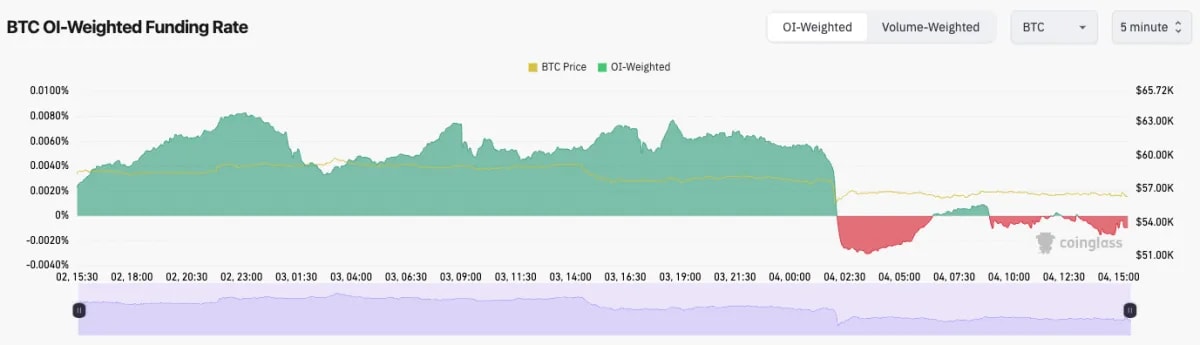
- BTC's Funding Rate is currently negative, meaning that there is a bias among traders to be short.
- BTC's Open Interest has increased as prices have gone lower, again indicating that the action is mostly from traders piling into fresh short positions here.
- The above is somewhat dangerous, and if we begin to see a significant spot bid, this could drive a short squeeze.
Technical analysis
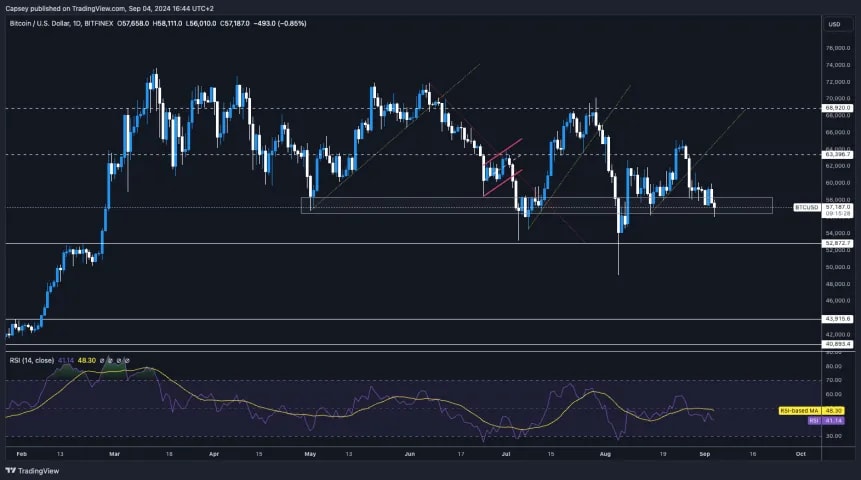
- BTC broke below the local uptrend line and has now found support at a local level in the grey box between $56,400 and $58,300.
- Below the grey (support) box, the next major horizontal level of support is at $52,800.
- In order for BTC to get the bullish reversal, it would need a clean reclaim of $63,400, which currently seems a long way off. We're also not expecting this anytime soon.
Cryptonary's take
From a technical perspective, this looks like the area Bitcoin should bounce from, possibly forcing a move up to $61k. However, and this is just me (Tom) personally speaking, I don't feel super confident about the market here, although I don't feel confident about that call either. In these types of situations, it's best to remain positioned, as our mid- and longer-term outlook remains bullish/favourable. But in the short term, we're unsure how Bitcoin might move.ETH
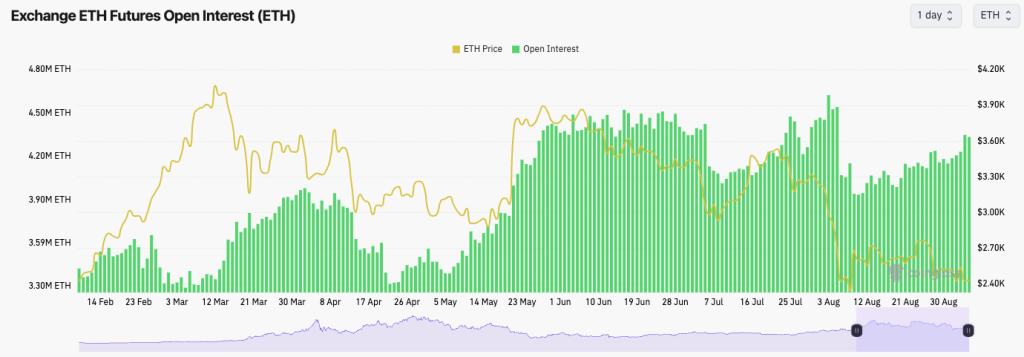
- ETH's Funding Rate is positive and meaningfully positive, so there isn't the short interest built up in ETH like in BTC.
- ETH's Open Interest has increased over the last few days, and with ETH's Funding Rate going from negative to meaningfully positive, that suggests that longs have gone on here and in a relatively healthy manner.
Technical analysis
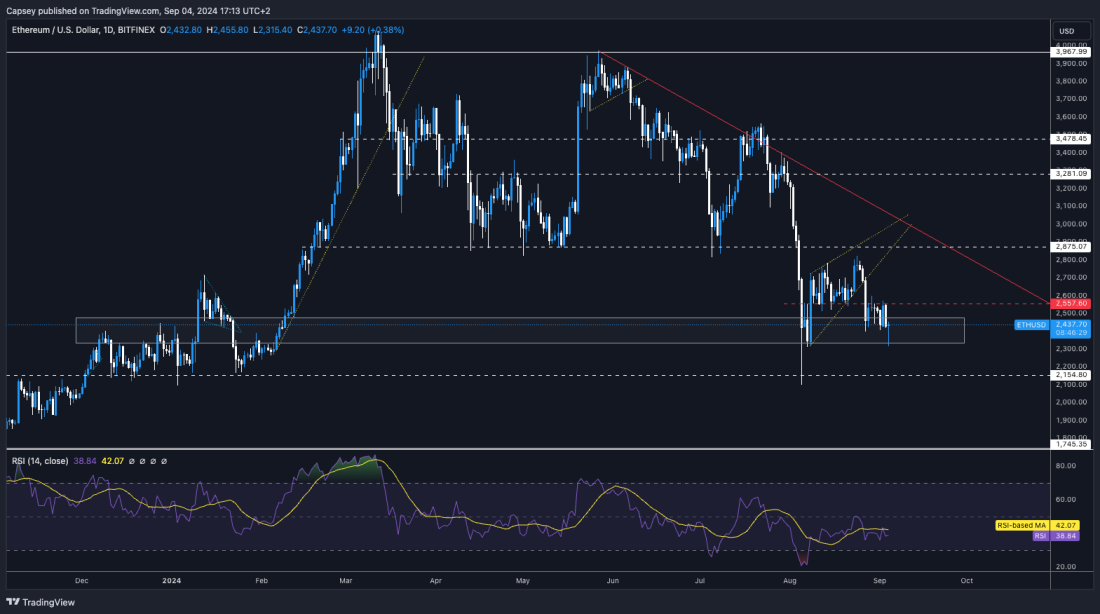
- ETH has found strong support in the support box we outlined so far; however, for price to see a bullish reversal, it will need to reclaim above $2,557.
- Beyond $2,557, the next major horizontal resistance is at $2,875, although we don't see ETH reclaiming this in the immediate term.
- To the downside, we'd expect the grey box to continue holding as local support. However, the major horizontal support is at $2,150.
- The RSI is not in oversold territory, but it's at 39, which is low, so there is room to bounce here.
Cryptonary's take
In terms of the majors, ETH looks the most attractive for a higher trade. It has broken down from its higher range and then found support at an old range (between $2,150 and $2,400).We still like ETH for a bounce play here, potentially to as high as $2,875, although we don't expect it immediately, and it might take a few weeks. But, overall, the setup is nice here, and ETH from a technical structure is attractive.
Alongside this, ETH has seen a flushing out in its leverage market, also making it an attractive trade from that perspective.
SOL
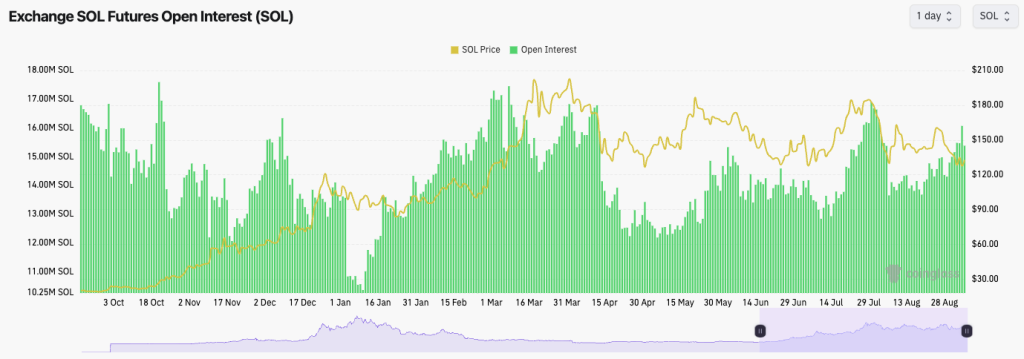
- SOL's Open Interest has increased substantially in the last few days as price has moved into the $130 area.
- We've also seen SOL's Funding Rate move from negative to positive, indicating that the Open Interest that has gone on is into longs.
- This is a healthy setup for a potential bounce in prices.
Technical analysis
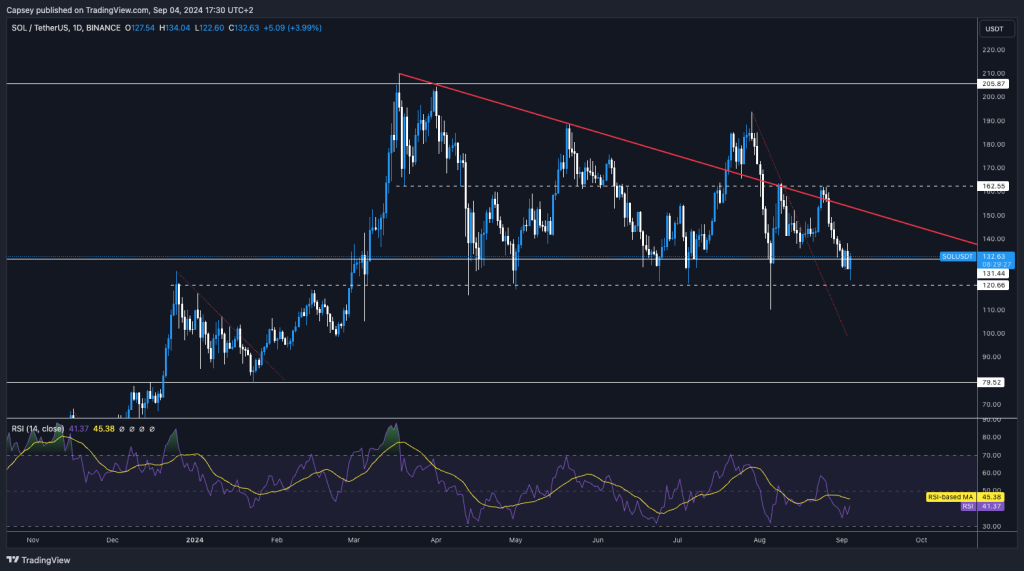
- SOL has moved into the $120 to $131 area, and so far, it has managed to bounce from that area.
- The RSI has put in a bullish divergence (a lower low in price but a higher low on the oscillator), which could help drive price higher.
- In the short term, this could drive price up to the local horizontal resistance of $141.
- To the upside, $141 is the local horizontal resistance, while $162 remains the major horizontal resistance.
- When we zoom out, we can see that price is still squeezing into the pinpoint between the horizontal support box (between $120 and $131) and the red downtrend line. As price meets the pinpoint, it could break out from there.
Cryptonary's take
Ultimately, the $120 to $131 support zone has held for a long time now and has been tested many times, so it is somewhat surprising that it continues to act as strong support. For this reason, we are cautious about SOL price action here, even though we think in the immediate term that it can move up slightly higher to, say, $141.We remain super bullish in the long term but are sceptical of a meaningful upside in the short term. We wouldn't be surprised to see SOL retest $110 to $120 in the upcoming weeks.
Recommended from Cryptonary


