Save 23% ($351) & Get a Free 1-1 Call with our Team ⏰ : 0d 2h 59m 44s
Technical Analysis

While the broader market has shown strength, specific major assets have been moving in tandem, reflecting underlying shifts in market sentiment. The interaction between TOTAL market cap, key pairs like ETH/BTC and SOL/BTC, and the dominance of BTC and SOL provides critical insights into the ongoing market dynamics.
This report aims to delve into these movements, drawing correlations to offer a more comprehensive understanding of the market's current trajectory.
Disclaimer: This is not financial or investment advice. You are responsible for any capital-related decisions you make, and only you are accountable for the results.
TOTAL (Total Market Cap)
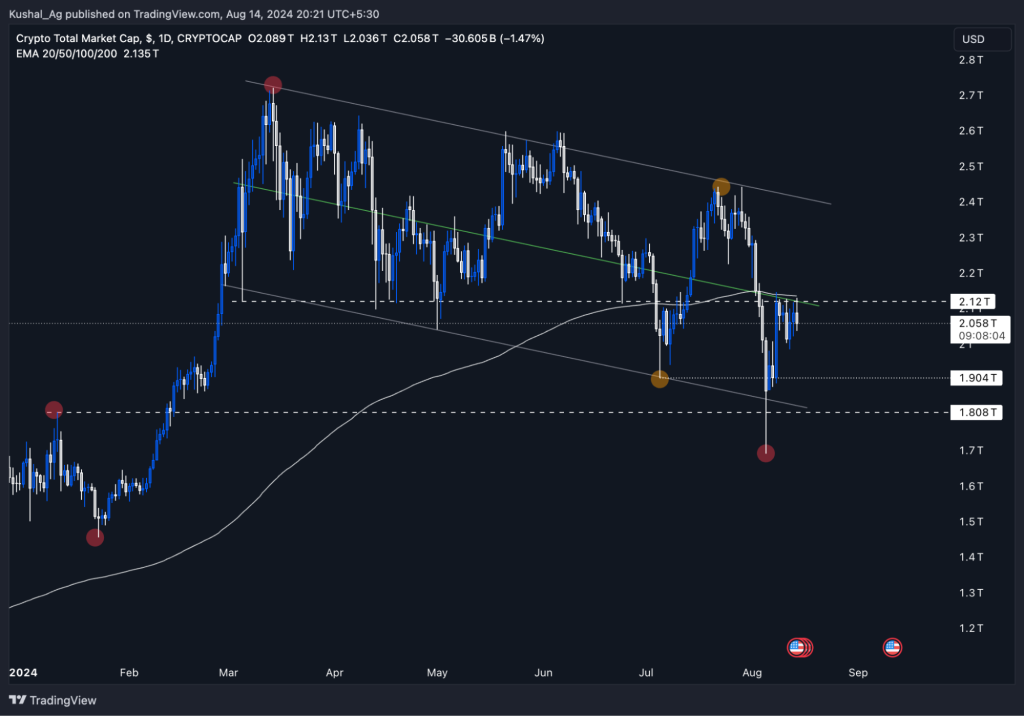
Current state: In the past few days, we've observed a recovery push on the upside for the majors, with BTC moving back into the $60k region, testing key areas of the bull flag, and then retracing slightly. This price action is reflected in TOTAL, where the $2.12T level has emerged as a significant resistance, bolstered by the presence of the 200 EMA just above it.Key observations
- Resistance: The $2.12T region is currently acting as a major resistance, with the 200 EMA (Exponential moving average) adding to the strength of this barrier. This level is critical for defining the upper boundary of the current price channel.
- Support: On the downside, there is now a solid support base around $1.9T, which could be tested in the coming days if the market continues to cool off.
- Potential scenarios:
- Bullish continuation: If the market can gather momentum and flip the $2.1T region, it would place the price in the upper channel of the bull flag, creating space for a move towards the $2.4T region. This would represent approximately a 15-20% space for further upward movement.
- Pullback and retest: If the market faces further downside pressure, we may see a pullback to the $1.9T support level. This area would likely provide a strong base for the next leg up, allowing for a renewed attempt to test and break the $2.1T resistance.
Conclusion
The market is at a pivotal point where the battle between resistance at $2.12T and support at $1.9T will determine the next major move. Flipping the $2.1T resistance will be crucial for unlocking further upside potential, while a pullback to $1.9T could provide a strategic accumulation zone before another attempt to break higher.ETH/BTC
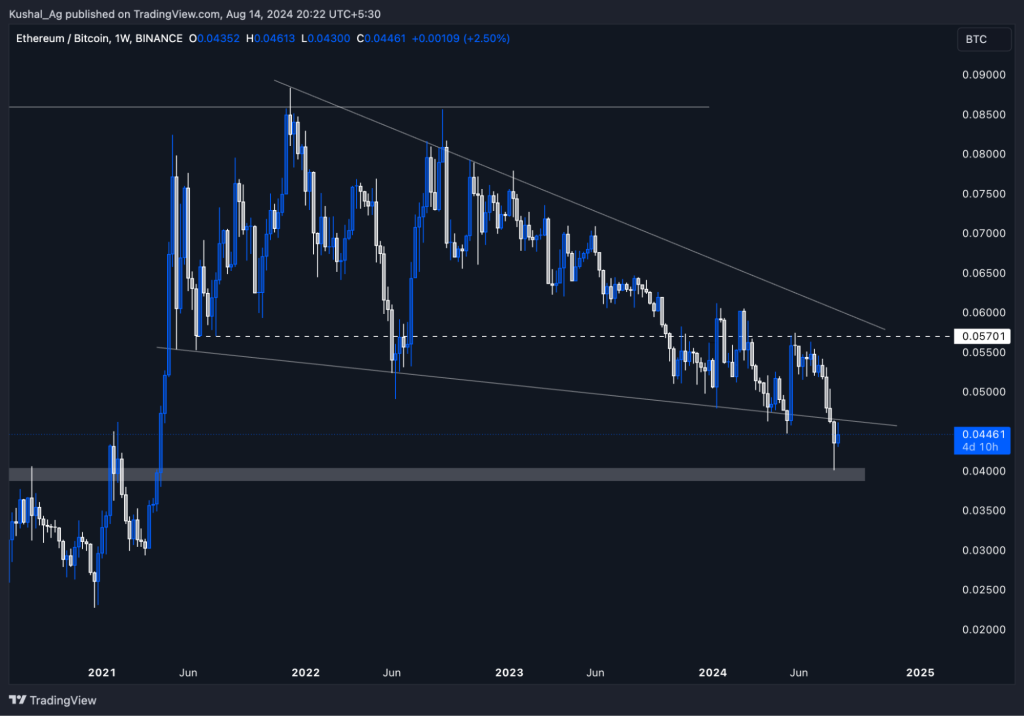
Current state: On the weekly timeframe, ETH/BTC has been trading within a longstanding falling wedge, a pattern that typically precedes a reversal. Recently, the price has tested and liquidated zones below the lower end of the wedge, around the 0.04 level. This zone has acted as a significant support, but we have yet to see a clear reversal in this script.Key observations
- Support: The 0.04 area has provided substantial support, with liquidity being tested and absorbed in this region.
- Resistance: A break into the 0.045 area and a move back into the wedge would be a strong signal for ETH and the broader altcoin market.
- Potential scenario: Should ETH/BTC break back into the wedge, the 0.057 level is the next significant resistance that needs to be tested. A quick move to this level could indicate the first liftoff phase for meme coins and altcoins.
Conclusion
ETH/BTC is at a critical juncture, where a move back into the wedge and a test of the 0.057 level could ignite a broader rally across altcoins. This script serves as a key indicator of altcoin performance against BTC, and its movements will be essential to monitor in the coming days.SOL/BTC
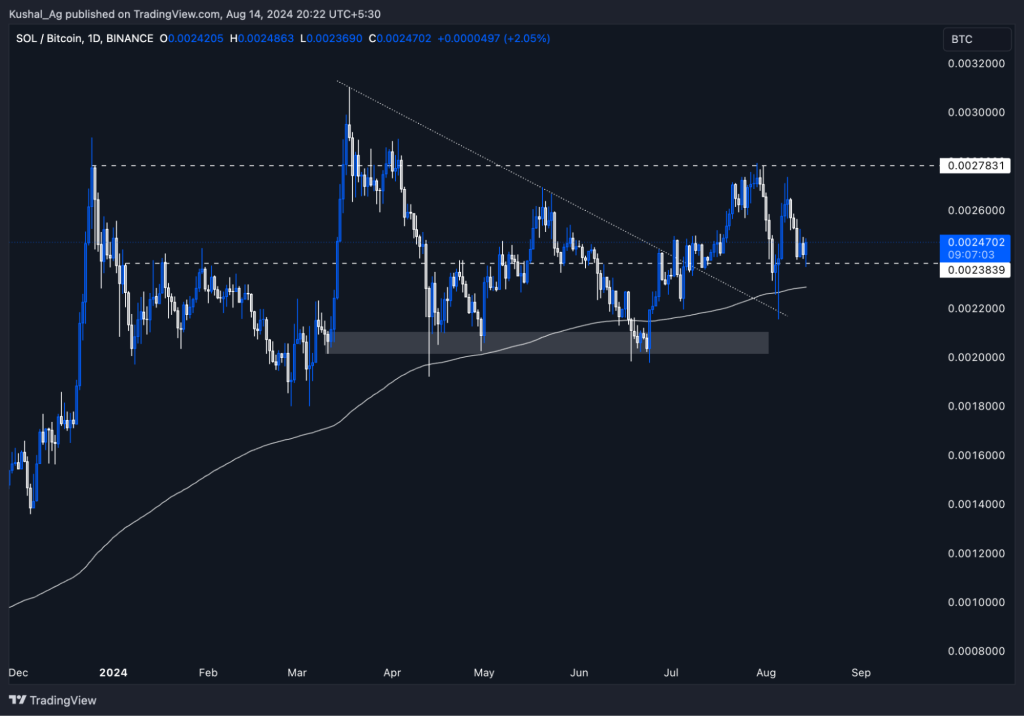
Current state: SOL/BTC is currently trading within a bullish structure, consolidating above the 200 EMA on the daily timeframe. The price has been squeezing in, breaking out of the downtrend line, and eventually retesting both the trendline and the 200 EMA after the breakout. This retest has established a new support level around the 0.0024 area.Key observations
- Support: The 0.0024 area is currently providing strong support, reinforced by the confluence of the trendline retest and the 200 EMA.
- Resistance: On the upside, the price is facing resistance around the 0.0028 area. This is the upper boundary of the current trading channel.
- Potential scenario: If SOL/BTC manages to break out of the 0.0028 resistance, it could trigger a significant upward move, potentially driving SOL to retest its all-time high of 0.0047.
Conclusion
SOL/BTC is poised within a crucial trading channel, with strong support at 0.0024 and resistance at 0.0028. A breakout from this channel could lead to SOL significantly outperforming BTC and the broader market, with the potential to retest its ATH as the market lifts off.SOL/ETH
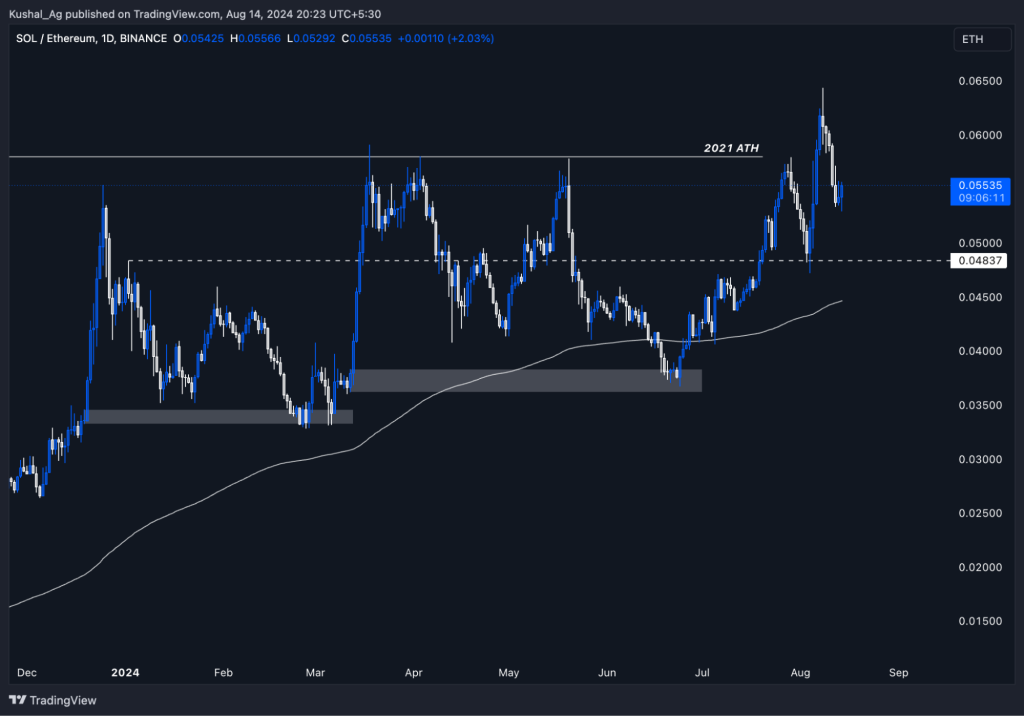
Current state: SOL/ETH has recently broken past its all-time high (ATH) of 0.058, which it first established in 2021. The pair is currently facing short-term resistance around this level and is pulling back into the 0.055 region. This pullback appears to be a preparation for another leg up into price discovery.Key observations
- Support: The price has formed a solid and lengthy base around the 200 EMA, maintaining this range for over 200 days.
- Resistance: The 0.058 level, being the previous ATH, is currently acting as resistance.
- Potential scenario: A break above this new high in SOL/ETH would significantly push SOL closer to its 0.1 target, potentially reaching four digits if ETH hits the 10k mark.
Conclusion
SOL/ETH is on the verge of a significant breakout, with a strong base at 0.05 and resistance at 0.058. A successful breach of this resistance could trigger a substantial rally, positioning SOL to achieve new highs.BTC Dominance (BTC.D)
Current state: BTC dominance has been moving within a rising wedge on the weekly timeframe for over two years, and it is now approaching the tip of this formation. This is a critical juncture where BTC.D could either break out or break down, significantly influencing the broader market.Key observations
- Resistance: The wedge's apex coincides with the 57% region, a historically significant level.
- Potential scenario: While BTC.D might rise to the 60% level in the coming days, this level could mark the peak before a breakdown from the wedge. A breakdown would likely result in a flow of capital from BTC into altcoins, initiating a potential alt season.
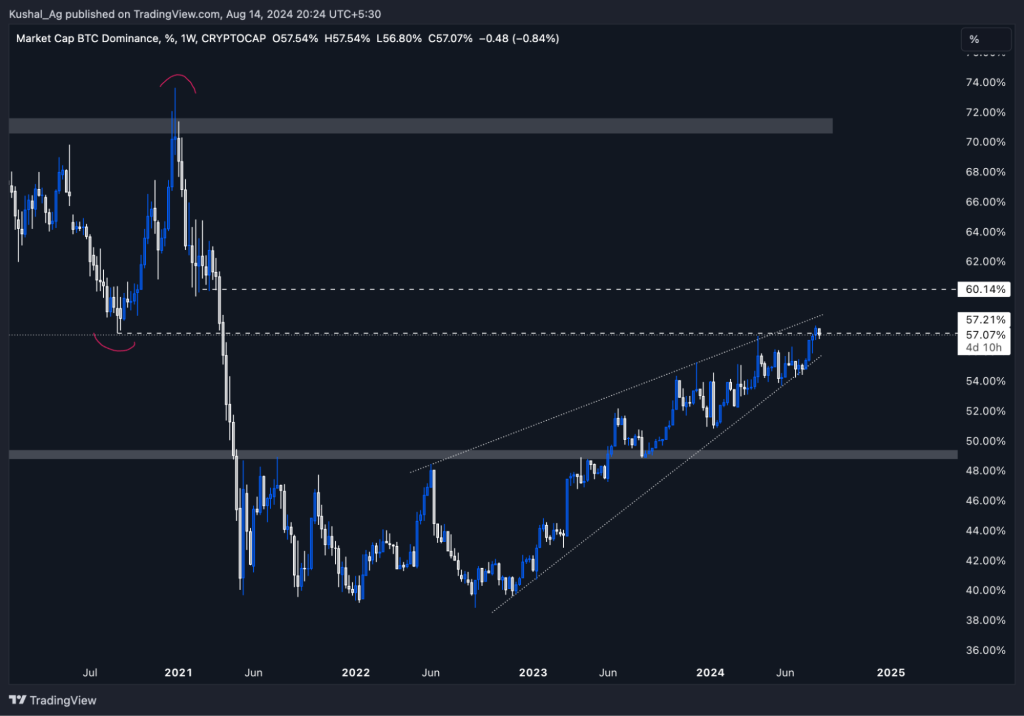
Conclusion
BTC dominance is at a pivotal point as it nears the apex of a two-year rising wedge. The 57% region is a key resistance to watch, with the possibility of a rise to 60% before an eventual breakdown. If BTC.D does break down, it could trigger a significant shift in capital flows towards altcoins, leading to a strong altcoin rally.SOL Dominance (SOL.D)
Current state: SOL dominance has been on a relentless upward trajectory since the beginning of 2023, starting from below 0.4% and climbing to over 3.3% today. This dramatic increase reflects SOL's growing influence in the crypto market as it continues to capture market share.Key observations
- Support: SOL.D has been forming a higher high and higher low bullish structure since breaking above its previous ATH of 2.88% in 2022.
- Market dynamics: The surge in SOL dominance indicates a significant shift in market preference towards SOL, driven by its ecosystem's rapid growth.
- Potential scenario: As SOL continues to capture more of the crypto market's share, we expect this dominance to increase further, solidifying its position as a leading chain.
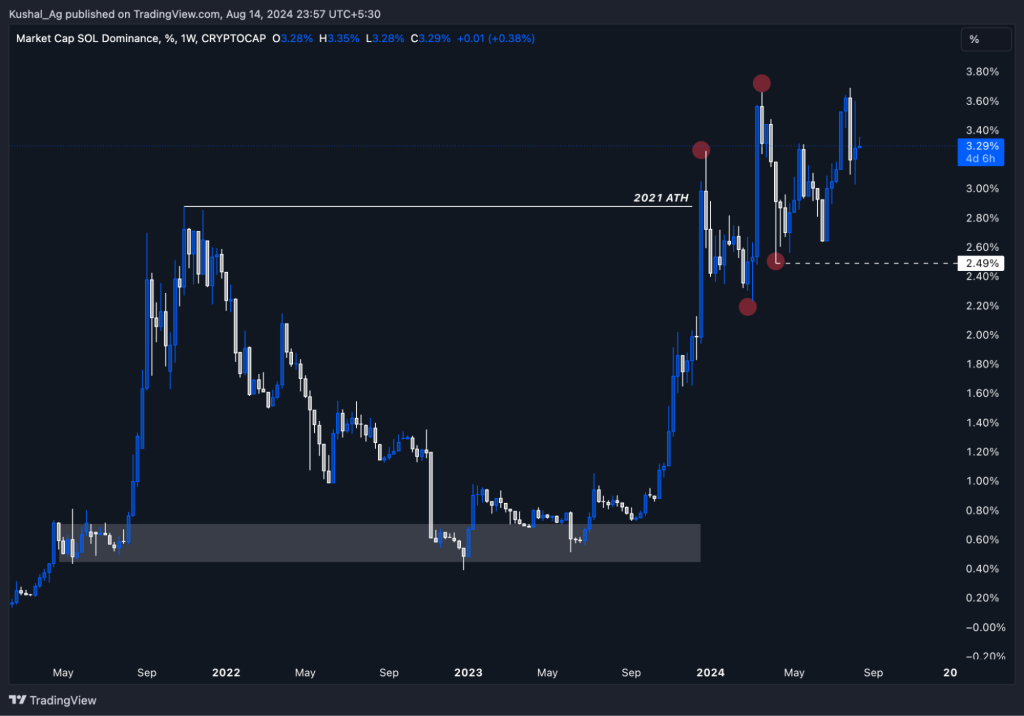
Conclusion
SOL.D is exhibiting strong bullish momentum, supported by a well-defined higher high and higher low structure. As long as the 2.5% support holds, SOL is poised for further gains, potentially driving its dominance even higher as it becomes increasingly integral to the crypto ecosystem.Cryptonary's take
- ETH/BTC and SOL/ETH: Both pairs are near critical junctures. ETH/BTC's potential reversal back into its wedge and SOL/ETH's push towards price discovery indicate a likely shift in capital towards altcoins, particularly SOL, which is already showing strength.
- SOL/BTC and SOL.D: SOL's dominance over both BTC and ETH is evident in its bullish structures across both pairs. SOL/BTC's potential breakout and the continued rise in SOL.D reinforce the narrative of SOL leading the next market cycle, especially if BTC's dominance breaks down.
The confluence of these factors suggests that while BTC may continue to hold sway in the short term, the real opportunities lie in the altcoin market, with SOL positioned at the forefront.
Recommended from Cryptonary


PRO
Market Updates
11 min read
Mar 27, 2026

PRO
Market Direction
11 min read
Mar 24, 2026

PRO
Market Updates
8 min read
Mar 23, 2026
