Save 23% ($351) & Get a Free 1-1 Call with our Team ⏰ : 0d 2h 59m 43s
There's a tug-of-war on crypto’s next move
We have had some big inflation data out today, with the data being the Fed's preferred inflation data, along with some alarming on-chain signals. These signals will alter our current stance towards the market regarding our level of risk on or off.
Let's jump into it.
Topics:
- Today’s PCE/inflation data and rate cut expectations.
- ETF Inflows.
- Alarming on-chain data. 1k wallets, % Addresses in profit, Net realised profit/loss.
Disclaimer: Not financial or investment advice. You are responsible for any capital-related decisions you make, and only you are accountable for the results. “One Glance” by Cryptonary sometimes uses the RR trading tool to help you quickly understand our analysis. They are not signals, and they are not financial advice.
Today's data
Today, we had PCE and Core PCE data out, along with 'Personal Income' and 'Personal Spending' data out.'Personal Income' came in at 1% Month-on-Month, which is very high - wages up = inflationary. 'Personal Spending' was more subdued. However, PCE came in at 2.4% Year-on-Year, which was the consensus, but Core PCE came in at 0.4%, slightly more than forecast.
The above data is relatively hot and won't be taken too positively in the eyes of the Fed.
Inflation looks as if it has bottomed (well above the Fed's 2.0% mandated target), and we're now seeing inflationary pressures pick up. This pushes back against potential rate cuts anytime soon, with it now looking closer to the Fed maybe just cutting once (25 basis points) in 2024.
This is something risk assets will have to reprice against, but if corporate earnings remain positive, risk assets can continue to do well.
We will have to keep watch of this, hence why incoming data is so important, particularly if it shows inflationary pressures picking up again. ETF Inflows: This is absolutely the most bullish aspect of the market at the moment.
Currently, the network produces approximately 900 Bitcoins daily, but ETF net inflows are between 5,000 and 9,000 Bitcoins daily. This is a huge imbalance between demand and supply - demand heavily outweighs supply.
Alarming on-chain data
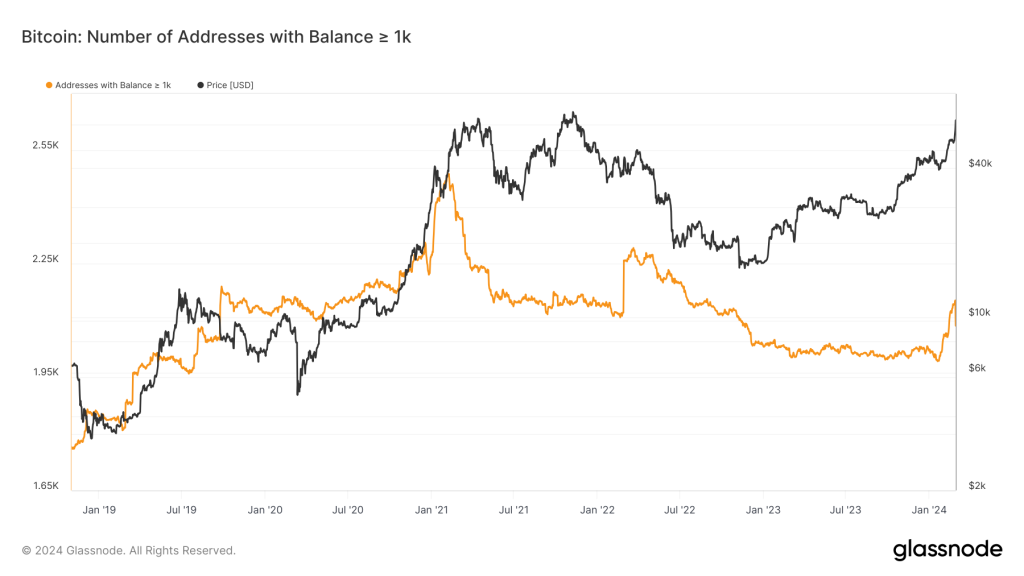
As BTC's price surged to $64k yesterday, several on-chain metrics showed real signs of exhaustion to the upside.A big risk-on signal has been when the wallet cohort holding more than 1k BTC per wallet increases rapidly. Yesterday it decreased significantly.
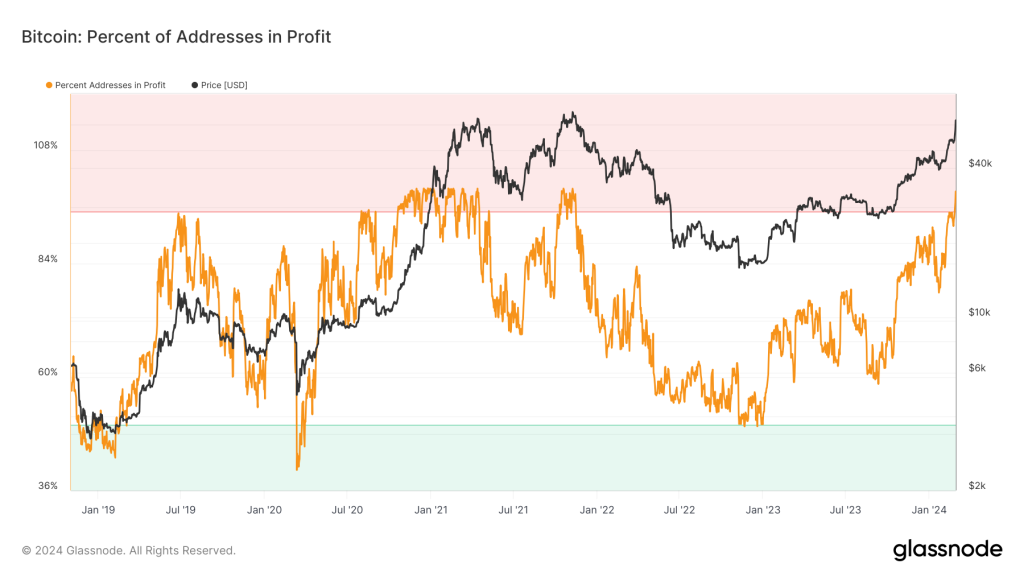
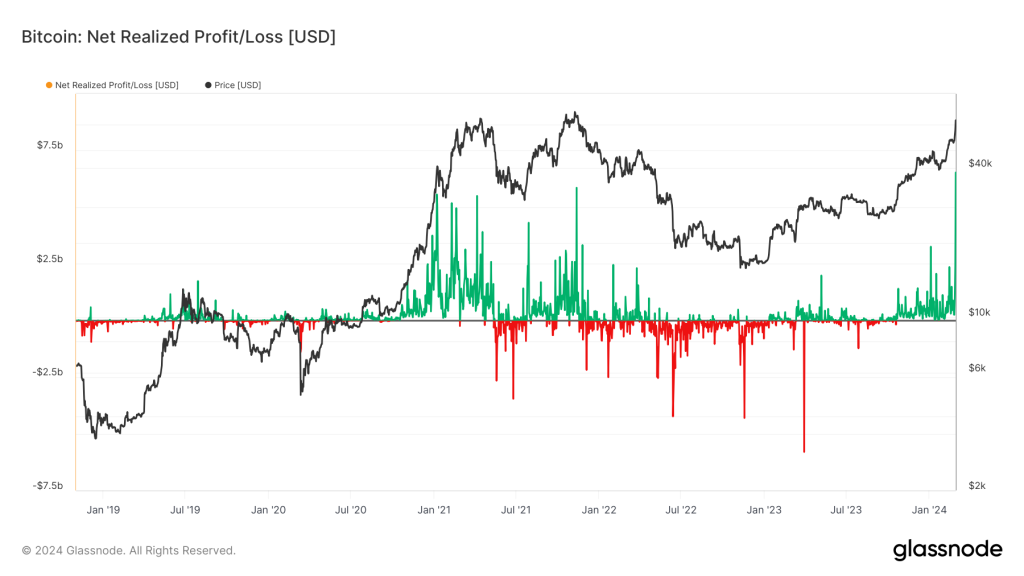
Alongside this, we saw the 'Percent of Addresses in Profit' increase to very high levels - levels that have previously been risk-off signals, while we also saw a massive amount of profit taking yesterday, which is shown in the 'Net Realised Profit/Loss' metric.
All of these signals are alarming and suggest that this may be a local top. BUT, this doesn't mean we're selling our bags, but it may mean we're due for a pullback.
Additionally, the amount of Open Interest (leverage) in Bitcoin positions has increased by 20% in the past few days. This is a lot and indicates there's too much leverage currently open - usually, this leads to a flush out, and in this case, it would be flushing out Longs rather than Shorts = price going down.
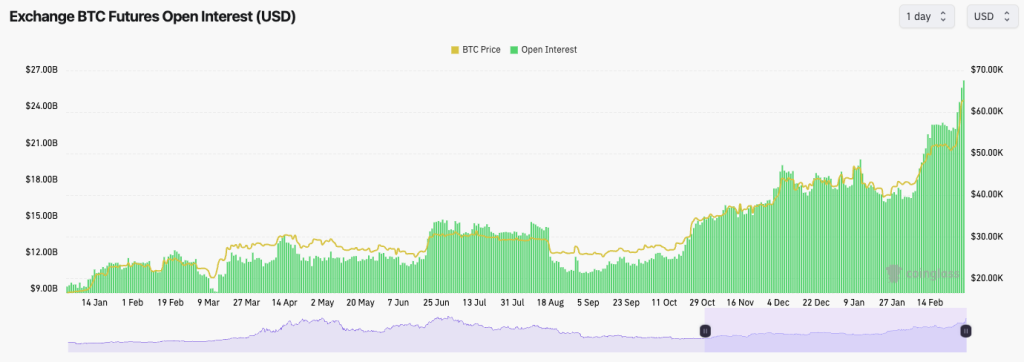
Also, Funding Rates are extremely positive, indicating that Longs are paying an expensive premium to Shorts for the privilege to be Long. Again, usually, this does not end well, and we see a flush-out.

Cryptonary's take
Price action has been phenomenal over the past month, and we must recognise that pullbacks may be possible. That said, we should also recognise that prices can just keep going higher, especially if the infinite (or at least seems to be) Institutional bid into the ETFs continues.So, how do we play this?
Because of where we are in the cycle, we still believe there is a huge amount of upside left, and there's a lot of time for this to play out.
But, with many trading indicators in extremely overbought territory, along with the on-chain charts we can see above - big wallets selling down and realising some profits - we should be open here to a potential more meaningful pullback.
This doesn't mean we're going to be selling Spot bags; we certainly won't be. But we won't be looking to add more exposure here. Many of you may have more USDT on the sides that you want to put to work/allocate. However, today, I (Tom, Head of Analysis) will not be putting it to work. My plan will be to add more risk on any major pullbacks considering how exposed I am currently.
With prices where they are, with on-chain data showing those signs above, it would be wiser to add more risk if prices pull back rather than to add it today at what may turn out to be major local highs.
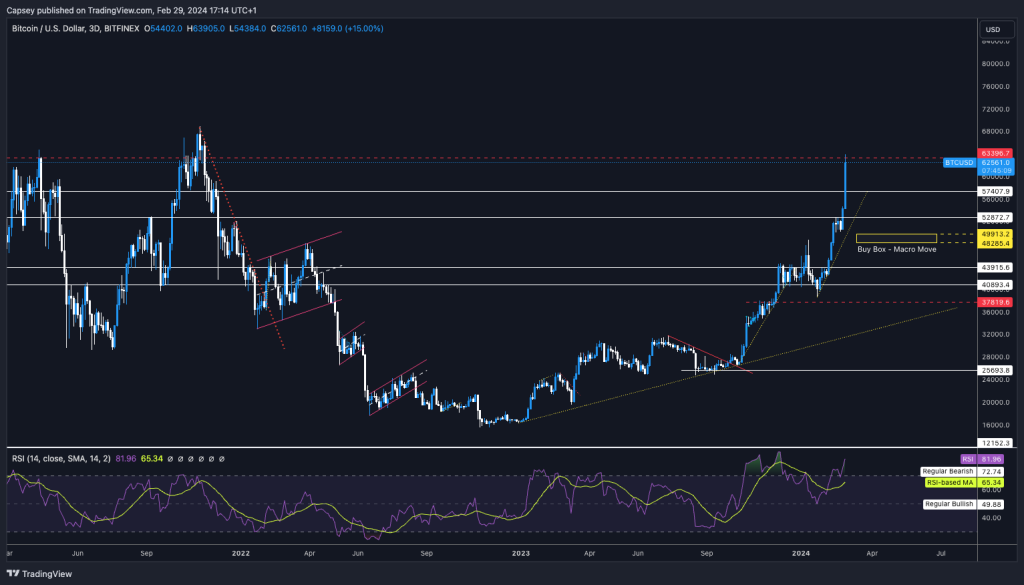
BTC
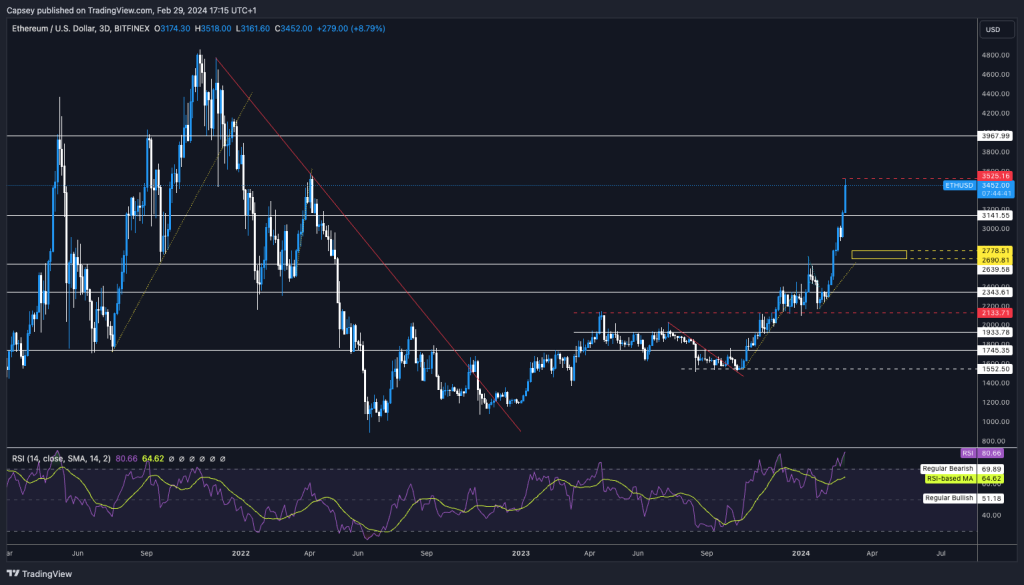
ETH
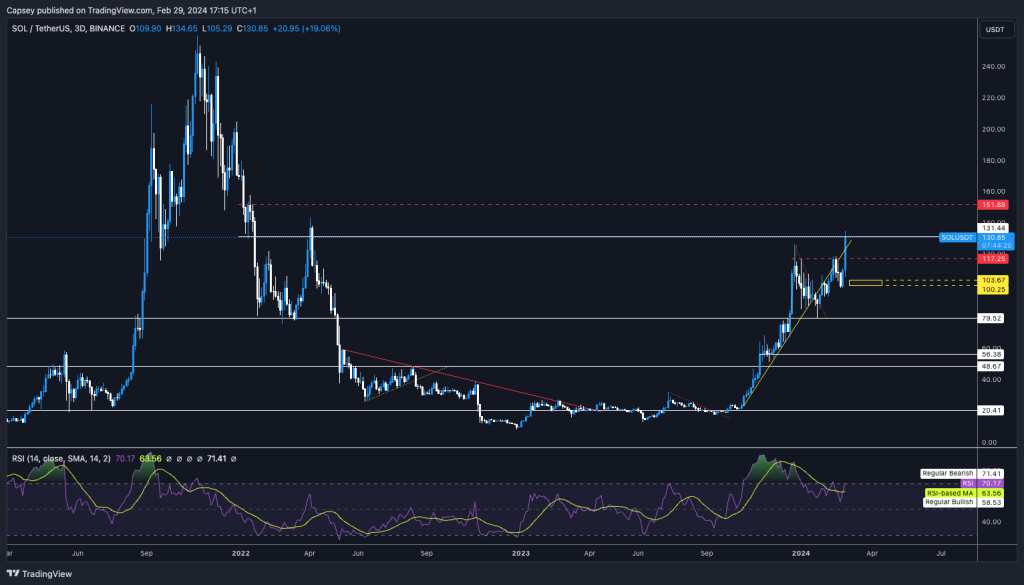
SOL
Recommended from Cryptonary

