Save 23% ($351) & Get a Free 1-1 Call with our Team ⏰ : 0d 2h 59m 44s

A reclaim of $2.7 could shift momentum for NOS, targeting higher levels. Will these assets push higher or retest support zones? Read on for today's analysis.
Disclaimer: This is not financial or investment advice. You are responsible for any capital-related decisions you make, and only you are accountable for the results.
TON:
Market context
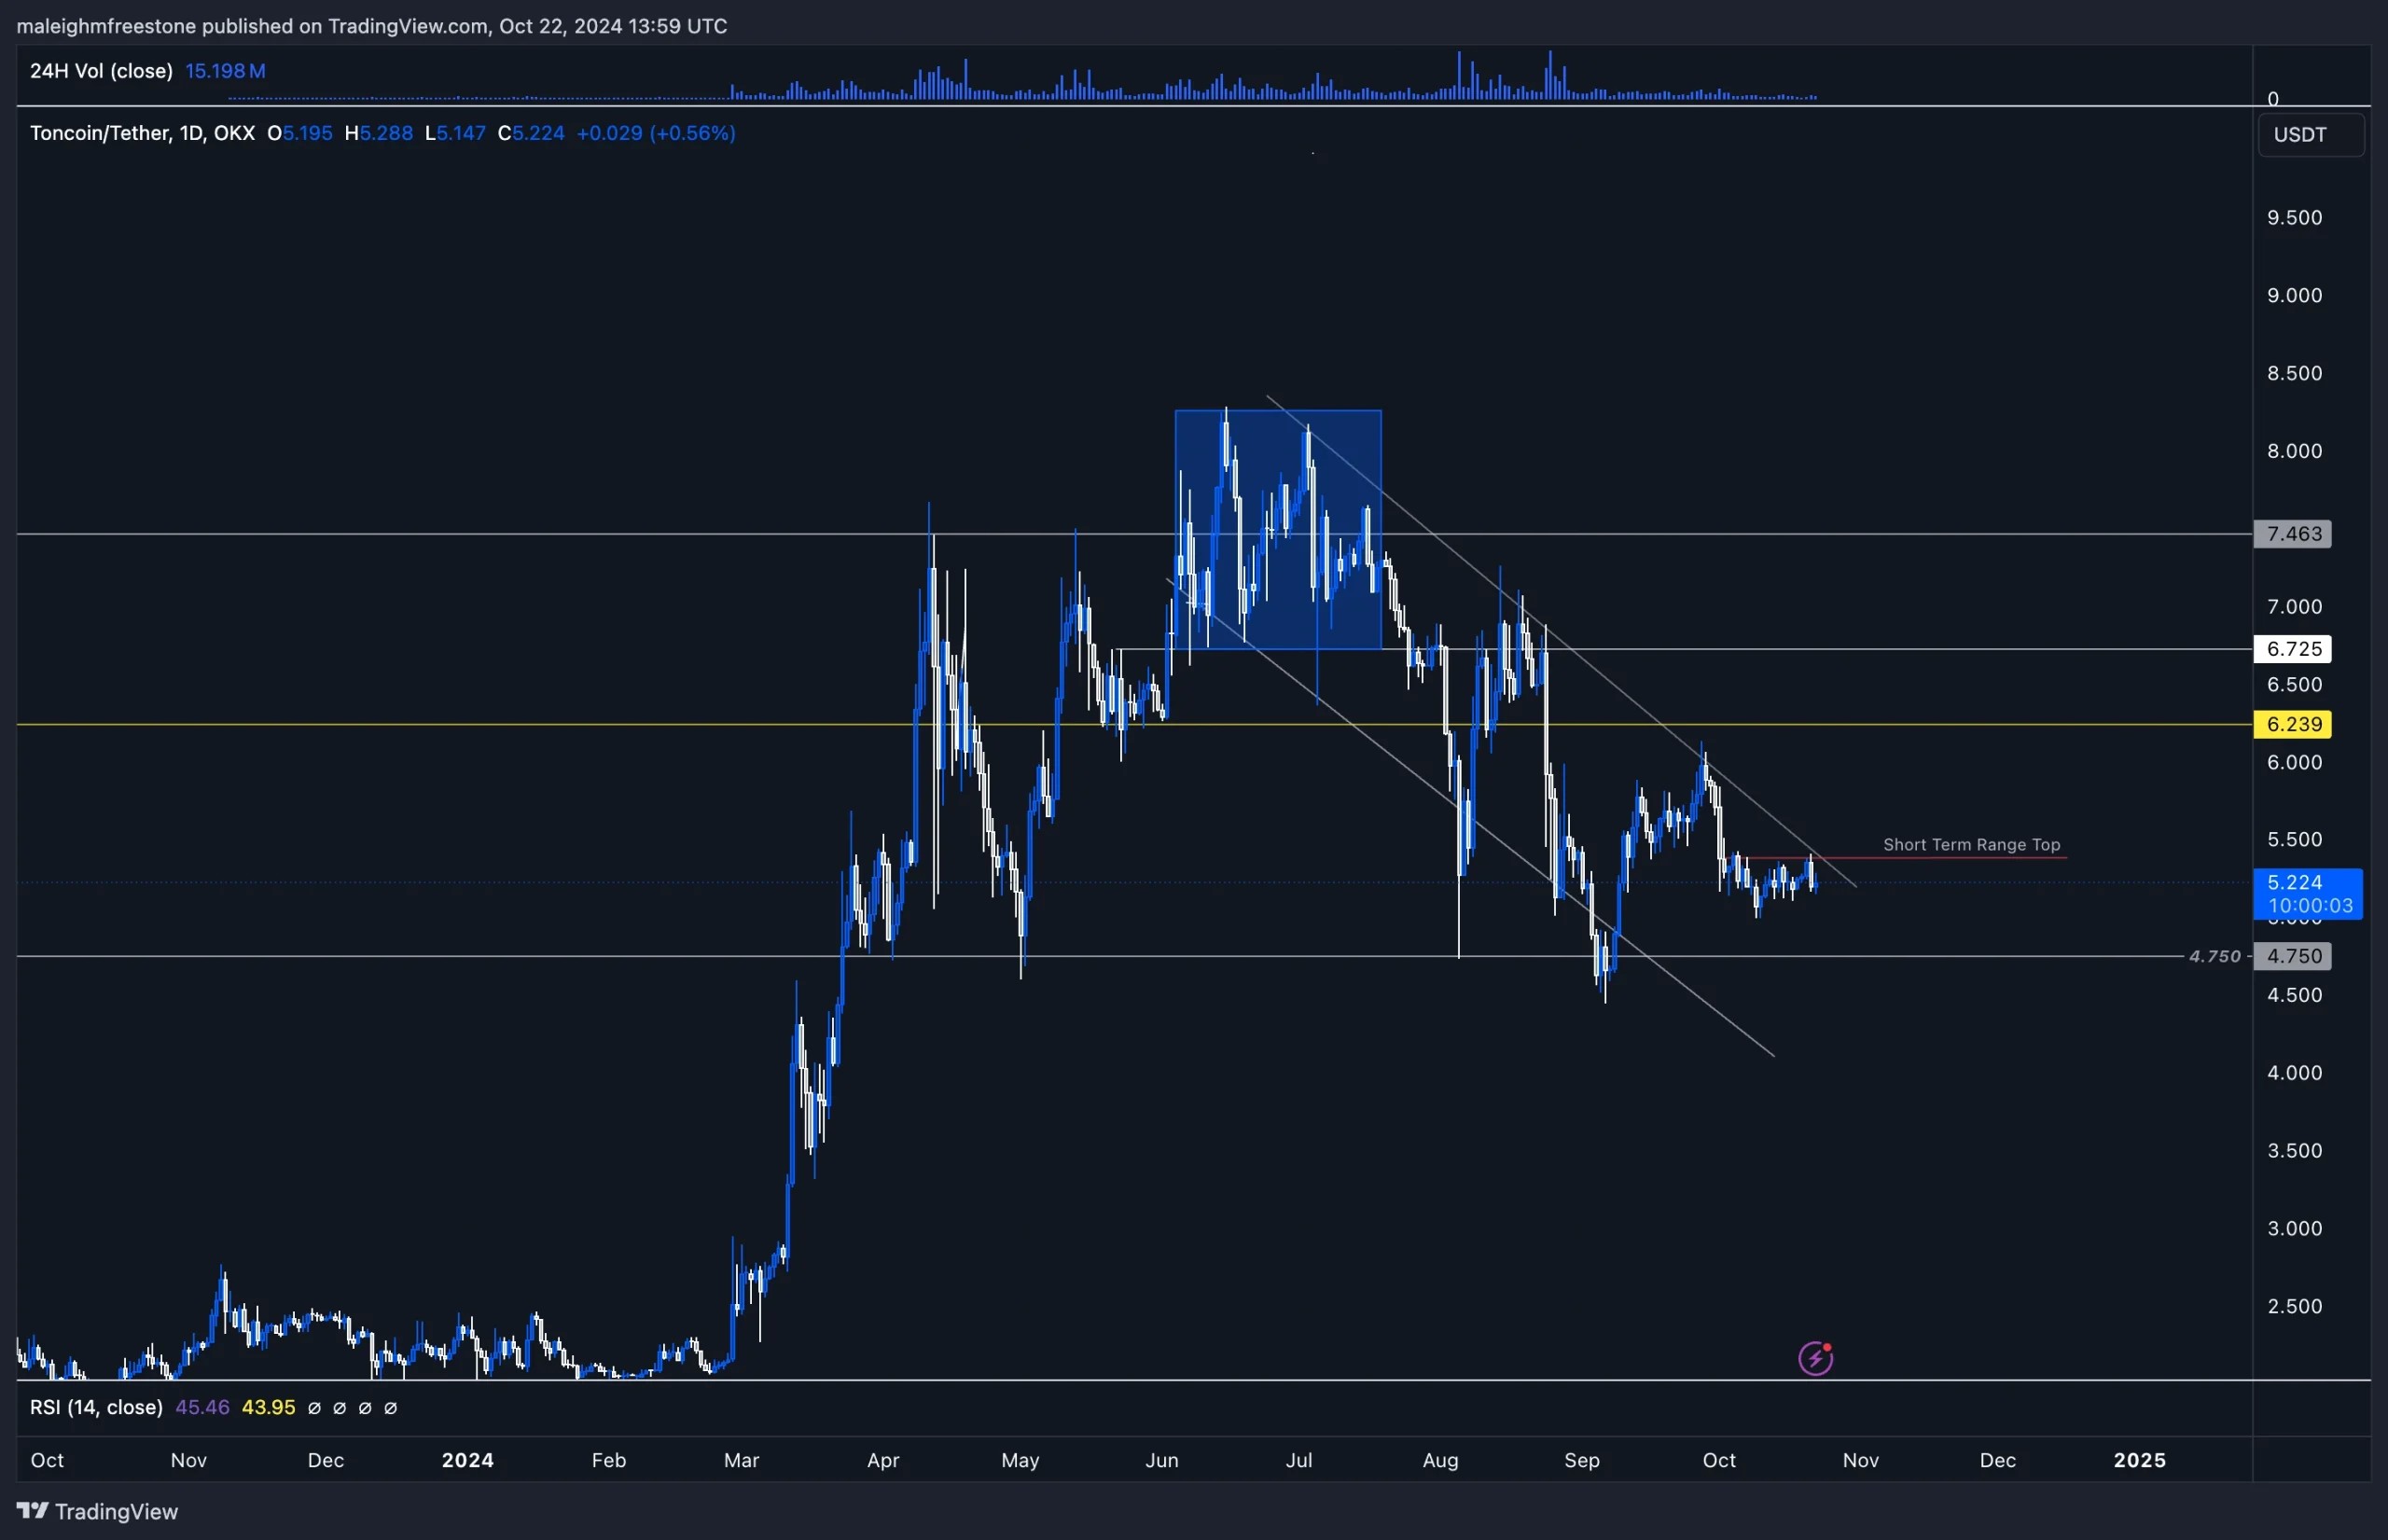
TON has been a relatively uncorrelated asset this cycle, consistently forming higher highs before selling off due to market-wide factors, such as those we saw around the start of August and from late June onwards.Despite this, TON held up above the $6.2 and $6.7 levels for a while. These levels were previously identified as range tops, and we saw that the price respected them well for a significant period. With TON's performance, especially with a 900% rise, it's natural that early holders took large profits, particularly around the $7.4 level.
It's common to see profit-taking after such aggressive moves, followed by some bleed-off as capital rotates into other assets. That's what we've seen happen as TON retraced; we have seen this in many strong-performing assets this cycle if a similar print on high time frames.
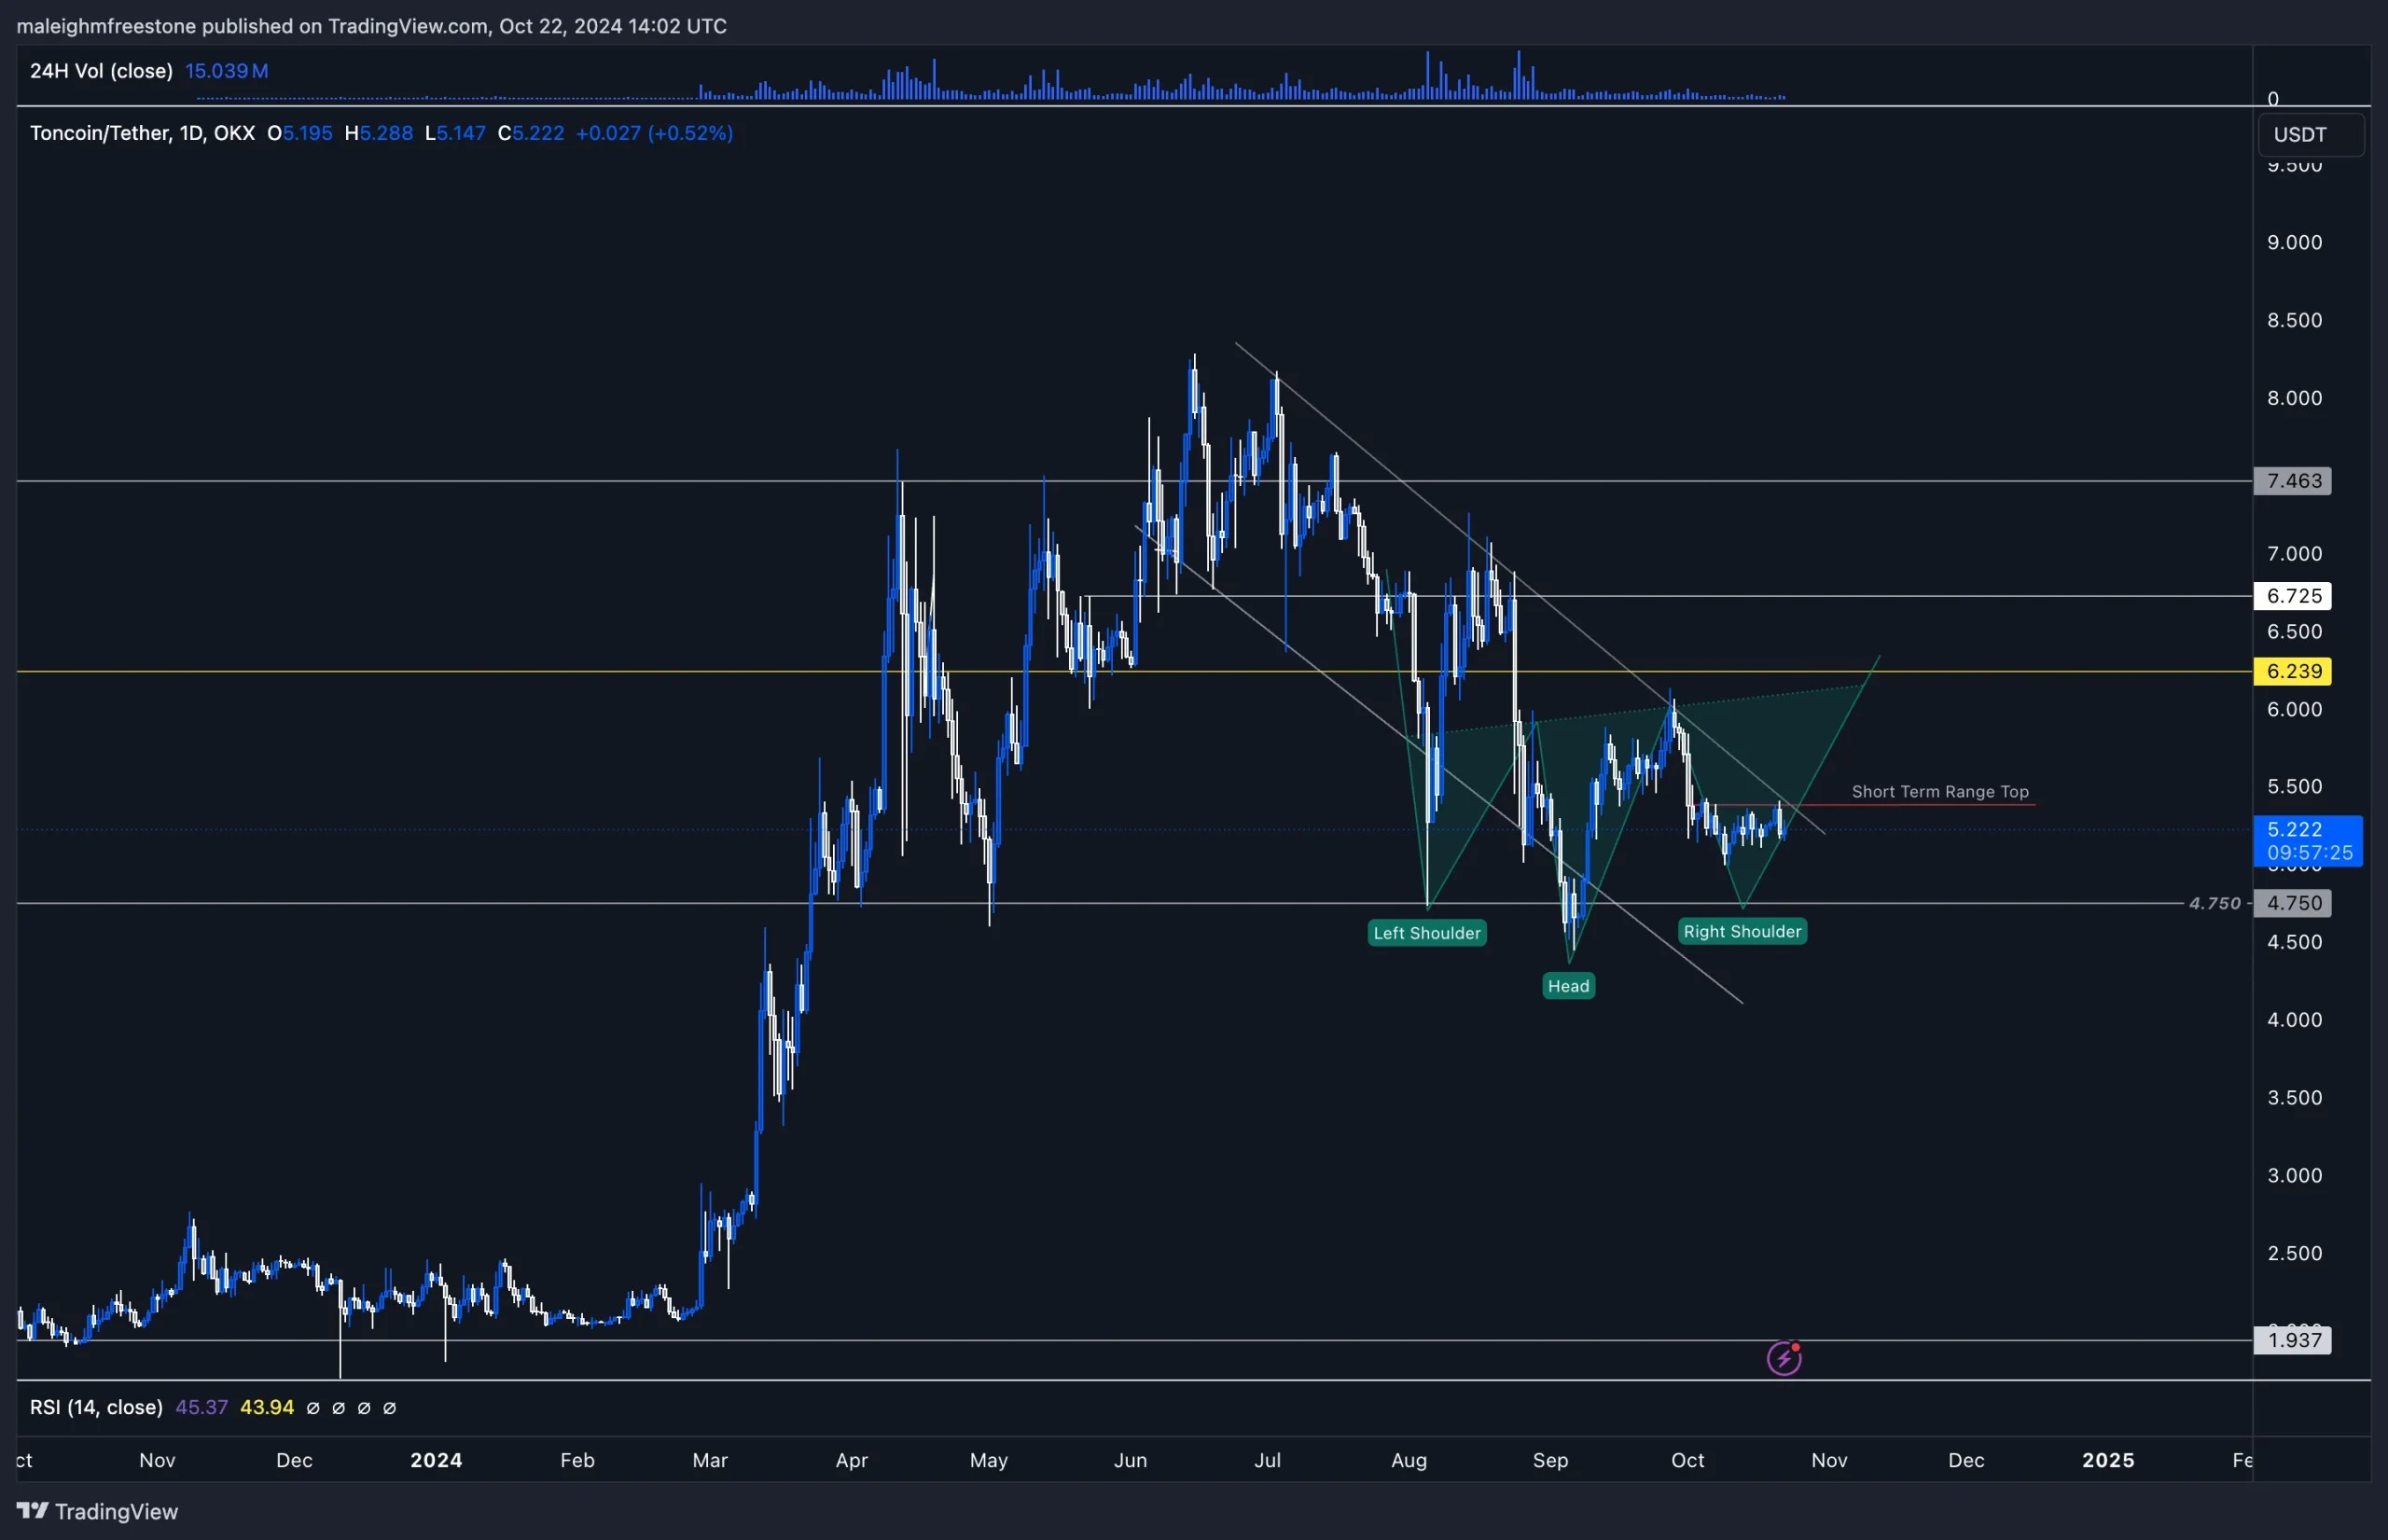
Currently, TON has pulled back into the $4.75 region, which was tested in March, May, and again in August. We saw a deviation from this level in September, and there's a possibility of an inverted head and shoulders forming around this $4.75 zone.
Playbook
We're now seeing a short-term range top around $5.4. Unless we get a break and close above this level, we could see TON come down again to retest the $4.75 level, which may complete the formation of an inverted head and shoulders pattern.Key levels
- $5.4 (short-term range top)
- $4.75 (key support level and potential formation of inverted head and shoulders)
- $5.5 (build a spot position between $5.5 and $4.75)
Cryptonary's take
TON presents a lot of opportunities. While it's not in our CPRO picks or an asset we hold, we've conducted a thorough report showing its upside potential. Building a position between the short-term range top of $5.5 and the support level at $4.75 for a spot hold would likely be the best current strategy.PENDLE:
Overview
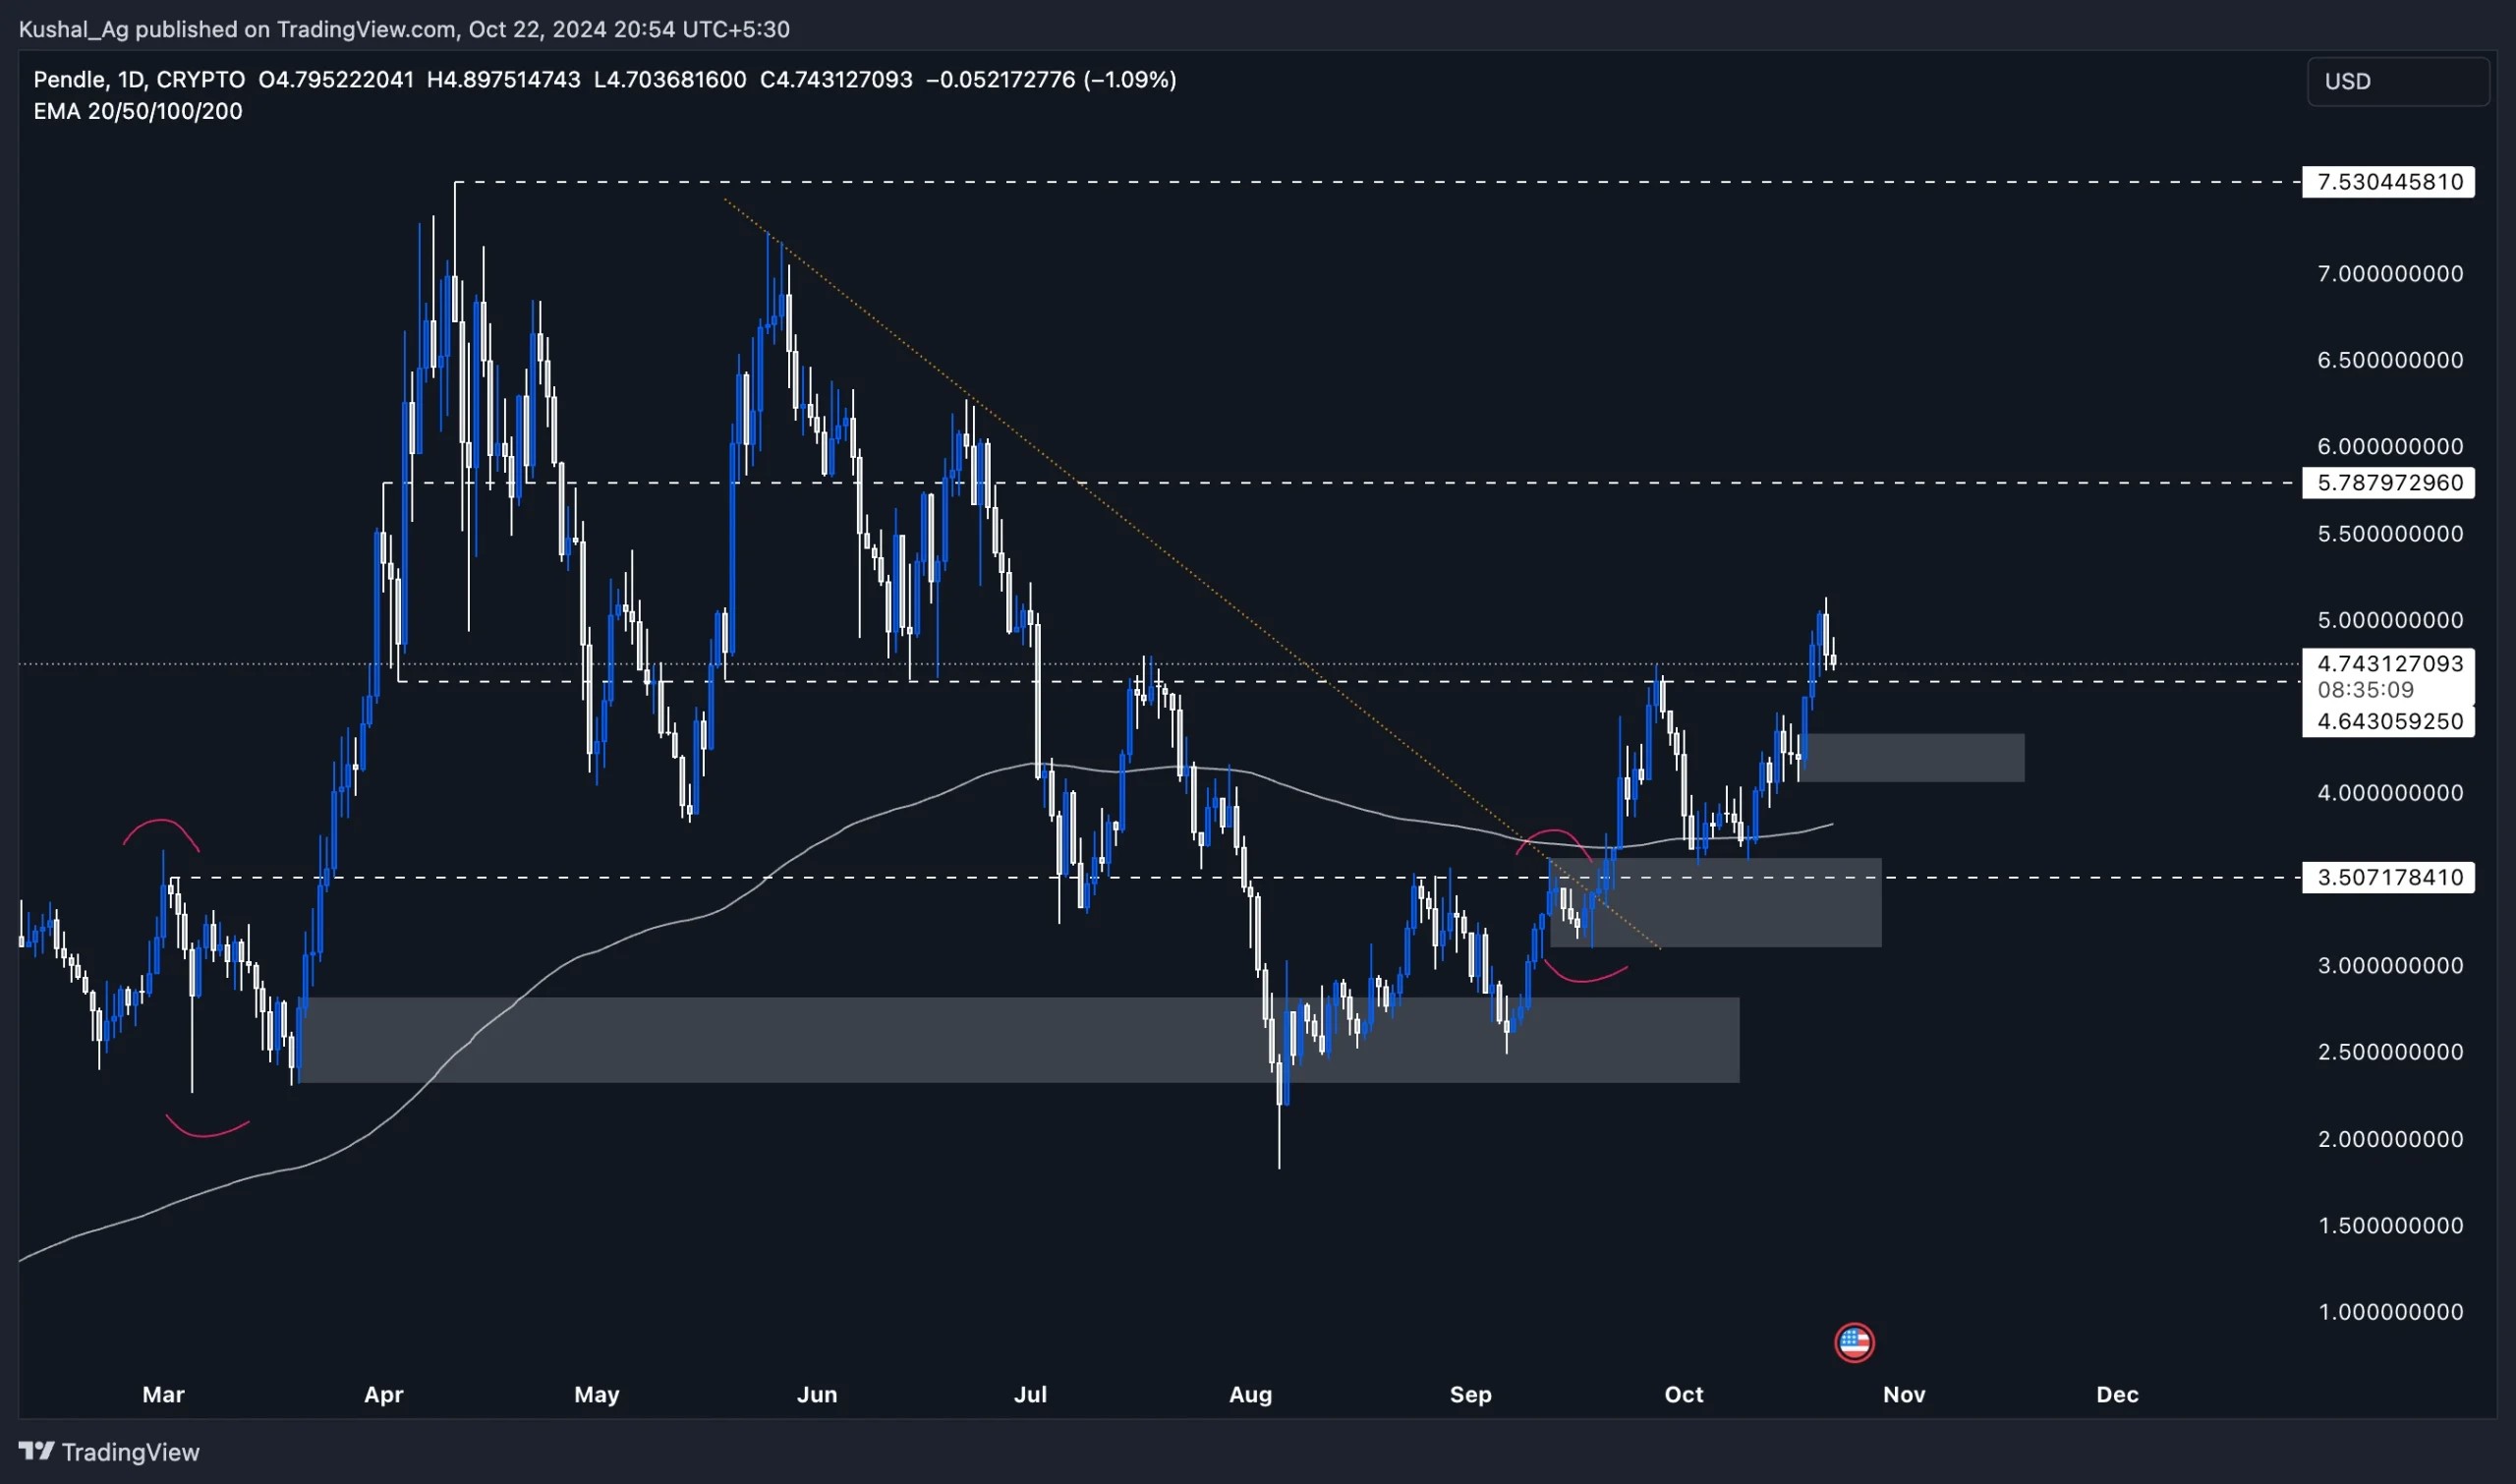
Pendle ($PENDLE) continues to establish itself as a strong performer in the market, exhibiting bullish price action despite previous rejections from key resistance levels. Since our last analysis, Pendle was trading at around $4, and we observed that the accumulation zone ranged between $3.1 and $3.6.Over time, Pendle has successfully bounced from this accumulation zone twice, particularly from the $3.6 level, showing strong support at this range, which was also confluenced by the 200 EMA. As of now, Pendle has broken past the critical resistance level at $4.64, and after facing some rejection at the $5 psychological resistance, it is consolidating above the previous resistance zone.
The market setup for Pendle is strong, and there is a clean space for price movement up to the $5.78 level, which is the next major resistance. The asset has shown signs of breaking structure on the daily timeframe and remains in a bullish stance, making it a potential candidate for continued upward movement.
Current market outlook
On the daily timeframe, Pendle's price has been trading with bullish momentum. The asset respected the previously identified accumulation zone between $3.1 and $3.6, using it as a base to propel itself higher. The support from the 200 EMA, previously at $3.8, also aided in Pendle's bounce from this zone.Pendle's price has since broken the $4.64 resistance level and is now consolidating just below the $5 psychological resistance.
As Pendle consolidates, the technicals suggest that there's potential for further upside, especially with the lack of significant resistance up to the $5.78 level. The current structure also supports this bullish outlook, as Pendle has printed higher lows and higher highs on the daily timeframe.
Key levels:
Support zones:- Accumulation Zone: $4.00 - $4.30
- 200 EMA on Daily: Around $3.82, acting as a strong support on the downside
- Immediate Resistance: $5.00 (psychological)
- Major Resistance: $5.78
- All-Time High (ATH): $7.53
Potential scenarios:
Bullish scenario (short to medium term):- If Pendle continues to sustain above the $4.64 level, it is likely to target the $5.78 resistance zone. Given the current structure and price action, this could materialize in the coming weeks.
- A break and hold above $5.78 could open the door for Pendle to retest its ATH at $7.53.
- A failure to hold the $4.64 support zone could see Pendle retrace back to the new accumulation zone, which lies between $4.00 and $4.30. This would offer traders another swing entry opportunity.
- A further breakdown could see Pendle test the 200 EMA at $3.82, which has historically provided strong support.
Cryptonary's take
Pendle has been showing strength on the charts, holding above key levels and breaking out of important resistance zones. Its recent breakout of the $4.64 level is a good sign of potential continuation, but we remain cautiously optimistic.Should Pendle maintain its position above $4.64, there's a clear path for it to rally to $5.78 in the short term, with $7.53 as a medium-term target. However, a break below $4.64 could provide opportunities for traders to accumulate in the $4.00 to $4.30 range.
Additionally, the 200 EMA at $3.82 acts as another strong support zone should Pendle experience a larger pullback. As always, it's crucial to manage risk, especially with assets that have experienced strong rallies. Pendle looks solid for now, but traders should watch for confirmation above the key resistance levels to capitalize on the potential upside.
NOS:
Market context
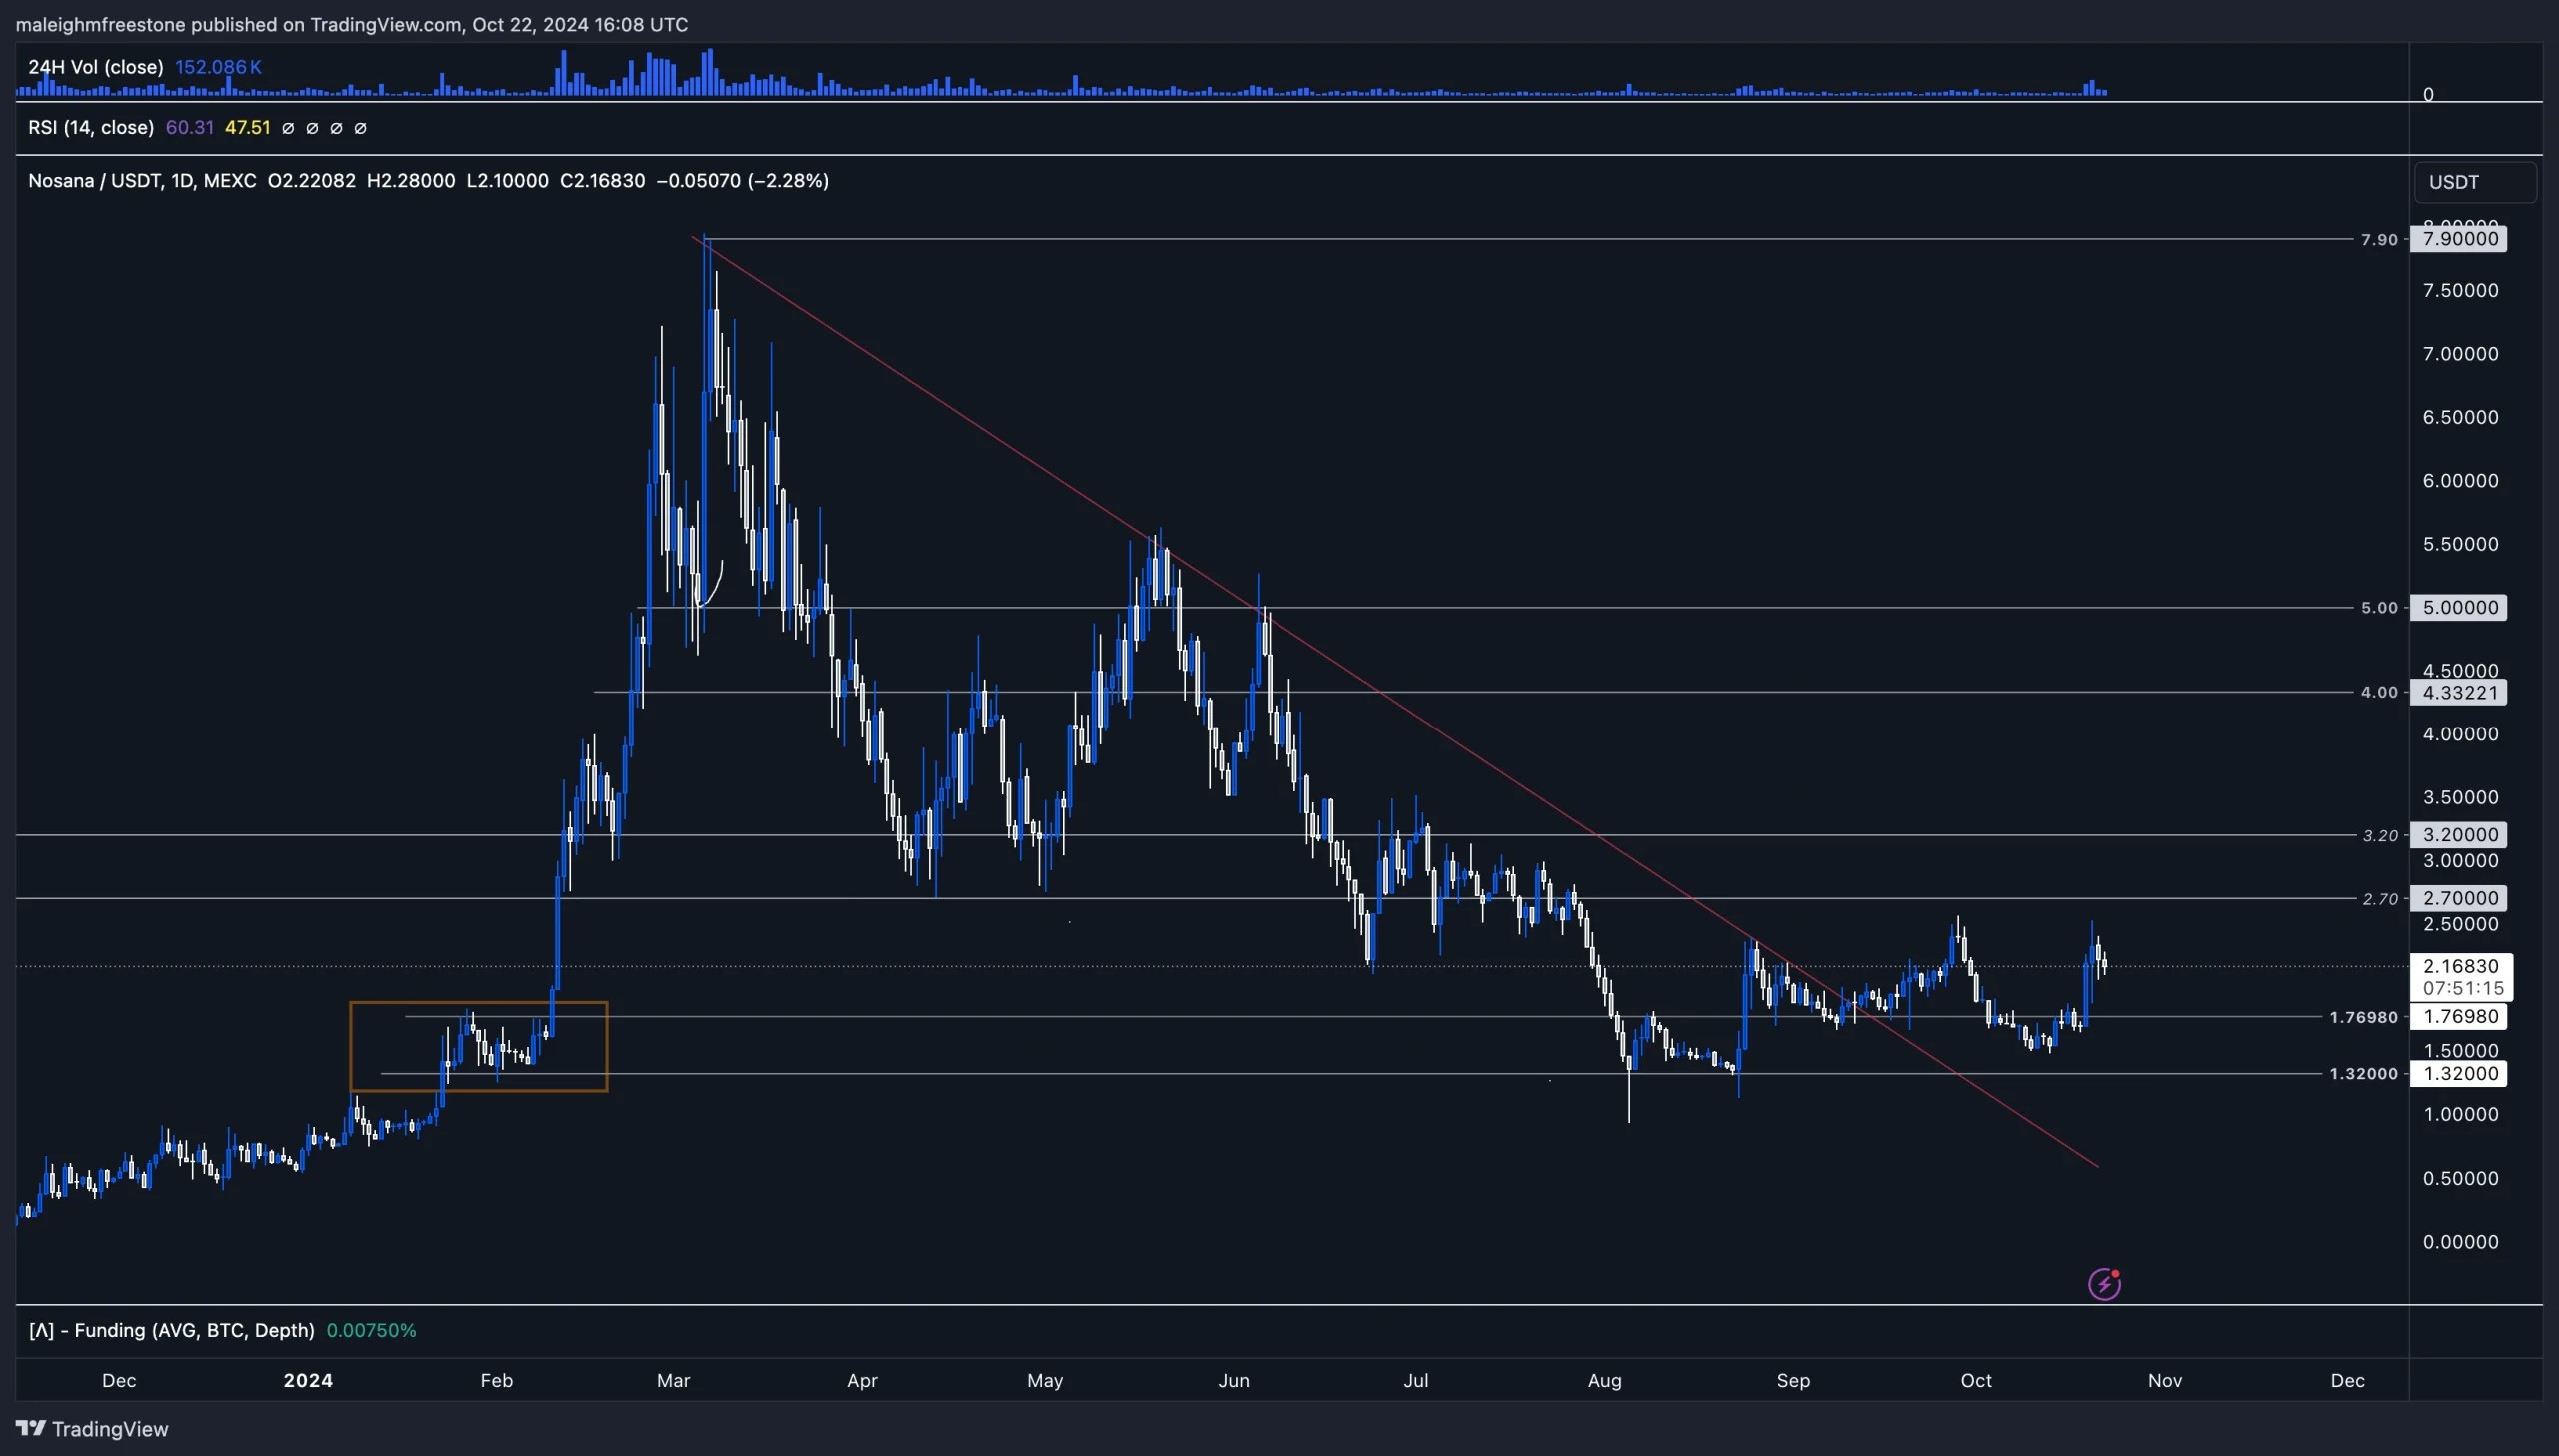
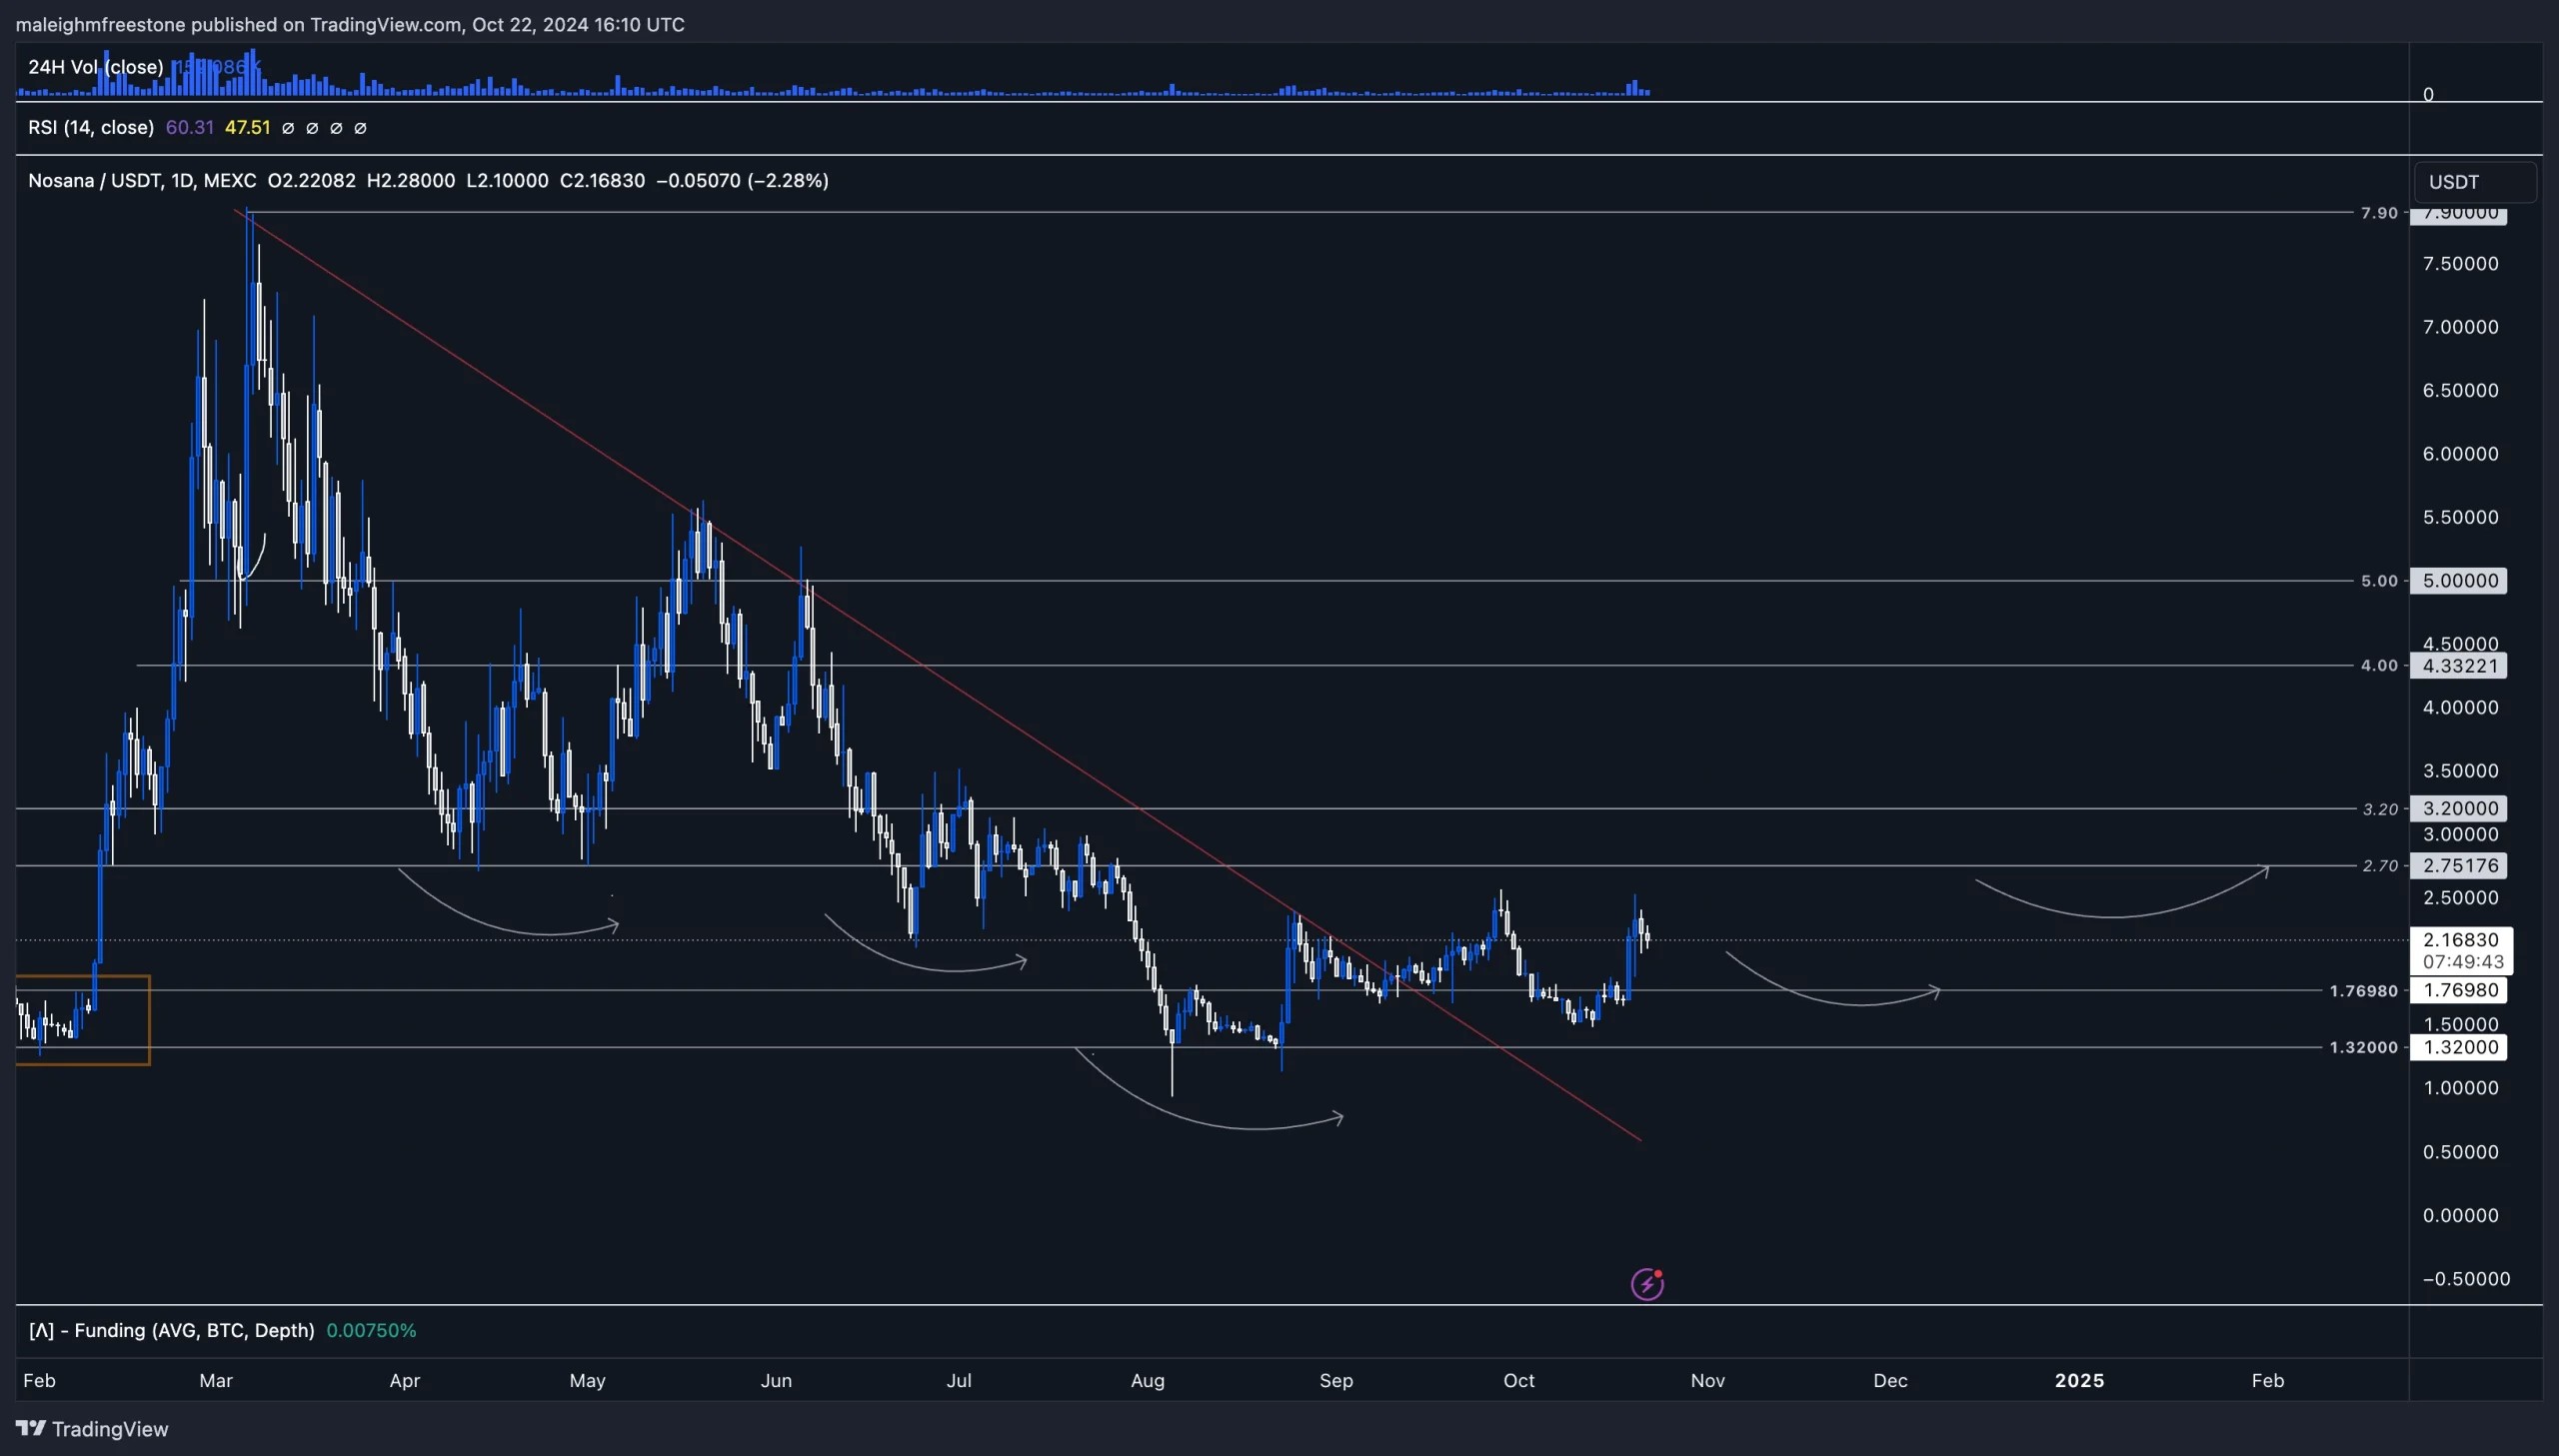
Nosana has been one of the strong performers this cycle, generating significant returns for investors. Naturally, after such gains, we've seen some profit-taking and bearish price action, especially with the overall market lacking bullish momentum. The key level to watch is $2.7, which provided a nice opportunity back in April and held strong.We saw a 100% move off this level before respecting the bearish trend line and selling off even lower, hitting the $1 mark. Another key level is $1.32, formed around late January/early February during a small consolidation before that massive 500% range expansion to $7.9.
It's interesting to note the hammer candlestick that formed on August 5th- a strong sign of demand at this level. This led to an 80% bounce, and we've since seen bullish buying pressure around the $1.5 to $1.76 price zone.
Playbook
To see real bullish momentum, we would need to see a reclaim of the $3.2 to $2.7 price levels. If this happens, we can start targeting the highs around $7.9. While not invested in Nosana, it is a strong performer in our CPRO picks. On the higher timeframes, there's potential for a large inverted head and shoulders pattern forming, which could signal a major shift in sentiment if the $2.7 level is broken and retested.Key levels
- $2.7 to $3.2 (key resistance zone to reclaim for bullish momentum)
- $1.32 (key support from the consolidation phase before the large move)
- $7.9 (Mid to Longer term) target on a successful break and retest of $2.7)
Cryptonary's take
Nosana has been in lower highs and lower lows structure, but with the rounding bottom on Total3 market cap and stronger alts showing strength, Nosana may be in a shifting position. Keep an eye on the key levels and watch for signs of sentiment shift as we potentially transition out of this lower high formation.Recommended from Cryptonary


