Save 23% ($351) & Get a Free 1-1 Call with our Team ⏰ : 0d 2h 59m 43s
Unique cycle: Two new theories on where we are headed next
In this market update, we assess recent action from Hodlers and what the metrics are currently showing us. The goal is to ascertain whether that can give us clues about how this cycle may play out or differ from prior cycles.

We also give a current approach to how we're playing things in terms of how exposed we are—we're very exposed to crypto currently—but we're also more cautious and measured when it comes to putting fresh USDT to work.
TLDR
- Regarding the macro data this week, we expect it to come in around consensus, and the markets will brush it off.
- On-chain data indicates long-term holders are booking profits.
- We are in a unique cycle; different theories exist on how this potentially plays out.
Disclaimer: This is not financial or investment advice. You are responsible for any capital-related decisions you make, and only you are accountable for the results. "One Glance" by Cryptonary sometimes uses the RR trading tool to help you quickly understand our analysis. These are not signals, and they are not financial advice.
This week's macro data
This week's major data comes on Friday, with some lighter data coming on Thursday. Thursday's data is GDP Growth, which is expected to come in at 3.2%. There is also the Jobless Claims, which is expected to come in at the usual low 200Ks. Friday's data is Core PCE, Personal Income, and Personal Spending.Personal Spending is due to come in slightly higher than last month's reading, which the markets will see as a positive sign of strong consumer spending. Personal Income is expected to come in at 0.3%, far less than the 1.0% reading last month, although this was a shock at the time. A return to 0.3% would be more normal for this metric.
Finally, Core PCE is expected to come in at 0.3%, slightly less than last month's 0.4%. If the data comes in as expected, markets will be fine and continue to do relatively well. We don't think markets will react too much if the data weakens.
The reaction will likely be if the data comes in considerably stronger again, as the market will take this as well; well, if the data is much stronger, how can the Fed make three rate cuts on strong data? The risk of cutting rates would then be that it would risk inflation rearing back up.
However, we expect the data to come in around consensus and the markets to brush it off and continue as they have been.
Long-term holders have booked some profits
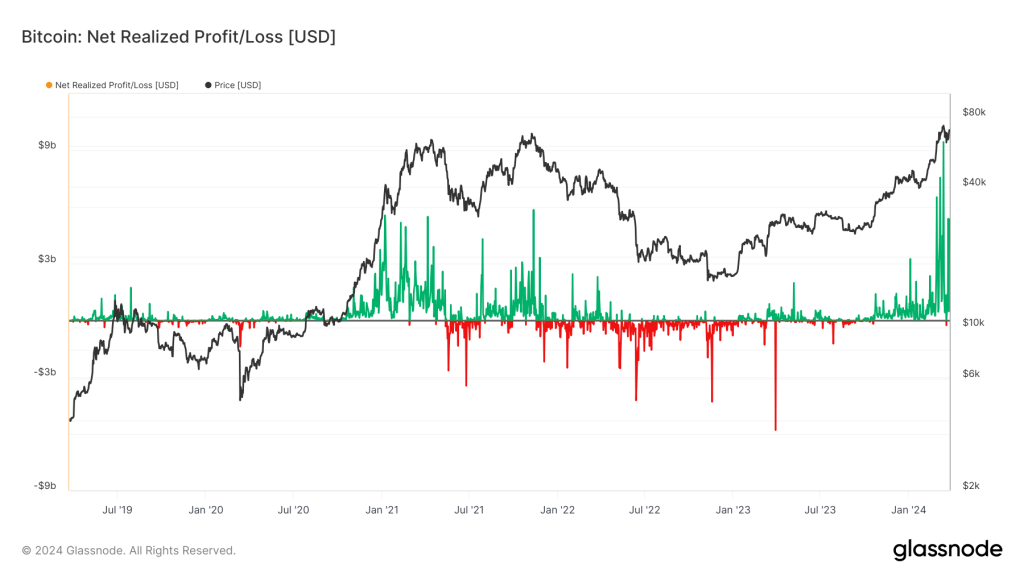
Two metrics show us if profits have been booked.The first of these is the Net Realised Profit/Loss chart. As we can see from this below, on the recent move up to just north of $70k, a large amount of profit was booked, i.e., investors selling Bitcoin for USD/USDT. This is represented by the large green spikes on the chart on the far right.
Net Realised Profit/Loss
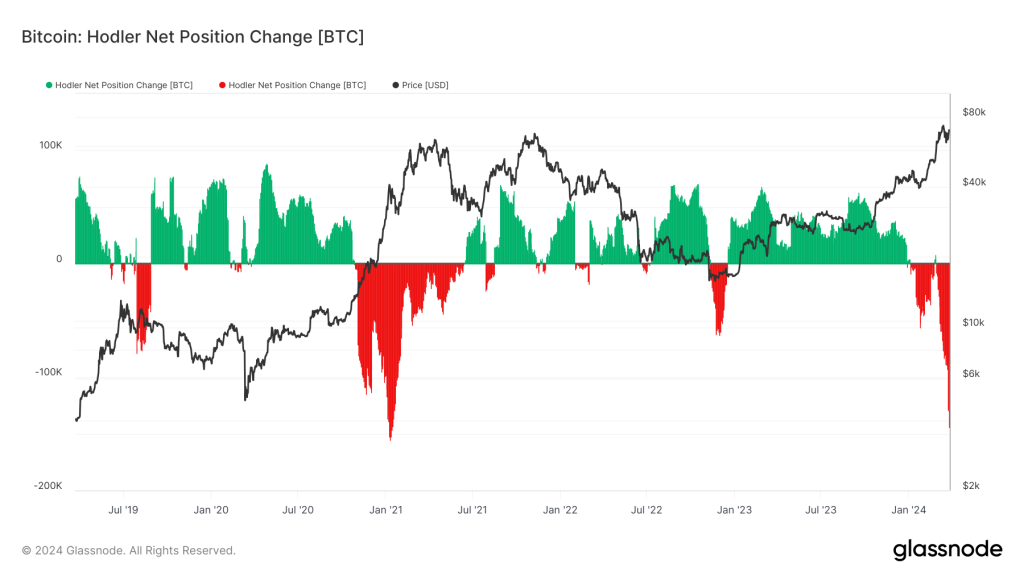
The second chart is the Hodler Net Position Change. This is tracking all long-term holders (coins aged older than 155 days). From this, we see a large decrease in Net Position Change, i.e., these Hodlers hold fewer coins as they've sold some, booking profits.
We can see this from the large red downward spike on the far right-hand side of the chart. If we compare this to last cycle's early 2021, we can see that there also was a large drawdown in the Hodler Net Position Change metric.
Hodler Net Position Change
Unique cycle: Two theories on how it may play out
This cycle has already been unique in two major ways: a new all-time high for Bitcoin's price pre-Bitcoin halving and the introduction of the ETF, which is providing a large USD bid that wasn't likely there in prior cycles.In prior cycles, the thinking has been that Bitcoin hits new price highs a year or so after the halving. However, with the introduction of the ETFs, this theory, which was relatively well known amongst participants, i.e., BTC hitting all-time highs 12-18 months post halving, has been front-run. Given how unique this cycle has been, it opens the door for new possibilities.
Possible scenarios:
- We see another double top. It may be that Bitcoin hits $120k-$180k in the coming months and calms down for three or so months before another move up to test the highs. This would be similar to the 2021 cycle top. See this as unlikely.
- A continued grind higher, similar to the 2017 cycle top. See this as unlikely but more likely than scenario 1.
Smarter money will likely look at this and pair the two.
So, the halving is a bullish catalyst coming up in just three weeks, which should be a big net positive for prices going higher in the coming 12 months. However, the supply squeeze effect usually takes several months for the market to feel that effect.
Alongside this, we have on-chain data metrics showing very overbought levels, with what you'd say is still early in the cycle. Therefore, when you put both of these together, it looks like the most likely setup is for there to be a period of consolidation, or even stagnation over the next few months, and then for Bitcoin to kick on again after that and really move into that $100k-$200k zone in Q3 or Q4 2024.
Cryptonary's take
Therefore, we suggest maintaining your current positions. Still, we wouldn't aggressively add more risk with the USDT you have on the sidelines (especially when we look at the on-chain metrics currently)—assuming you have USDT on the sidelines.We would suggest waiting for a period of consolidation/even stagnation of a few months and putting spare USDT to work towards the end of that period (assuming we get it). But we also suggest not selling current Spot positions and letting them ride.
Ultimately, this cycle is more unique, and all data points that have worked well in prior cycles (on-chain) are likely to be slightly less useful this cycle simply because there are new dynamics to consider (ETF, price highs pre-halving, etc).
We're still risk-on but not looking to put loads of spare USDT to work now. We're encouraging a more measured approach for the time being.
Cryptonary, Out!
Recommended from Cryptonary


