Save 23% ($351) & Get a Free 1-1 Call with our Team ⏰ : 0d 2h 59m 43s
Volatility ahead: Go bust in April, back to boom in May
This week's upcoming inflation data release will be a key indicator—if the numbers come in hotter than expected, it could spell trouble for risk assets like crypto. However, if the data is more favourable, it could pave the way for the Federal Reserve to start cutting rates, which would be a massive boon for the crypto markets.

While there are some short-term hurdles to clear, the general outlook remains bullish, and the summer months will bring gains.
TLDR
- The upcoming CPI data release could be a make-or-break moment for crypto in the short term.
- April typically sees selling pressure as tax season hits, but liquidity is expected to improve from May onward.
- The Fed is also expected to adjust the quantitative tightening program in May, which would be a net positive for crypto liquidity.
- Bitcoin could see some near-term consolidation, but the overall structure remains bullish, with potential for a breakout later in Q2.
- Based on technical analysis, "Alt season" is poised to kick off as soon as June, with large-cap altcoins positioned for an extended rally.
Disclaimer: This is not financial or investment advice. You are responsible for any capital-related decisions you make, and only you are accountable for the results. "One Glance" by Cryptonary sometimes uses the RR trading tool to help you quickly understand our analysis. These are not signals, and they are not financial advice.
This week's inflation data and its potential impact
We will have new inflation data released tomorrow (Wednesday, April 10th).The Fed monitors this key data point as its battle over the last 18 months has been to lower inflation.
The consensus is for Core Inflation MoM to come in at 0.3%, which is better than last month's 0.4%, although the Fed would prefer a 0.2% print. The YoY figure is expected to come in at 3.7%, slightly below last month's 3.8% reading.
Essentially, if the data comes in hotter (higher than the consensus), then markets and risk assets, including crypto in particular, will come down. If the data comes in less than the consensus, then markets will likely move higher, as this will enhance the Fed's narrative of needing to cut rates this year.
We still believe that the Fed will cut rates this year, even if it's just once or twice, rather than a full-on rate-cutting cycle, as they have a bias to do. We explain this in greater detail in the Monthly Report, which will likely be released in just a few more days.
Potential selling pressure in April, back to boom in May?
April is usually a less good month for risk assets as it aligns with the US tax year, where you see the sale of assets so participants can pay their taxes. This will likely have a negative impact on liquidity as the Treasury General Account will approximately increase from $800b to $1tn.It is Treasury Secretary Janet Yellen's job (somewhat) to get Biden re-elected in November, so she will likely draw down the TGA to increase liquidity again from May onwards. This will support risk assets and benefit Biden, who will be going into a presidential election in November.
Alongside this, the Fed and Powell are expected to announce a tapering of QT in the early May meeting. Expectations are for the $95b a month Balance Sheet run-off that we're currently seeing to be reduced to $60b to $70b monthly. This is a net positive for liquidity, but not in the very short term, but from May onwards.
As we know, Bitcoin is highly correlated to liquidity. Hence, a substantial increase in liquidity from May onwards, paired with the BTC halving in mid- to late-April, is likely to set Bitcoin up to perform well from May onwards.
BTC
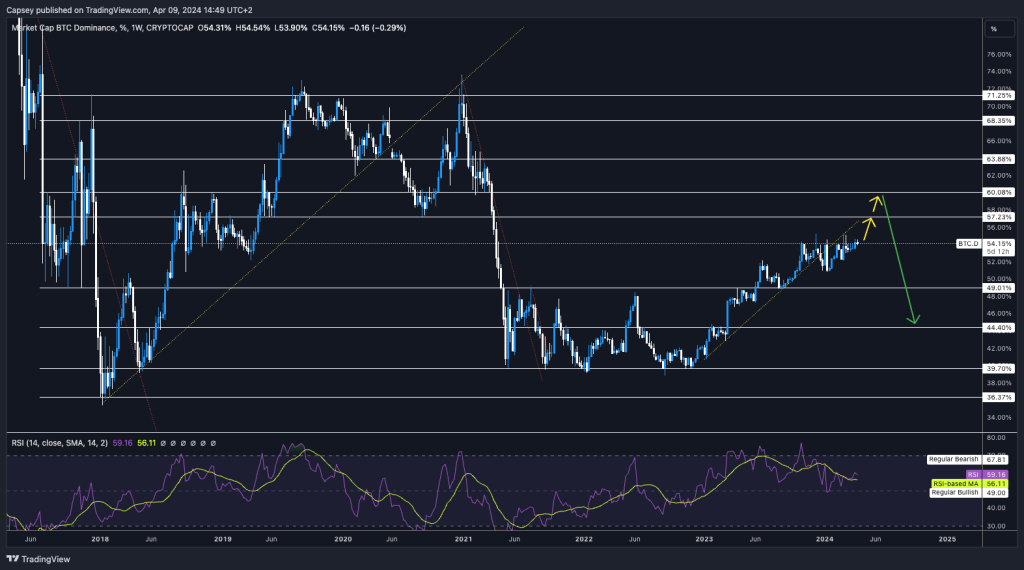
Let's look at Bitcoin from a zoomed-out point of view, considering the light context we have just laid out for ourselves above. If we expect April to be a slightly less positive month for crypto, you'd expect Bitcoin dominance to rise. It may be the case that Bitcoin doesn't pull back loads, but you see ALTS pull back a bit. I would expect Bitcoin Dominance to do something like the following: arrows.BTC.Dom
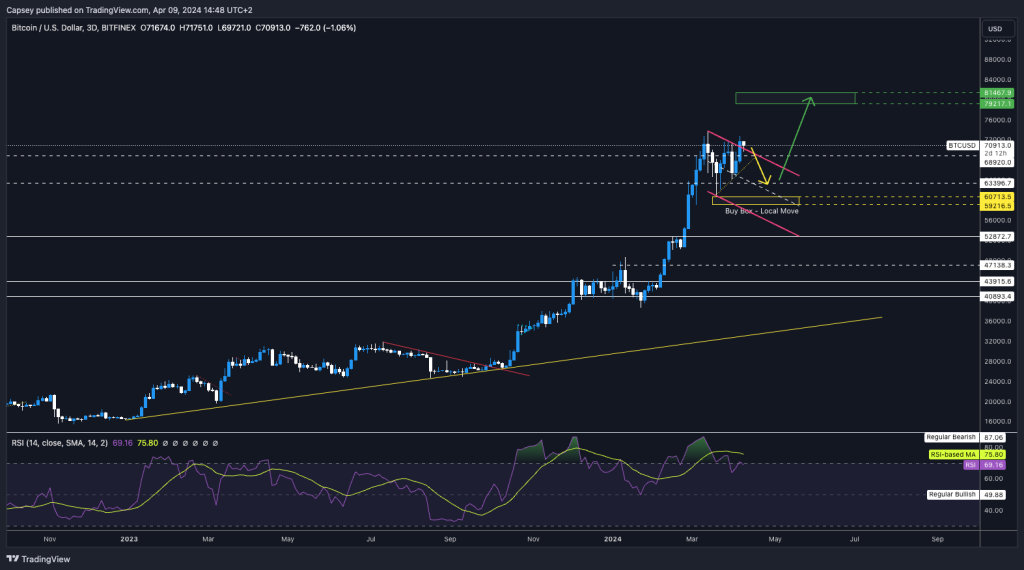
If we then look at the BTC price chart, despite price breaking out of the pennant/bull flag pattern, I (Tom) still feel this may actually be a deviation above the pennant/bull flag before a move back below and for price to even potentially retest the low $60ks in the coming weeks.
Now, this is just the feeling I get rather than loads of indicators telling me so. So, remember, I can absolutely be wrong on this, particularly if ETF inflows remain really positive. We may just continue the grind higher. Again, I have given arrows on what I think the general direction may be for BTC.
BTC price
But to clarify, just because I think Bitcoin can be range-bound in the short term doesn't mean I am bearish at all, particularly in the mid-term.
If we now look at the Large Caps Index with and without SOL, both look like they're in a period of consolidation, but the overall chart structure looks very bullish.
Large Caps Index with SOL
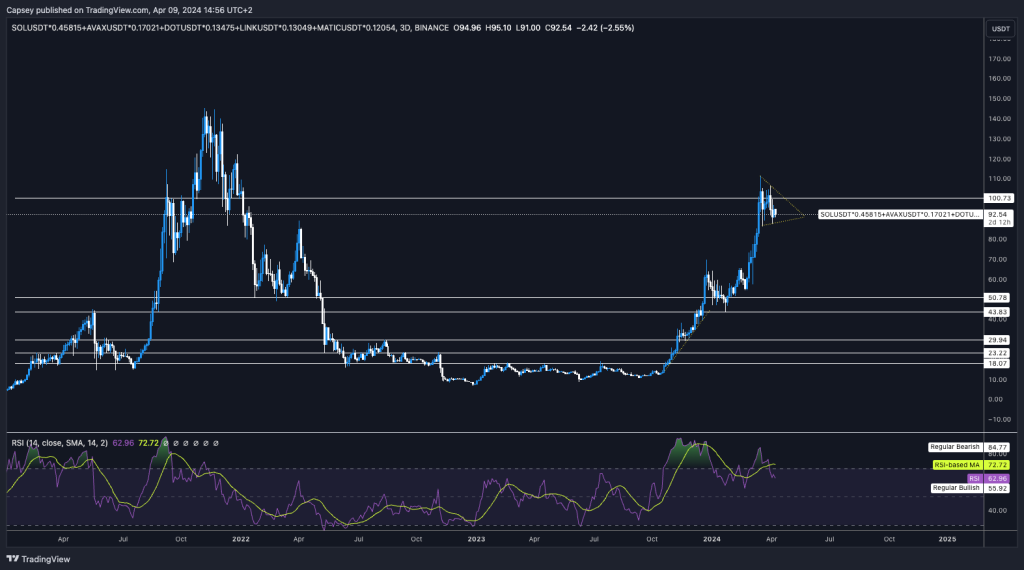
The Large Caps Index with SOL broke out of the $43-$50 area, came back and retested it, and then moved to the next major resistance at $100.We can now see that price has found resistance there, but it is forming a bullish pennant pattern, which comes to a squeeze point in mid-May. This gives this indicator plenty of time to break out while also aligning with our above thesis for the market over the next 3-8 weeks.
A breakout of the pennant and a move above $100 would see the Large Caps Index retest the highs at $150 and likely break above that level and into price discovery relatively rapidly upon retesting.
Large Caps Index without SOL
This Index looks great for further upside in the coming 3-8 weeks. We're in a clean uptrend, and the Index has now found support on top of the $22 area. This is setting up well for a move higher in the coming weeks to retest $29 and then break out above there. This would be the full-blown ALT season.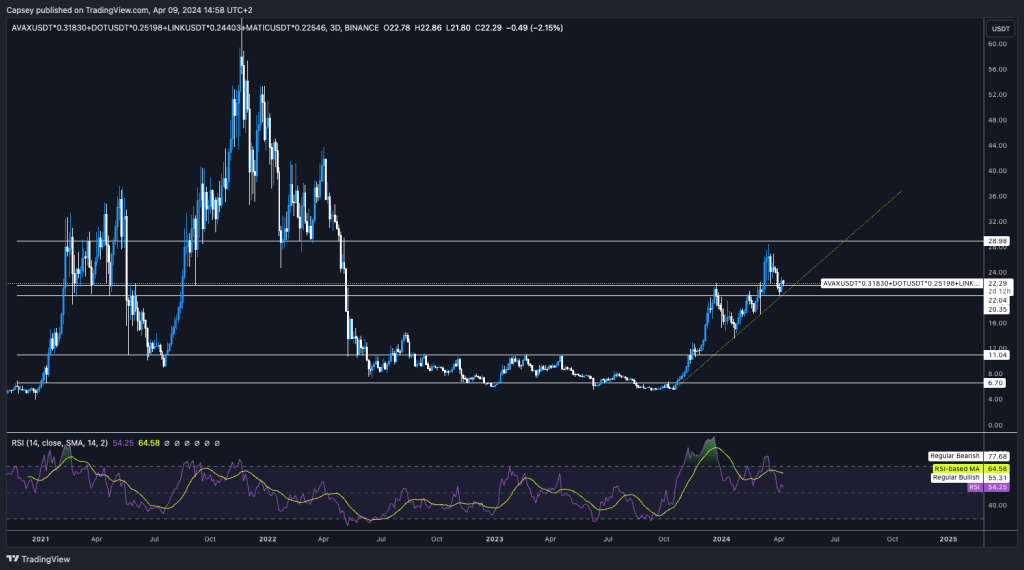
Cryptonary's take
In summary, we see crypto potentially facing some short-term headwinds due to the macro setup. However, we don't see prices falling off a cliff. Instead, they'll likely remain range-bound in the price ranges many coins have been in for the last few weeks anyway.But, from May onwards, we expect conditions to improve significantly; from the second half of May, we expect crypto to resume moving up. A more full-blown alt season may commence from June onwards, lasting six months or so.
Recommended from Cryptonary


