Save 23% ($351) & Get a Free 1-1 Call with our Team ⏰ : 0d 2h 59m 43s

Disclaimer: Not financial nor investment advice. You are responsible for any capital-related decisions you make, and only you are accountable for the results.
TLDR
- Bitcoin has broken an 8-year record by closing 7 consecutive red candles on the weekly timeframe.
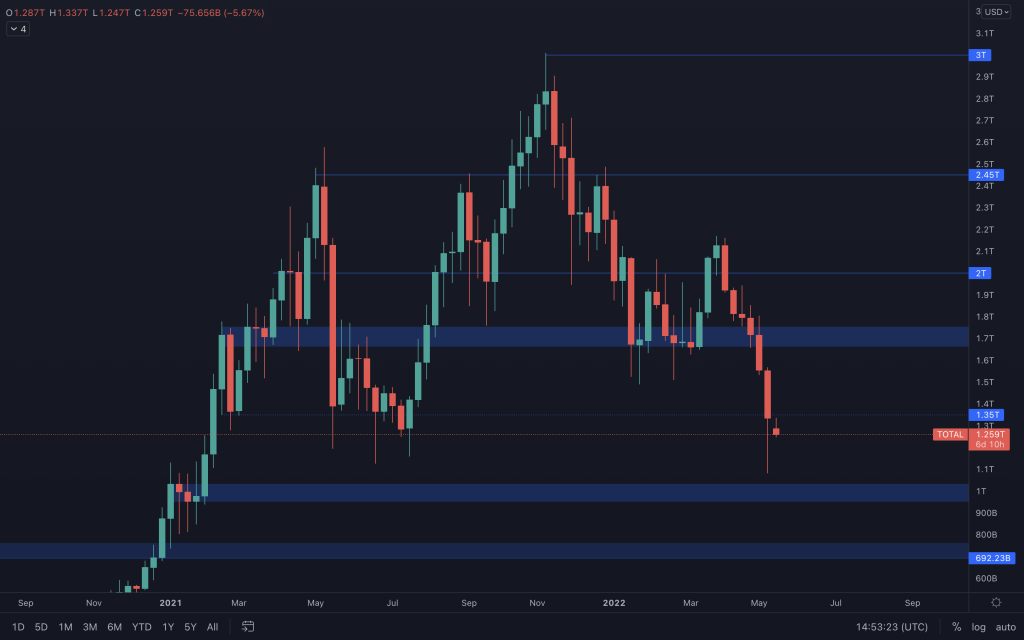
- Most assets are at crucial support areas, with the Total Market Cap closing its previous week just below the $1.35T level. A weekly reclaim above is needed to prevent further downside.
- The Exchange Net Position Change has seen inflows after a month-long accumulation trend over the last week.
- Last week's sell-off was mostly driven by the Luna Foundation Guard and short-term holders (coins aged younger than 1 week).
- Investors have been plunged into unrealised losses along with some realising losses as investor sentiment changes to a more fearful tone.
Technical Analysis
This week was intense - we've seen the market drop aggressively, as many assets have tested Summer 2021 lows. We've just broken the record for most red weekly candles in a row on BTC, which clearly indicate that selling pressure is at an extreme point. From now on, caution, vigilance, and most importantly risk management need to be amplified to not let the market control you - so you can control it instead. Let's dive in and see how this week progressed and what we should be expecting in the next couple of days, shall we?
Total Market Cap
Altcoins Market Cap
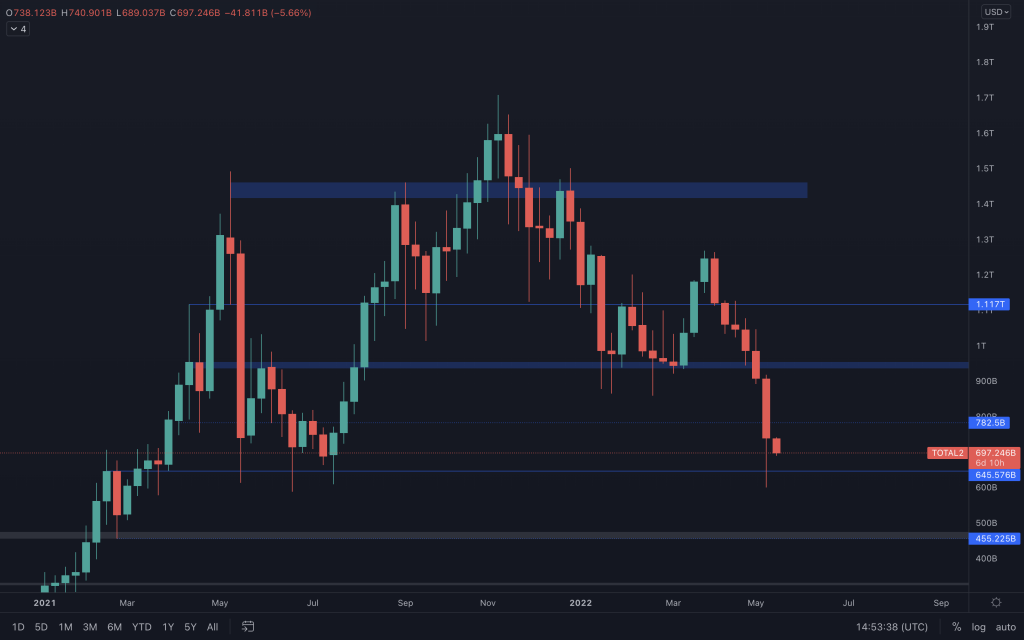 After closing under the $900B support level, we've been expecting a $645B test at some point with $782.5B being just an intermediate level - and that's what the Altcoins Market Cap did. We now have a solid $645.5B test and should be expecting sideways movement until either $645.5B or $782.5B levels are broken. The Altcoins Market Cap will move similarly to the Total Market Cap chart and Bitcoin, so monitoring those is recommended.
Bitcoin
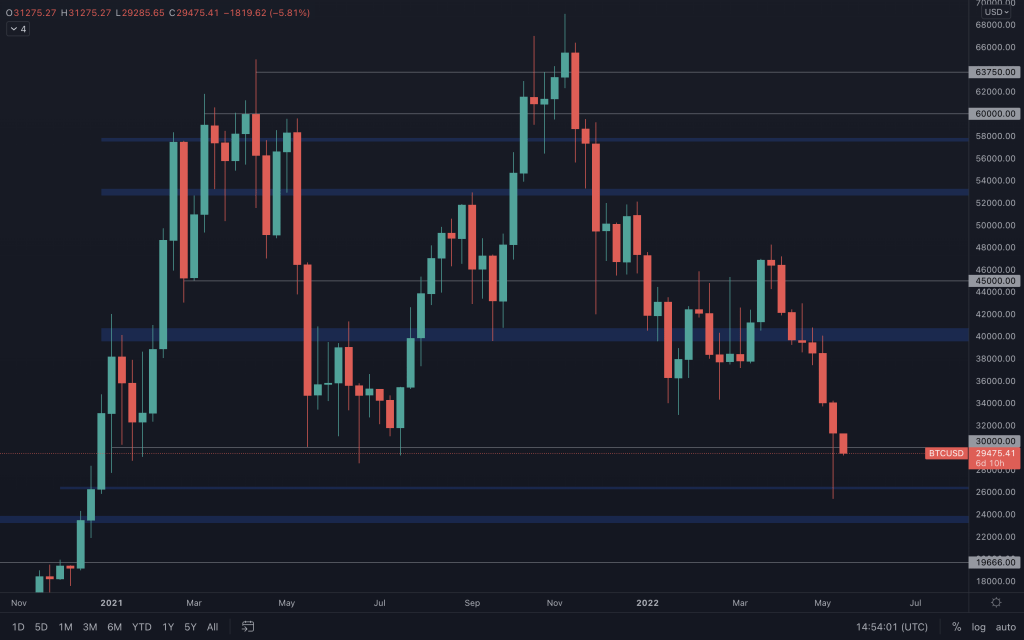 Bitcoin had an interesting week, we've seen price come back to $26k and even to $24k-$25k on some exchanges. Selling pressure continues and BTC knows how to make that clear, as we've now entered the 8th downtrend week. Question is - will this be the week when the trend is finally broken?
BTC has managed to close 7 red weeks in a row, something we haven't seen before - ever. However, we have no weekly closure under $30k yet, which means BTC can start seeing a selling pressure relief soon. Due to increased volatility, monitoring the daily timeframe is necessary, as even one single daily closure under $30k can indicate buyers still haven't managed to take control over the price.
Extreme caution is advised, if you feel like you're overexposed, we recommend reducing that exposure and lowering risks.
Ether
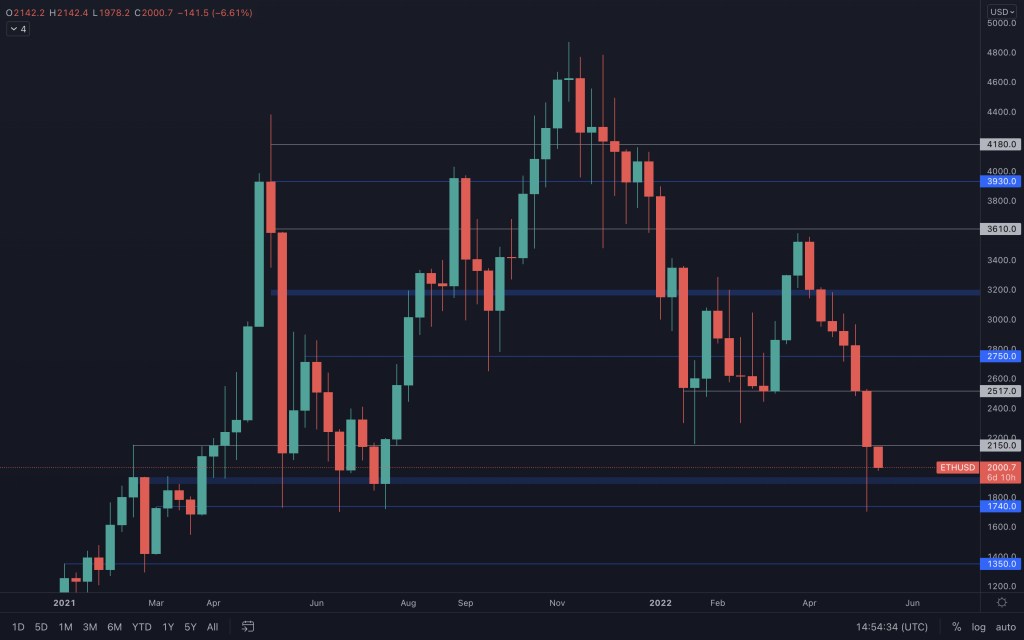 ETH managed to close the week just below $2150, which from a technical point of view still counts as a closure under support. Unless ETH manages to close this week above $2150, then a move to $1700 is on the cards, with $1900 being an intermediate level where it's possible we can see a reaction as there are more than likely buy orders set around that level.
DOT
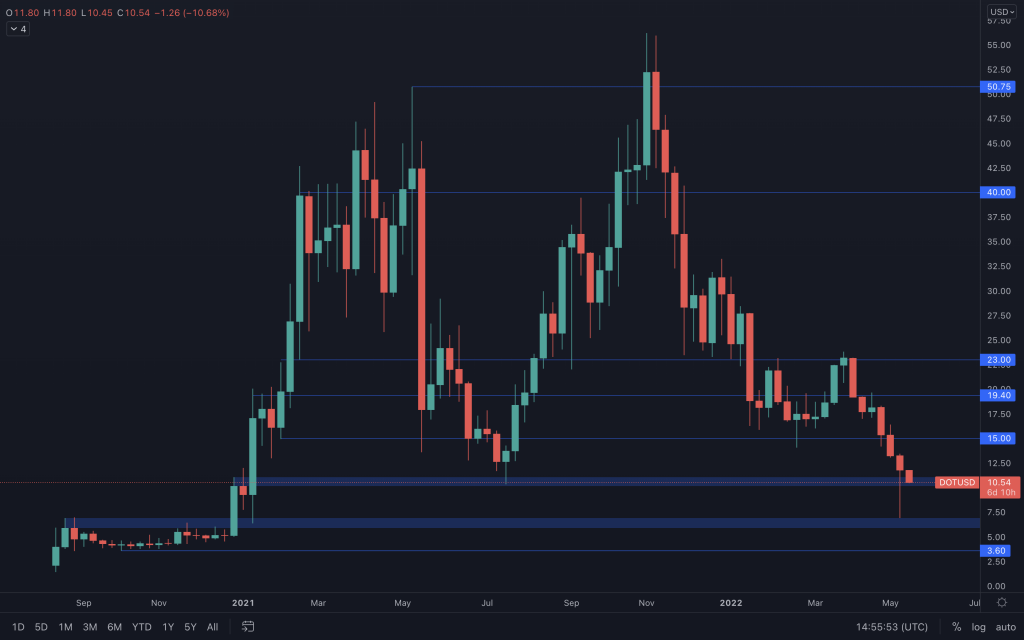 DOT was no exception to what happened last week and price dropped as low as $7. Same as BTC, DOT has managed to close its weekly candle above a crucial support level, in this case, that crucial support being $10.5. Holding this support level is extremely important for DOT, as a closure under $10.5 would become the lowest weekly closure since January 2021.
SNX
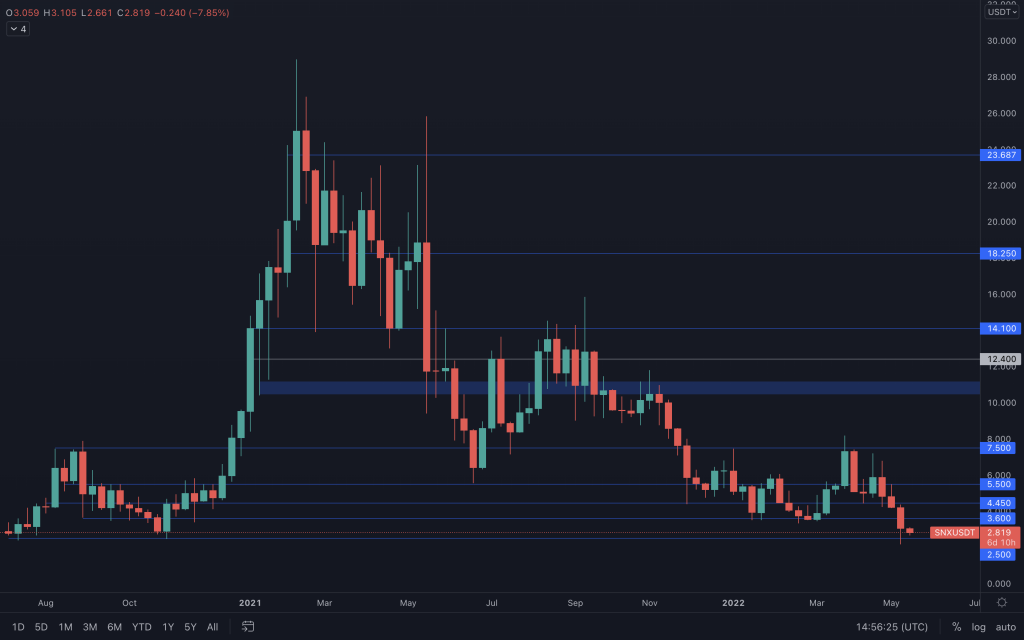 SNX has been in a downtrend for some time and we have no signs of that changing in the near future. Due to the huge selling pressure last week, SNX dropped to $2.12, a price level we haven't tested since July 2020. For now, the price is above its $2.50 support level - unless SNX closes the week under $2.5, then we cannot expect further downside for now.
RUNE
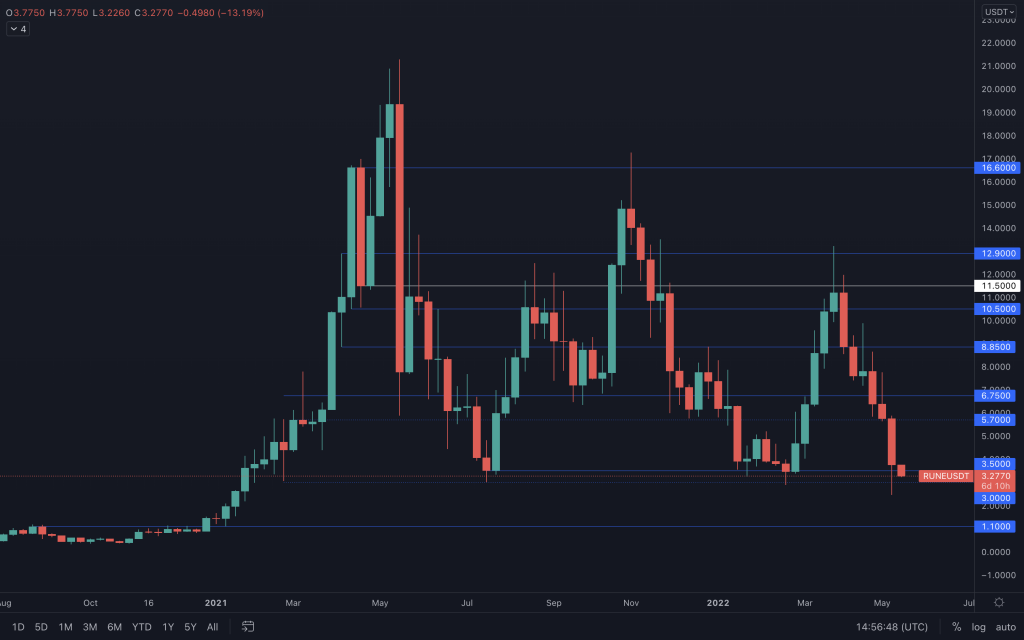 RUNE managed to close above $3.5, which means we need to wait for another weekly closure to see where price is headed next. So far, price has been trading under the $3.5 support level, but we've barely started the week - plenty can change by Sunday.
SOL
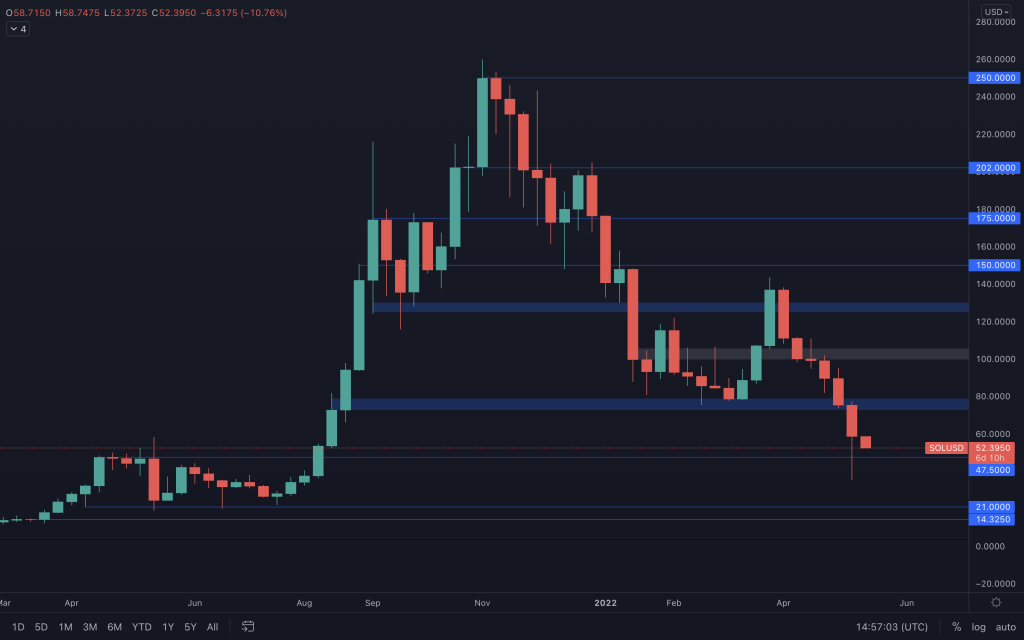 SOL wasn't able to hold $80 and as a result, tested $47.5 extremely fast. Same as RUNE, we now need to wait for another weekly closure to see where price is headed next, as SOL managed to close its previous weekly candle above the $47.5 support level.
SRM
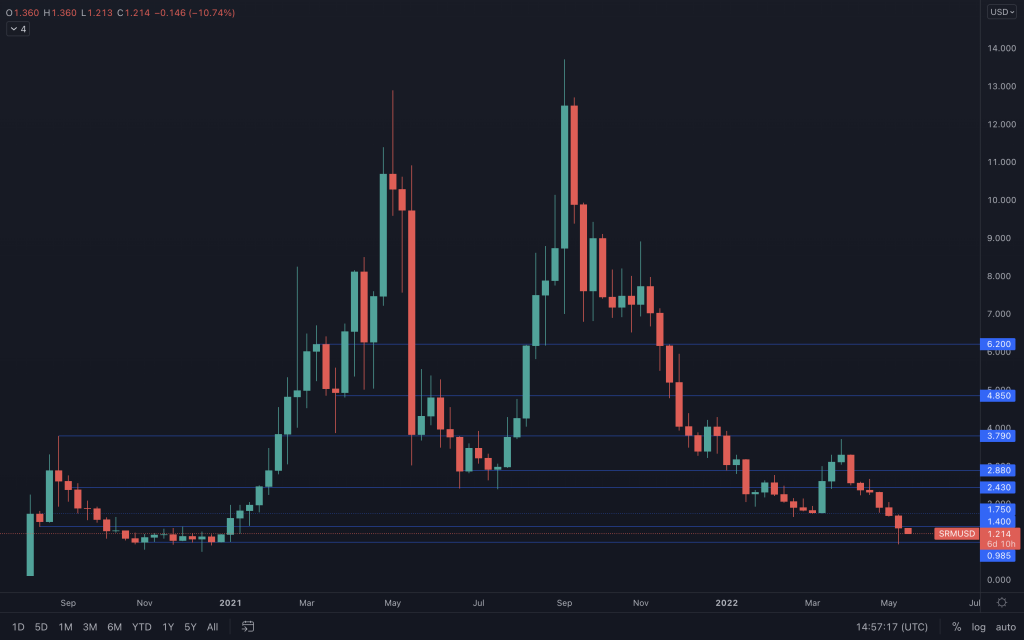 SRM's performance was quite weak since September 2021 and we've now seen it sub $1 for the first time in over a year. The previous week was closed just under the $1.40 support level, which means that unless SRM manages to close above $1.40 this week, then we should be expecting further downside back to the $1 level.
FTT
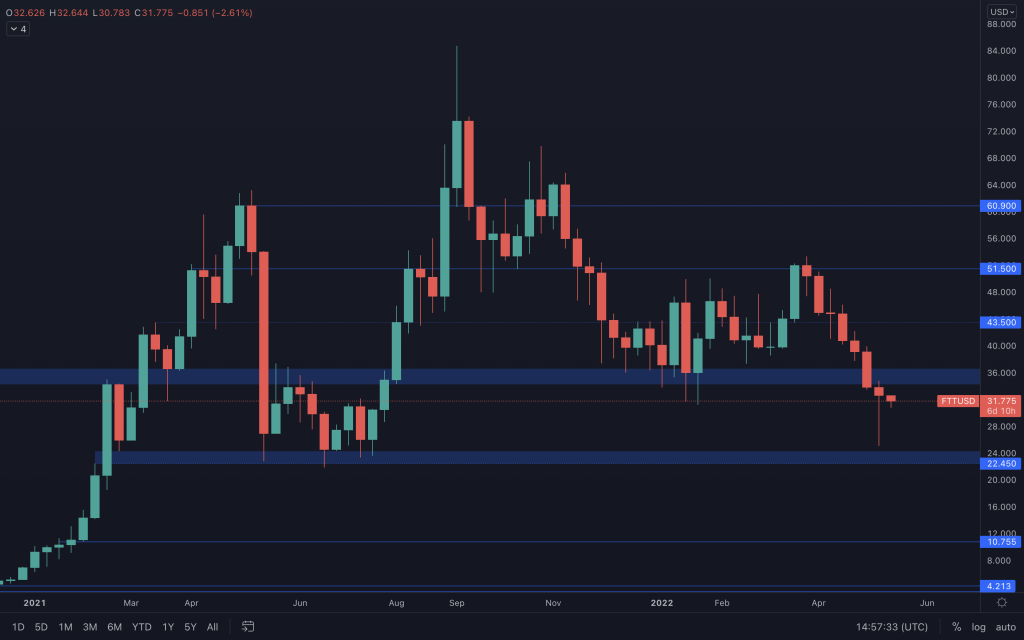 Interesting candle on FTT, we've seen both sellers & buyers being in control, and based on how huge the wick is, FTT has shown increased demand compared to other assets in this analysis. However, the price is still under the $35-$36 support area and only a reclaim of this area will confirm further upside. Until then, FTT will most likely range between $35 and $22.45.
MINA
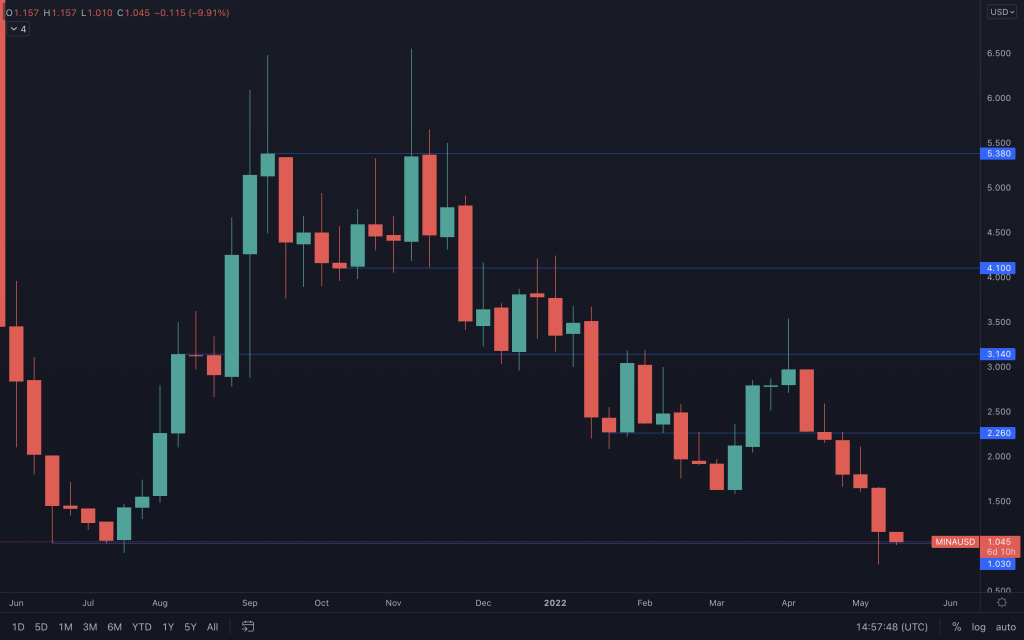 Due to reduced chart data on MINA, it can be interpreted that a new all-time low has been formed last week at $0.80. The $1 psychological & technical support level is key - if MINA isn't able to hold it then we can expect downside price discovery.
dYdX
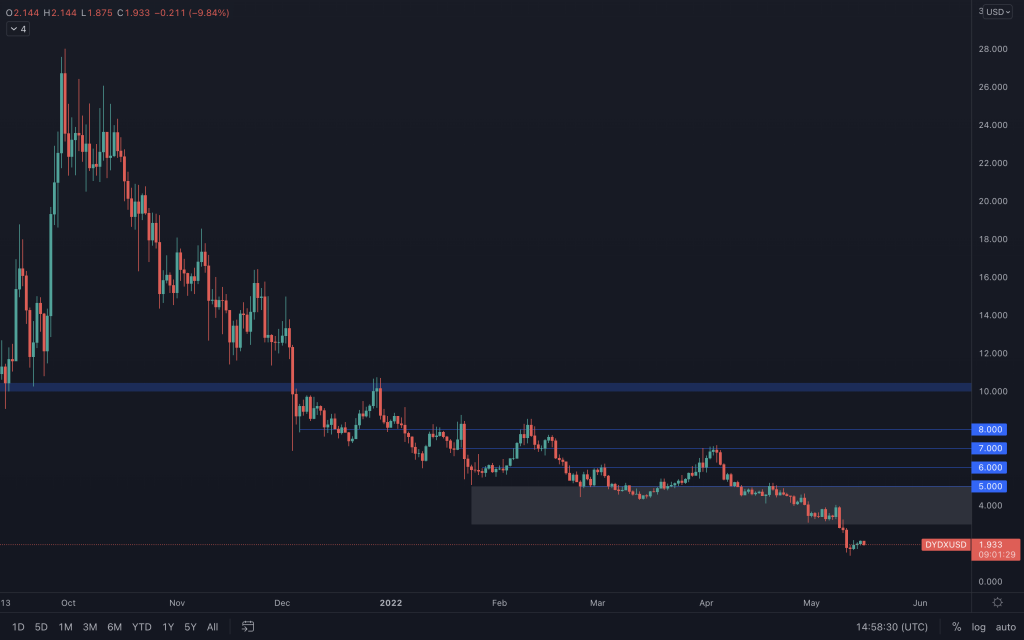 (Daily timeframe was used)
dYdX remains in downside price discovery as price formed an all-time low 5 days ago at ~$1.35. If BTC experiences an increase in buying pressure this week, then we can expect dYdX to test $3. A $5 reclaim needs to happen to confirm further upside for dYdX.
On-Chain Analysis
Over the past week, Bitcoin and the crypto market have seen new price lows of $26,600 and highs of $32,000, whilst the price sits at $29,300 at the time of writing. MacroWhilst the FED has just begun its tightening cycle (raising interest rates and reducing its Balance Sheet), crypto has struggled to get liquidity seeing as it has traded as a risk-on asset and the current environment is very much risk-off. Until there are signs that the FED has raised rates sufficiently and a portion of the Balance Sheet has rolled off (assets have matured), risk-on assets are likely to continue trading lower.
Metric 1 – Exchange Net Position Change
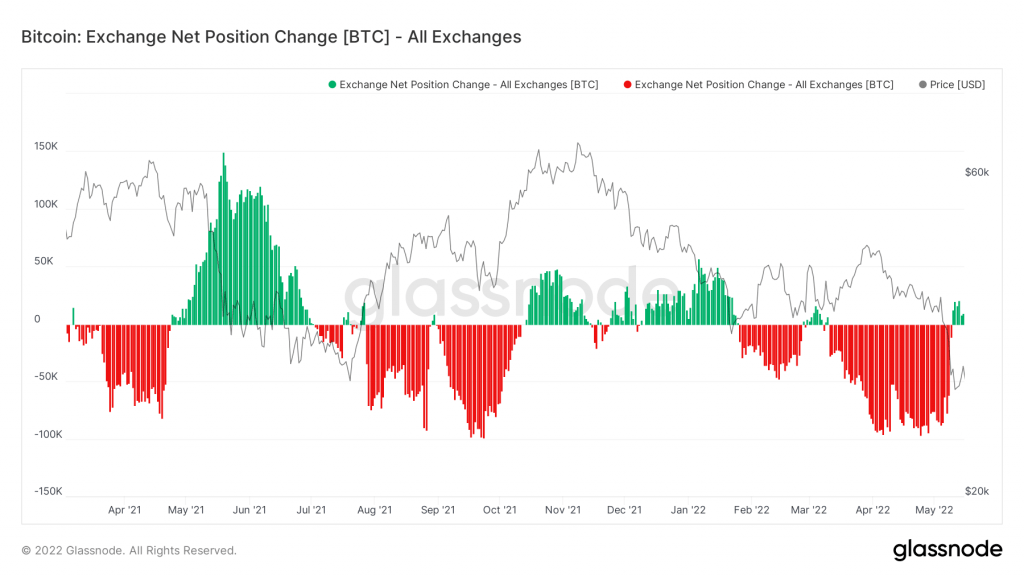
The first metric we will cover is the Exchange Net Position Change, showing the 30-day change of the supply held in Exchange wallets. This metric was showing heavy accumulation over the past month but has now returned to a more neutral level, with even a slight skew towards there being inflows of Bitcoins to Exchanges, suggesting a far weaker sentiment to accumulate.
Bitcoin – Exchange Net Position Change
Metric 2 – Exchange Netflow Volume
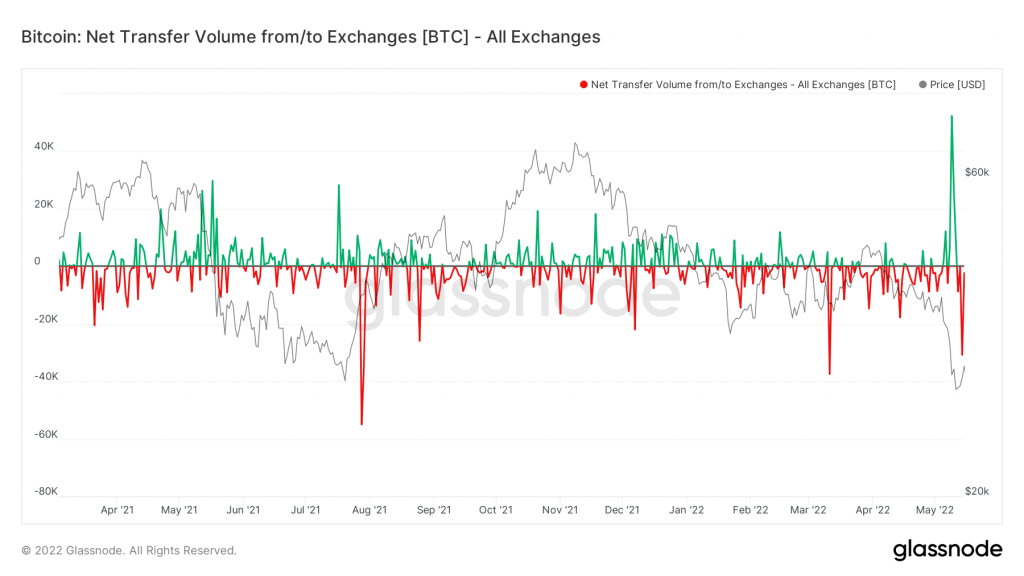
The Exchange Netflow Volume shows the difference of volume (Bitcoins) flowing into or out of Exchange. We can see that on the move down in price, there was a heavy influx of Bitcoins to Exchanges (coins being sold), however, in recent days, Bitcoin has seen some accumulation. This is represented by the red line dipping down on the right-hand side of the chart.
Bitcoin – Exchange Netflow Volume
Metric 3 – Spent Outputs
From last week’s report, we know a lot of the Bitcoins flowing into Exchanges to be sold were from the Luna Guard Foundation, selling just over 80,000 Bitcoin. However, we saw some capitulatory type of behavior from short-term holders as we have seen a spike in young coins being spent.
Bitcoin – Spent Outputs 1D-1W
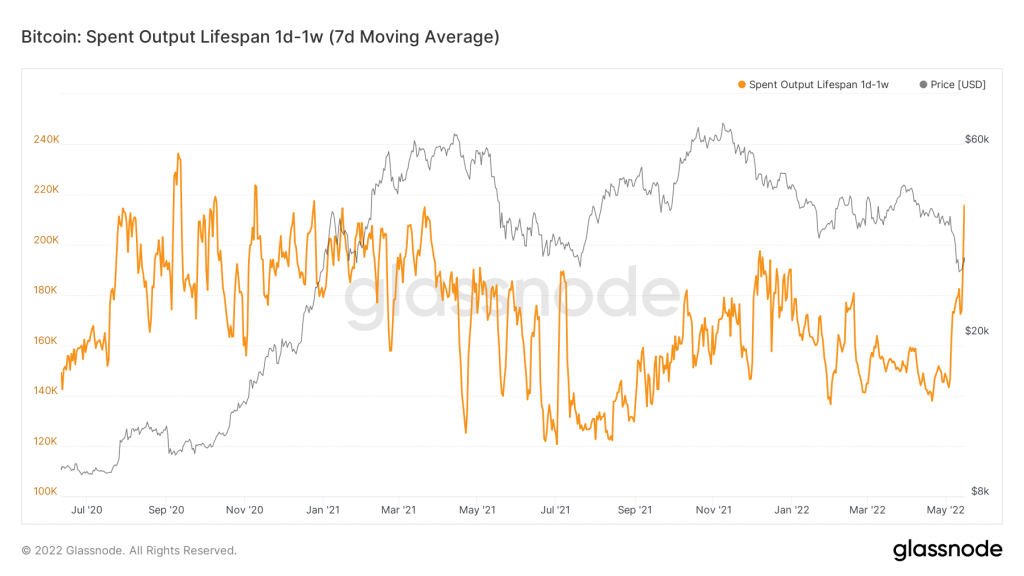
The above shows that young coins (coins that were bought in the last week) were spent on-chain, most likely realising a loss. This is a sign that sentiment is weak, and investors are willing to sell and just get out but note this is from short-term holders, and this behavior has not been reflected by the long-term holders. However, the evidence suggests that the long-term holders did much of their selling several months ago.
Metric 4 – Net Realised Profit/Loss
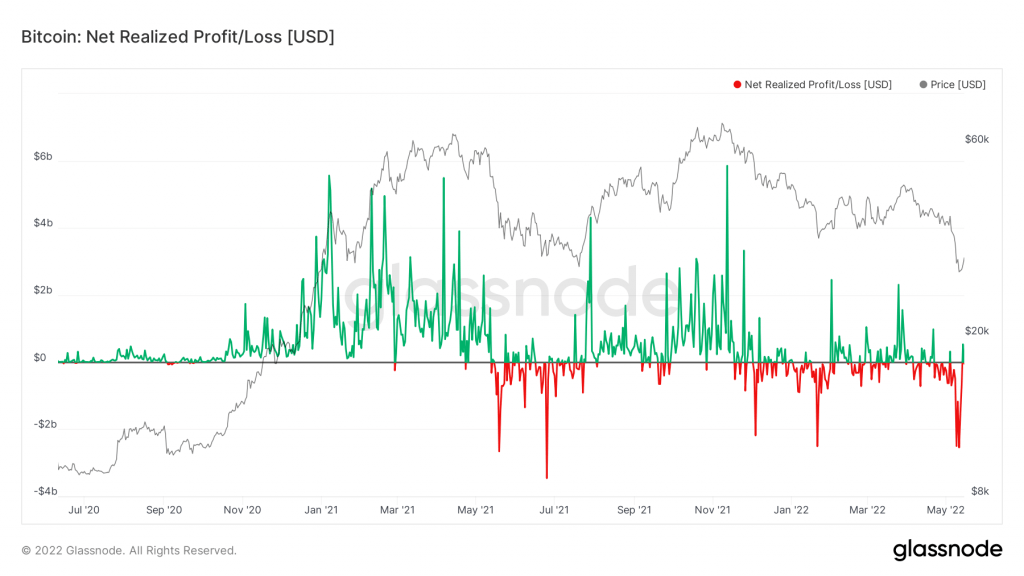
The Net Realised Profit/Loss showed last week there was some significant loss taking. But there have been some realised profits in the last days. This is a positive sign as it shows that investors are willing to wait for higher prices in order to take profits and are not looking to sell as soon as prices move up to a break-even level. If we had seen the Net Realised Profit/Loss tick up to the flat 0 line and then reject, this would tell us investors are selling into break-even, so it is good we did not see this and we saw some profits being realised (green spike).
Bitcoin – Net Realised Profit/Loss
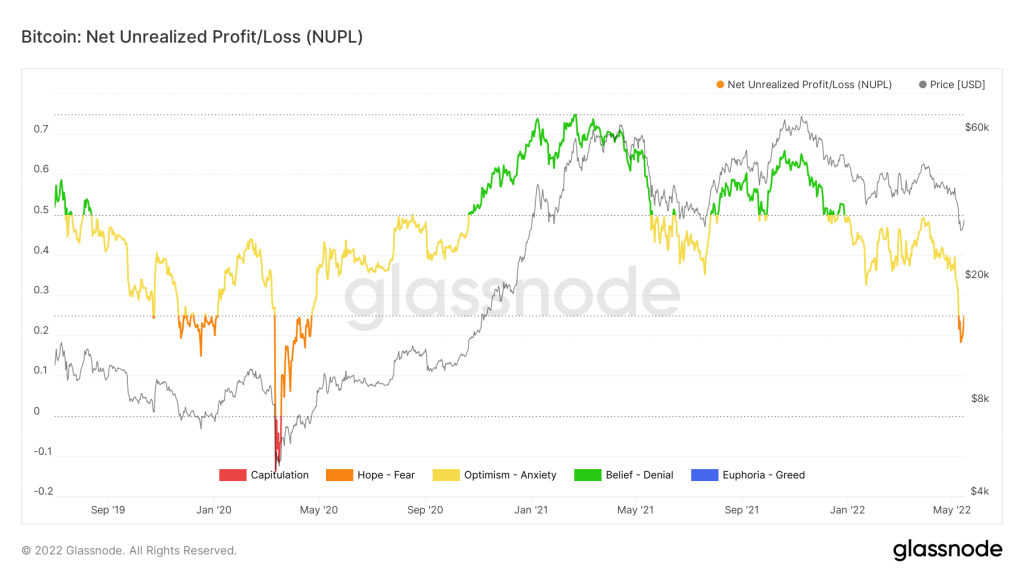
Metric 5 – Net Unrealised Profit/Loss
The Net Unrealised Profit/Loss for the first time since April 2020 is showing that the market is in a fearful stage. This may predict we have further downside to go and this metric acts as an important metric for assessing investor sentiment.
Bitcoin – Net Unrealised Profit/Loss
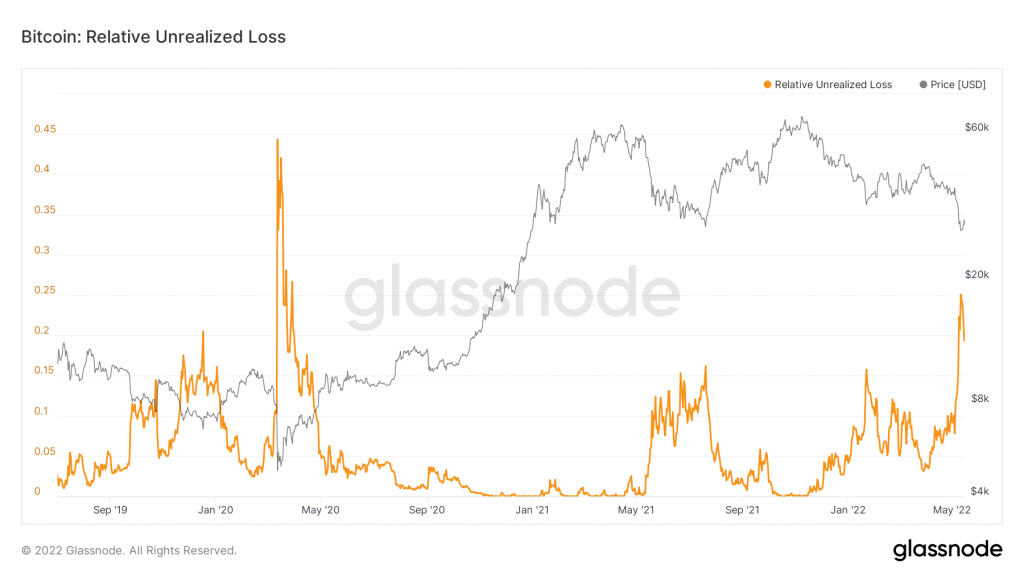
Metric 6 – Relative Unrealised Loss
Another metric assessing what has happened this past week is the Relative Unrealised Loss. This shows that this past week, there was the largest spike in unrealised losses since March 2020 (the Covid crash). The Unrealised Losses aren’t as extensive as the Covid crash but still indicate that investors were plunged into significant losses, albeit not made realised yet.
Bitcoin – Relative Unrealised Loss
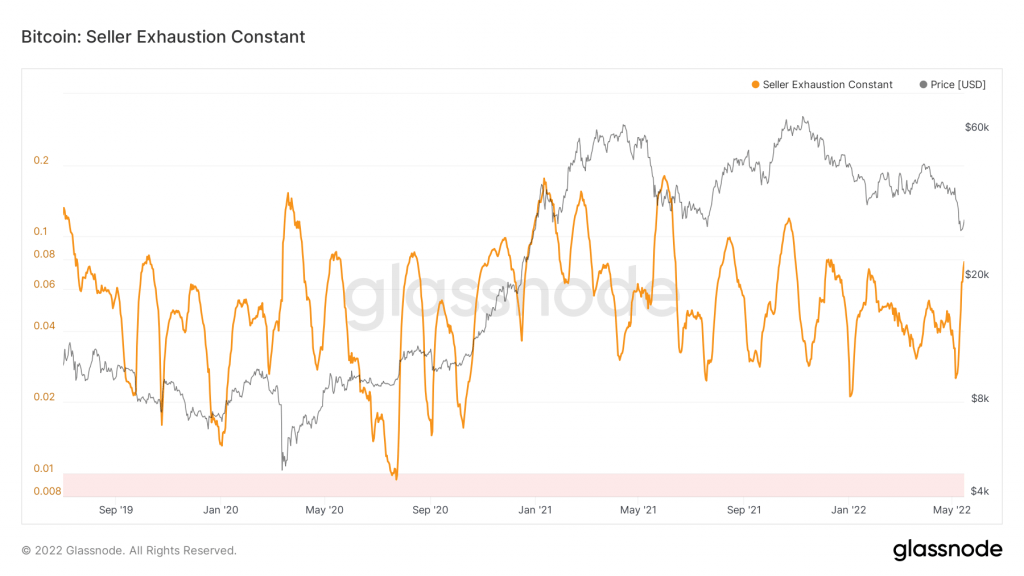
Metric 7 – Seller Exhaustion Constant
The Seller Exhaustion Constant detects when low-risk bottoms are in. We can see from this metric that even though it has spiked, it has not spiked to the high levels that we have seen over the past year, and this may indicate that more downside is still to come.
Bitcoin – Seller Exhaustion Constant
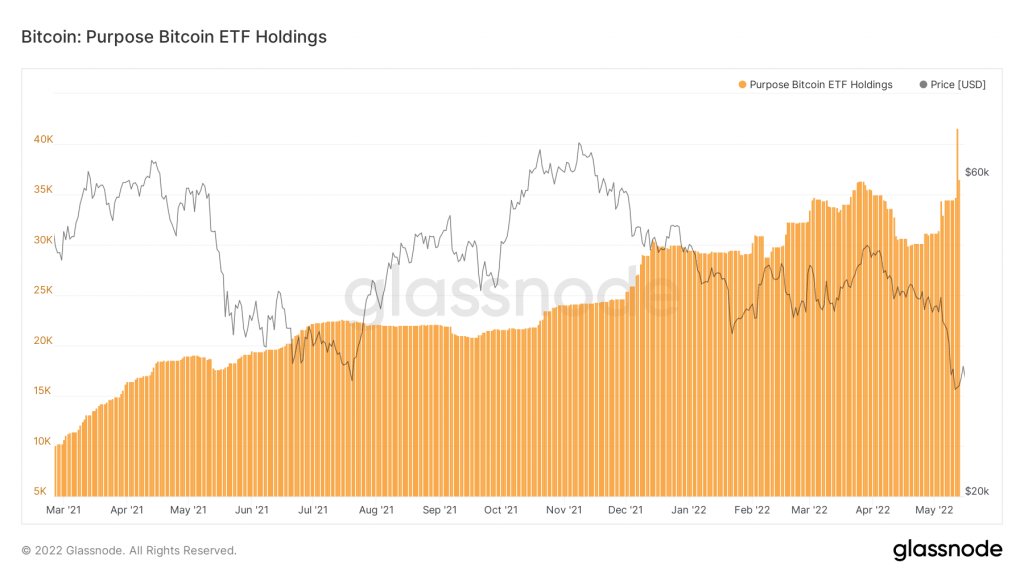
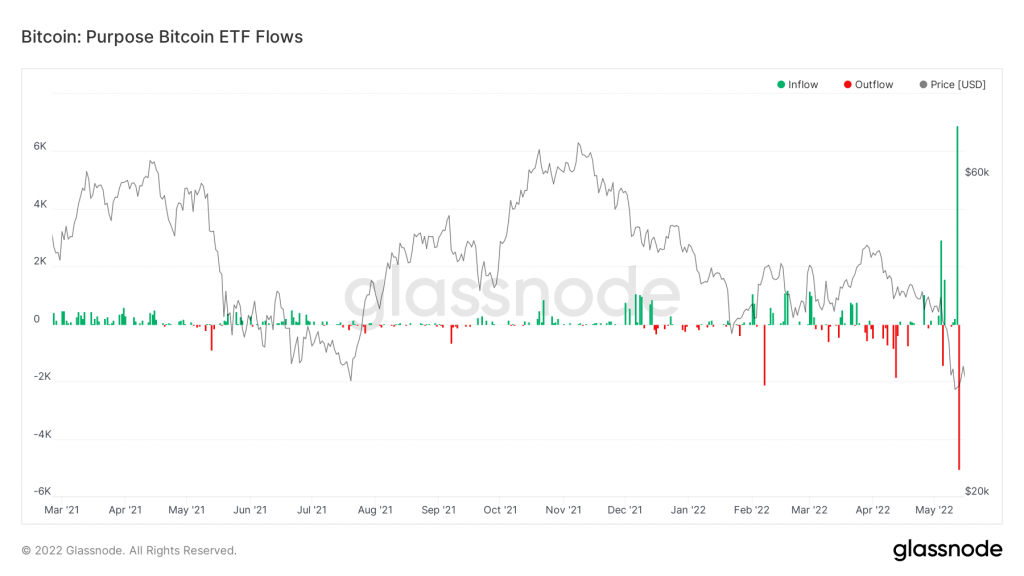
Metric 8 – Purpose ETF Holdings & Flows
The last two metrics we’re going to cover in this report are almost a contrast to what we have seen in the above metrics. The Purpose ETF has added Bitcoin to its ETF in the past few days, to the point where it was holding the most amount of Bitcoin it ever had. On Thursday, May 12th there was a 6,900 Bitcoin inflow to the ETF, yet there was a 5,000 Bitcoin outflow just a day later. This is a rather peculiar behavior from such a large Institution but may be worth watching to see how it develops over the coming weeks.
Bitcoin – Purpose Bitcoin ETF Holdings
Bitcoin – Purpose Bitcoin ETF Flows
Summary
The past week has seen both unrealised losses and realised losses spike, indicating there may be a change of sentiment from a neutral level to a fearful level. Even though there has been a spike in losses, there are indications that in the coming weeks and months there still may be further downside, this is reflected in the macro, and the Seller Exhaustion Constant. On a more technical level, the crypto market is overwhelmed by sellers in what has grown to be one of the longest weekly candle downtrends in BTC's history. Bitcoin is testing crucial levels and $30.000 is now acting as a threshold between it testing the mid $20ks or ranging between $30k and $40k. All in all, it's wise to reduce exposure and to prepare for the worst, even if it might never come.Recommended from Cryptonary


