Save 23% ($351) & Get a Free 1-1 Call with our Team ⏰ : 0d 2h 59m 43s

Disclaimer: Not financial nor investment advice. You are responsible for any capital-related decisions you make, and only you are accountable for the results.
Macro
The standout news of the last week was last Friday’s Powell speech at Jackson Hole. Powell’s hawkish comments were an attempt to walk back the dovish comments he made during the last FOMC press conference during journalists' questions.Powell suggested that ‘some pain’ may be felt by households in the coming quarters as the FED will raise rates and hold them at a level that they see as restrictive. This is the first time that the market really compounded Powell’s comments as previously we have seen rallies on Powell speech’s due to some unscripted dovish comments. However, by mentioning that the consumer might ‘feel some pain’, this told the market that Powell and the FED are going to be serious about raising rates, keeping them high, and eventually slaying the inflation dragon.
Now, this being the first time that the markets believed Chair Powell, we saw a notable sell-off in most assets, particularly risk assets (tech equities and crypto). With Powell laying out the FED’s plan for the next month – at least until the next FOMC meeting, the likelihood is that risk assets will continue to struggle for liquidity and that the overall downtrend will likely persist.
TLDR
- The pace at which retail is buying Bitcoin has slowed significantly, conveying that even the smallest holders are beginning to be sceptical of buying Bitcoin at current levels.
- Bitcoin addresses with more than 1,000 BTC (the most profitable cohort) remain cautious. Although there is a slight uptrend in addresses that hold over 1,000 BTC, it’s not aggressive enough to show that they are ready to risk-on with confidence.
- Purpose Bitcoin ETF holdings indicate that institutional players, who sold half of their holdings back at June’s lows, are similarly refraining from risking on.
- The MVRV Z-Score is back within the green buy zone, suggesting that Bitcoin is undervalued. In 2018 it managed to dip to the lower extremities of the range, so it is possible that we could see Bitcoin’s price retrace further.
- The Realised Price by Addresses has historically identified market bottoms. Using this metric, if history is to repeat itself, $12,700 could be considered a target area for the market bottom.
Total Market Cap
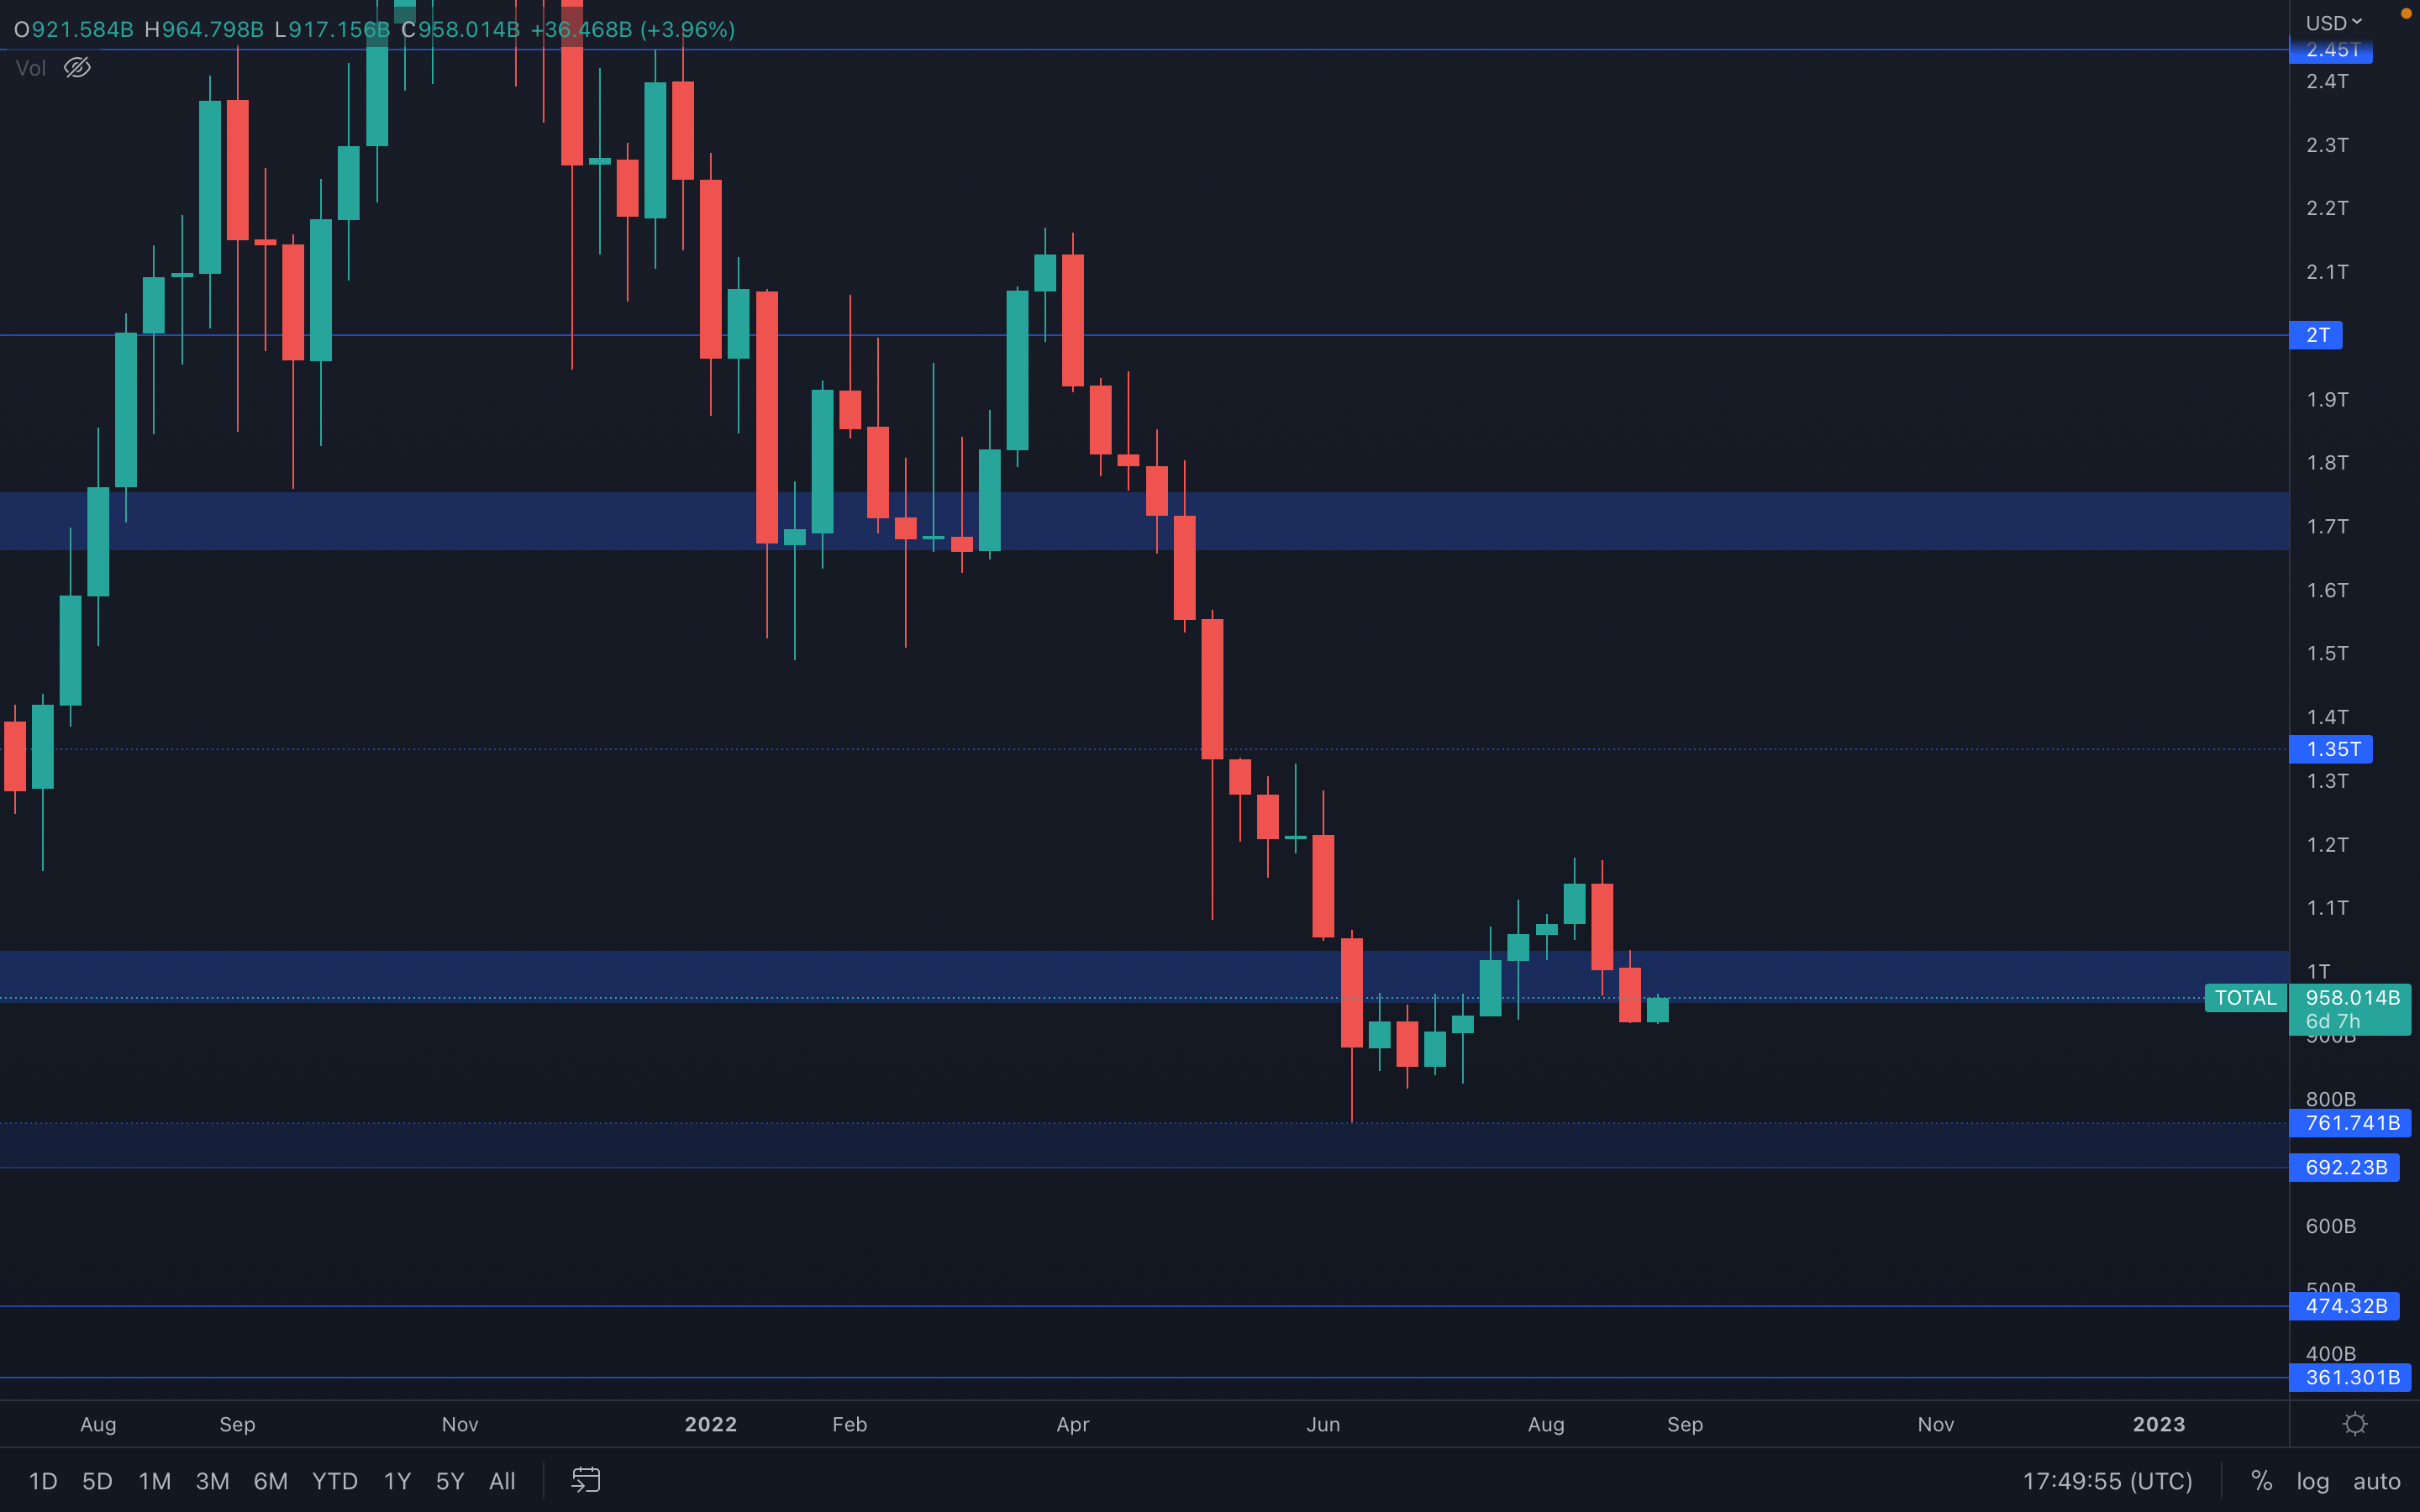 The Total Market Cap has closed below $1T once again - this invalidates any further upside until the level is reclaimed via a weekly closure above it. This week is decisive, as a failed attempt of reclaiming $1T can lead to further downside, back to the $760B level. This scenario will push most assets into forming new lows, further aiding the higher timeframe bearish market structure.
For this week, we are going to monitor whether $1T is reclaimed or not, and then base our next moves on what has occurred during the next few days.
Altcoins Market Cap
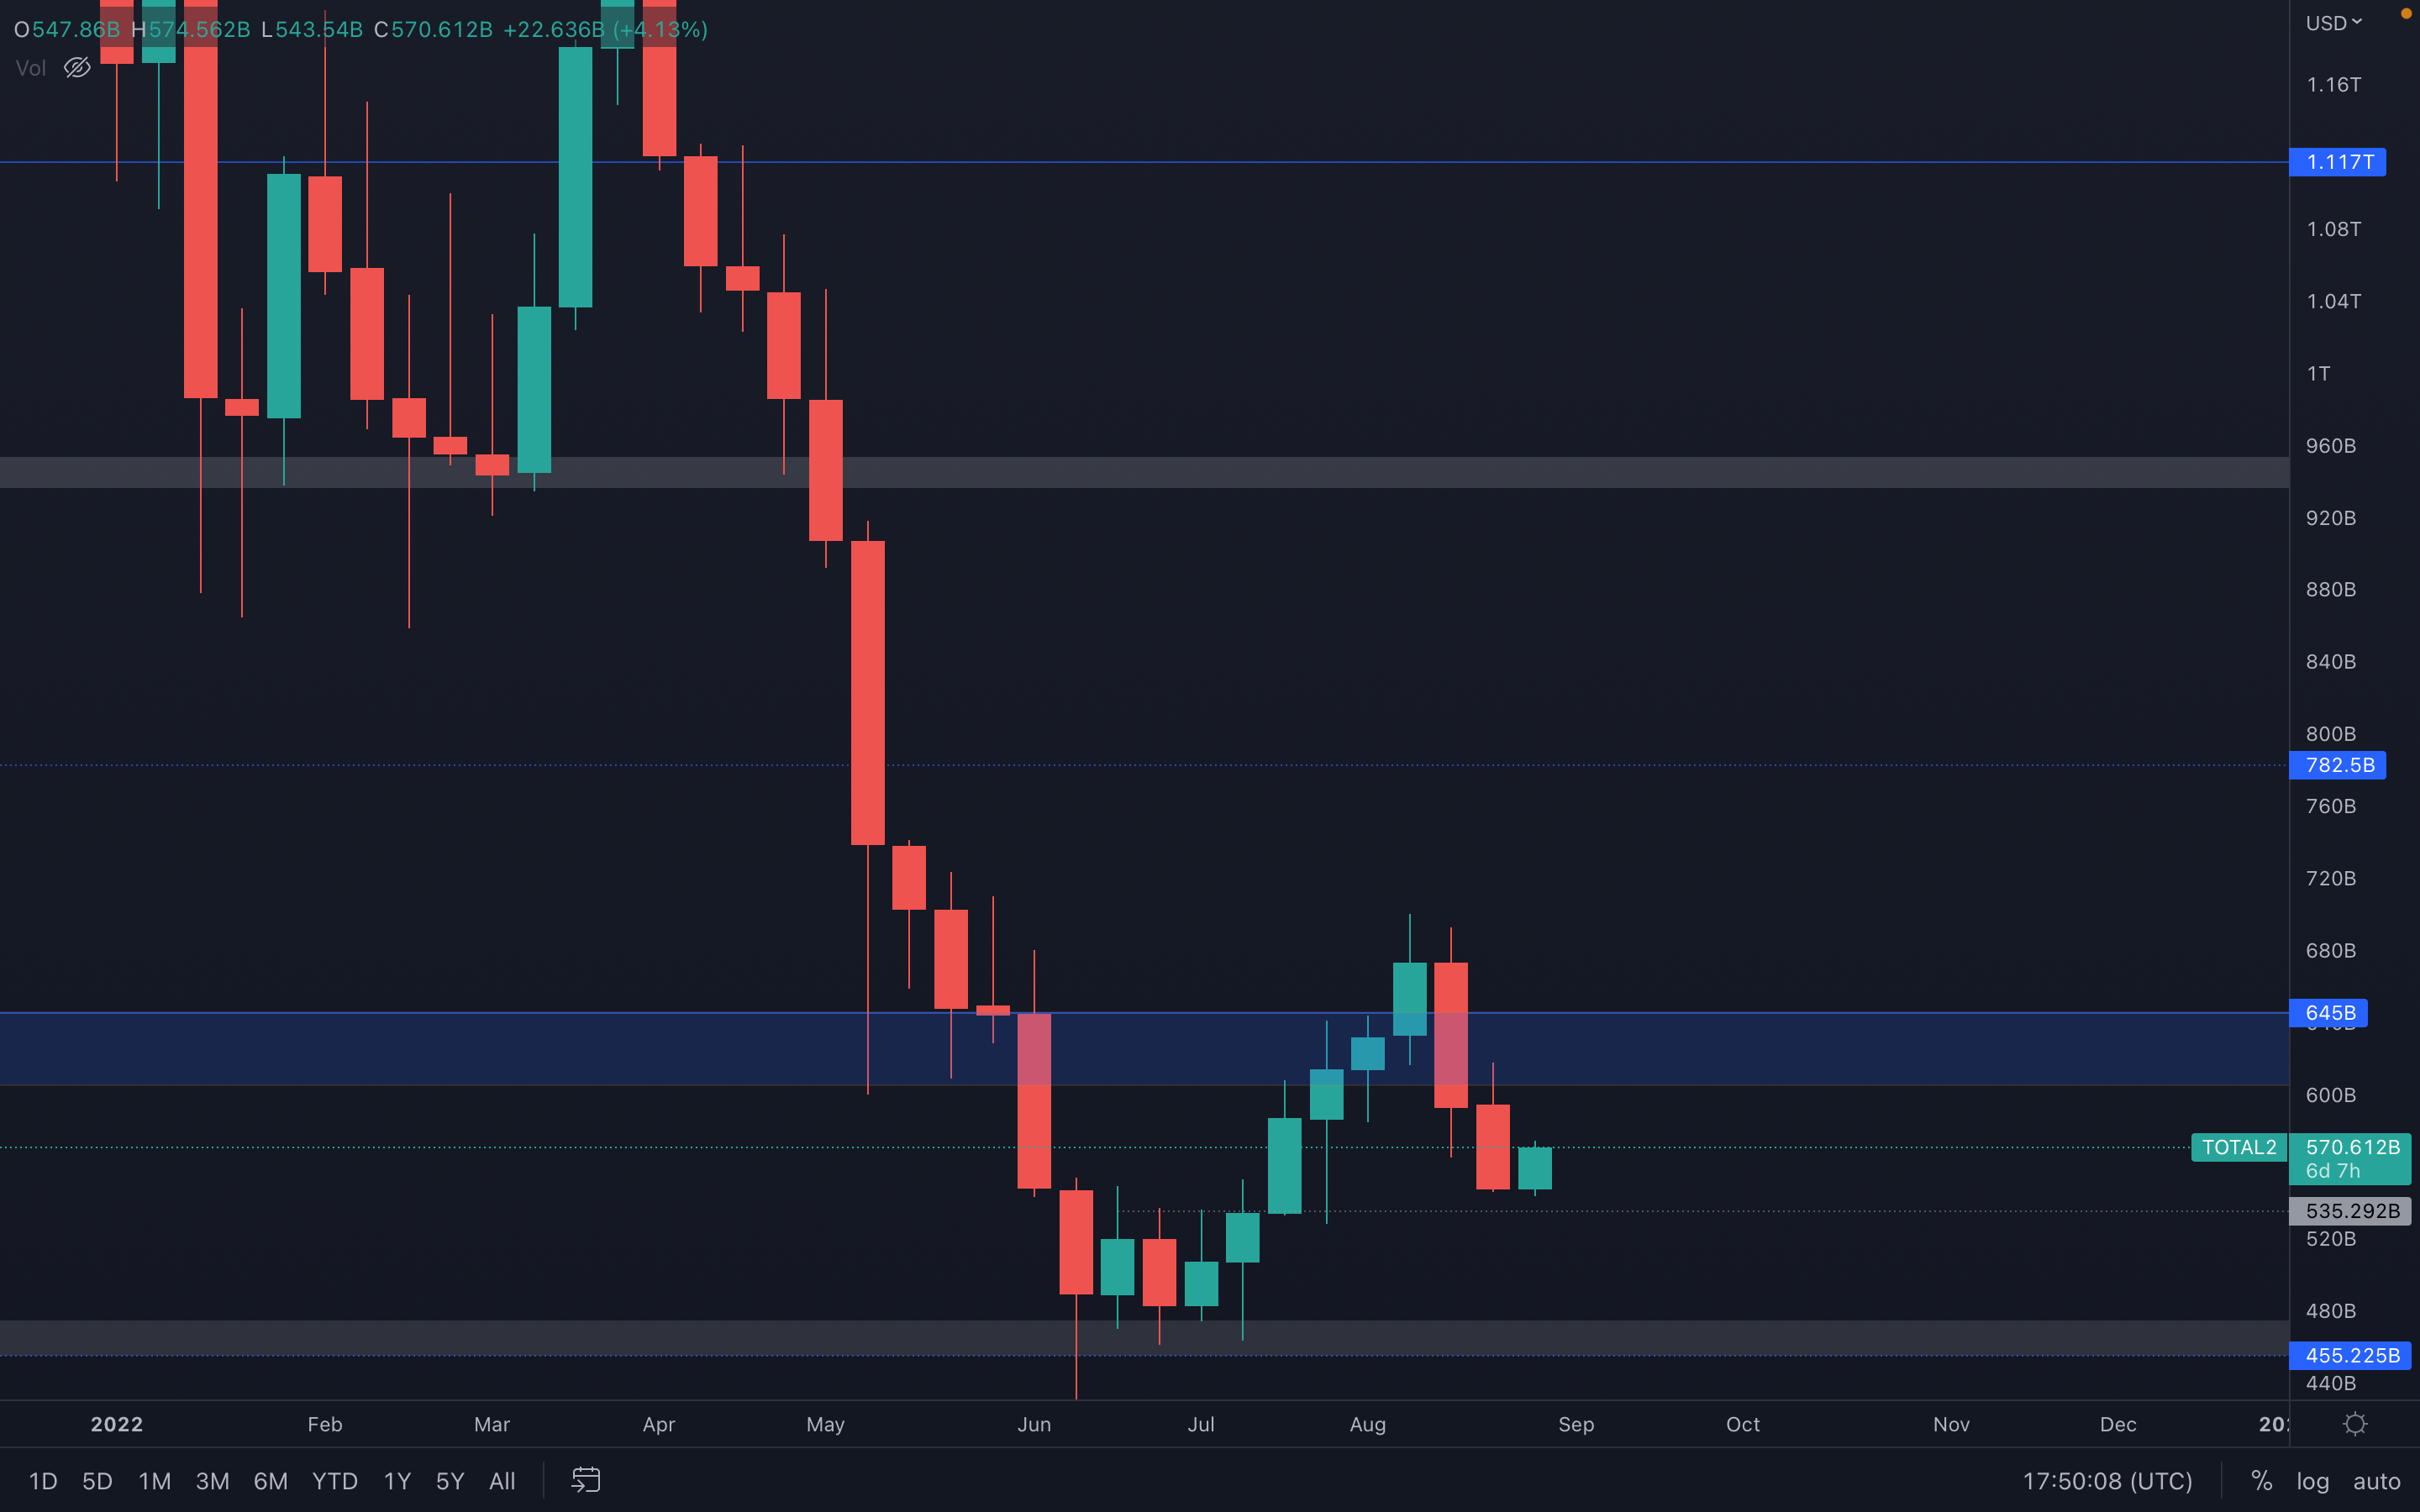 The Altcoins Market Cap is looking rather better than the Total Market Cap, with the index finding itself just above a weekly support level at $535B. However, we have to remind ourselves that this is an intermediate support, and that most likely demand will be found at the next support area, between $470B and $450B. No further assumptions can be made, for that we need more data which we will gather soon (if the market chooses to behave accordingly, of course)
Bitcoin - Technical & On-Chain Analysis
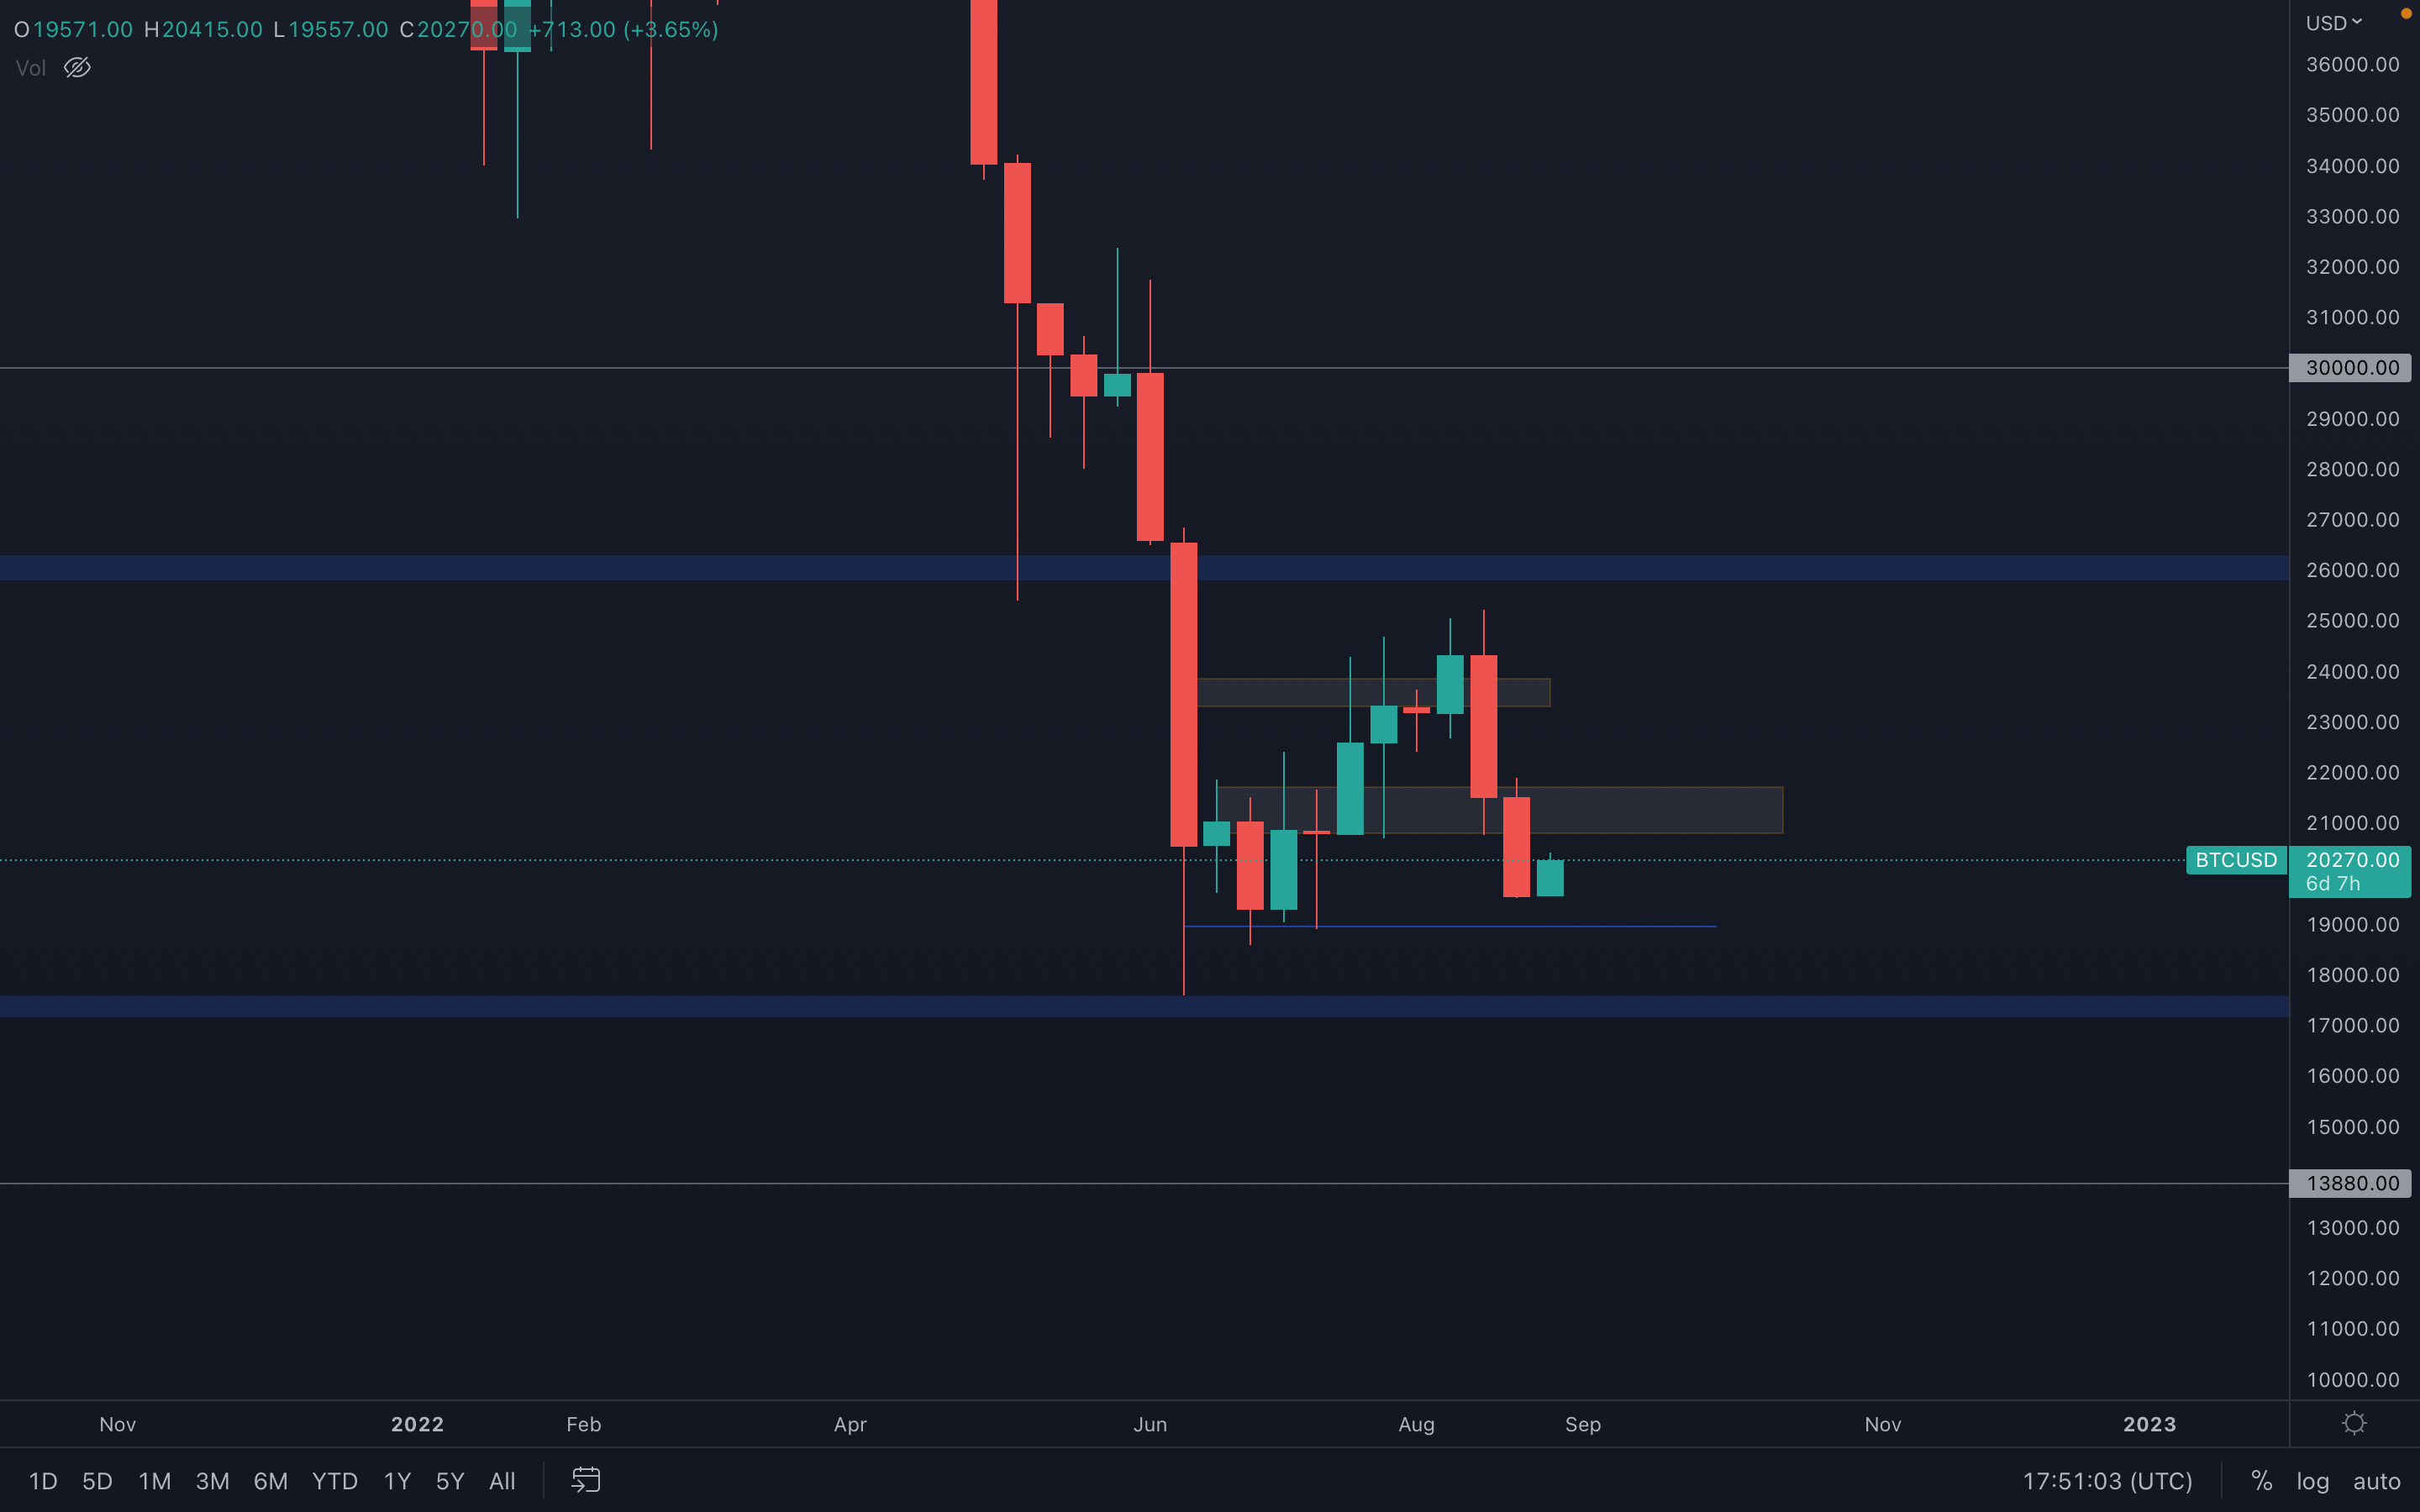 Weeks of growth have been invalidated in two weeks time - that's the power identifying a market trend holds. We've mentioned a couple times that the previous price action was nothing more than a bear market rally, pump, which will get short lived due to decreased buying pressure. That happened, and Bitcoin has now found itself back to June lows.
A bullish engulfing candle has been formed on the daily timeframe, which suggests the next resistance level can be tested in the coming days (~$21,000), but overall, $19,000 remains the level Bitcoin is aiming for.
Metric 1 – Addresses
The first metric we will cover in this week’s on-chain report is the Addresses metrics. Usually, we are looking for the Bitcoin Addresses with Balance > 1,000 Bitcoin to be increasing as historically this is the most profitable cohort, and an increase in number of wallets in this cohort would be a sign that they are buying Bitcoin again. In the past few weeks, we have seen a slight uptrend in this metric but not in the aggressive manner that we saw from this cohort in late 2018 (the last bear market macro bottom). For this reason, this slight uptrend isn’t enough to get us thinking about risking back-on again.
Bitcoin – Addresses with Balance > 1,000 Bitcoin
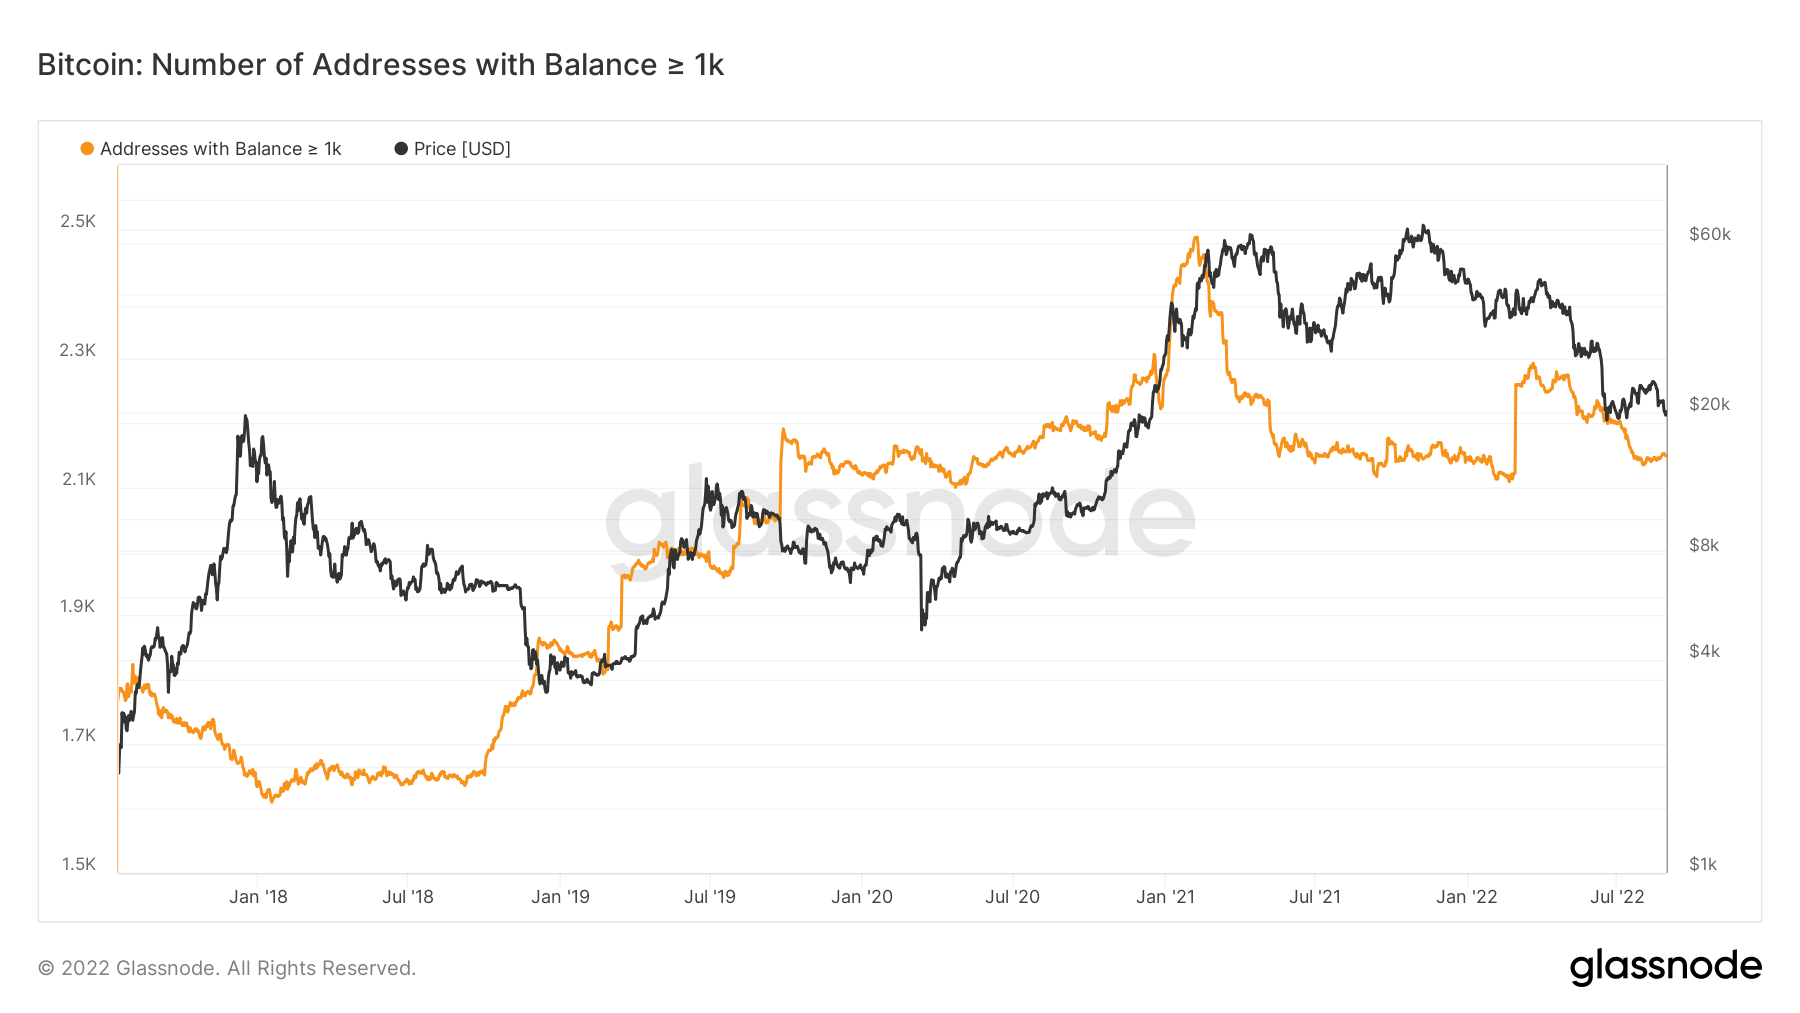
Note: the large increase up on 28/02/2022 is Exchanges creating new wallets to hold coins, not an organic move but technically not a misprint. This should be noted when analysing the data above. Also confirmed by the data provider – Glassnode.
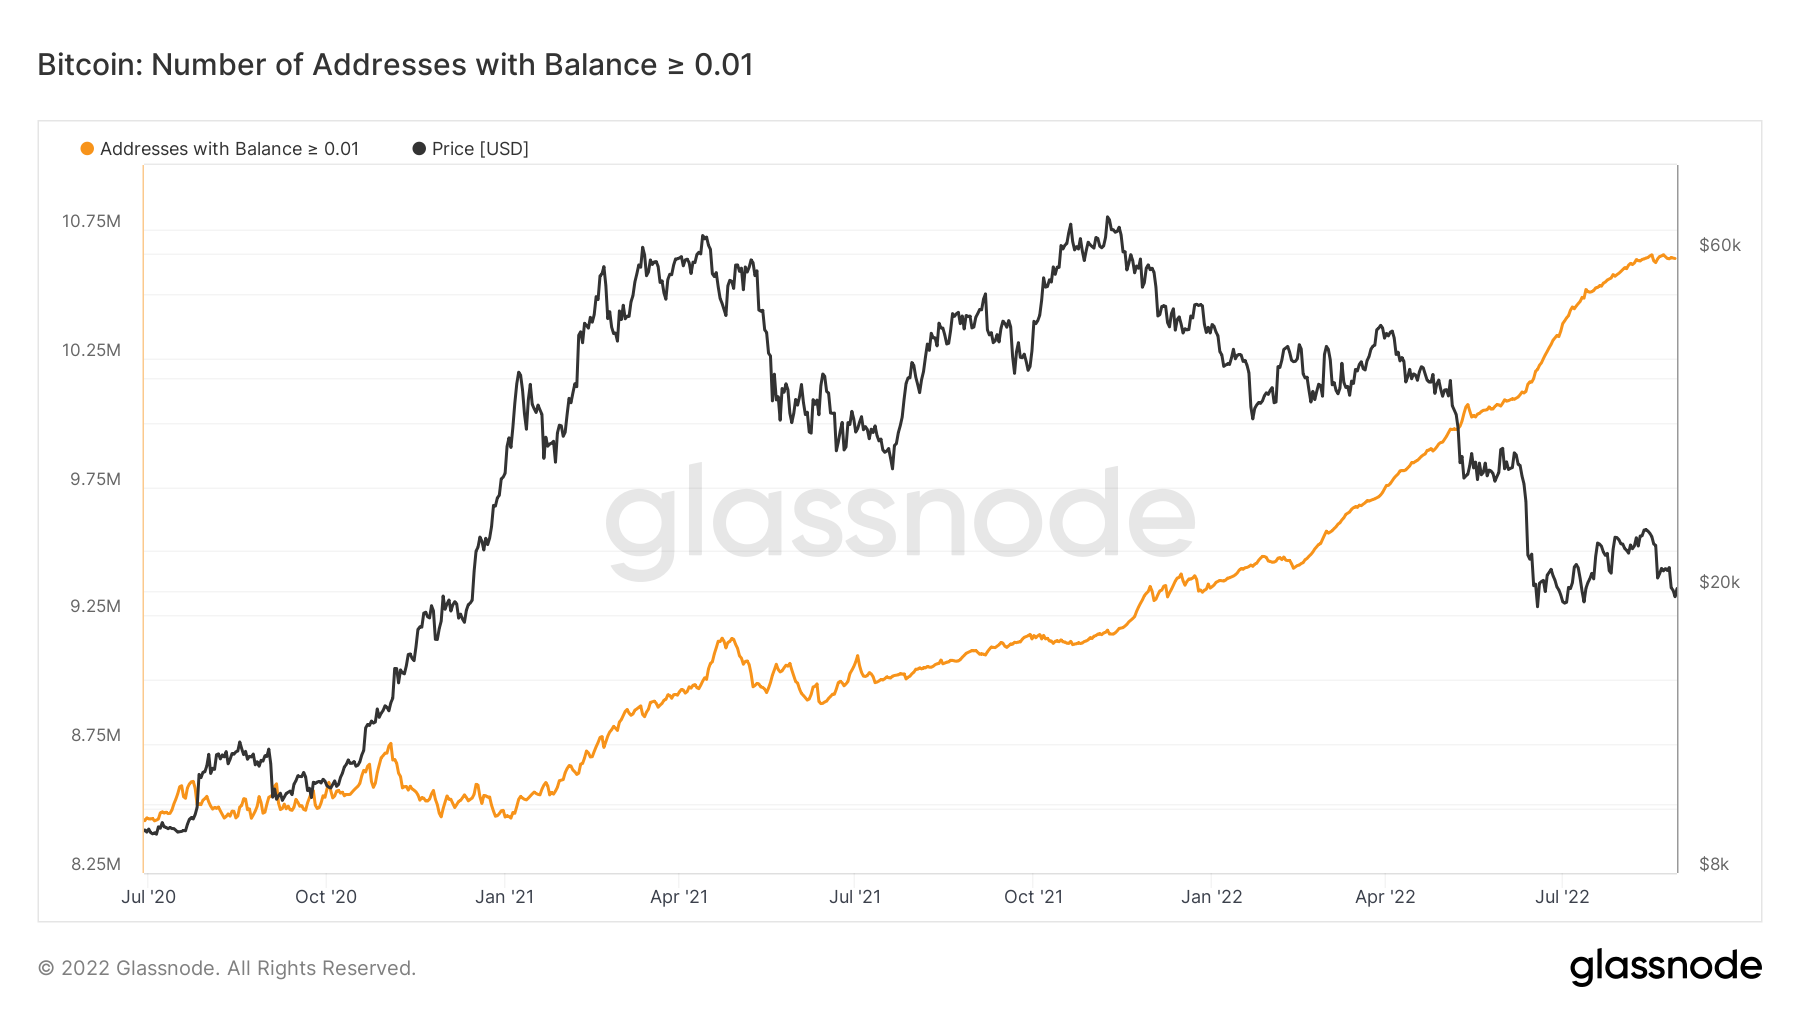
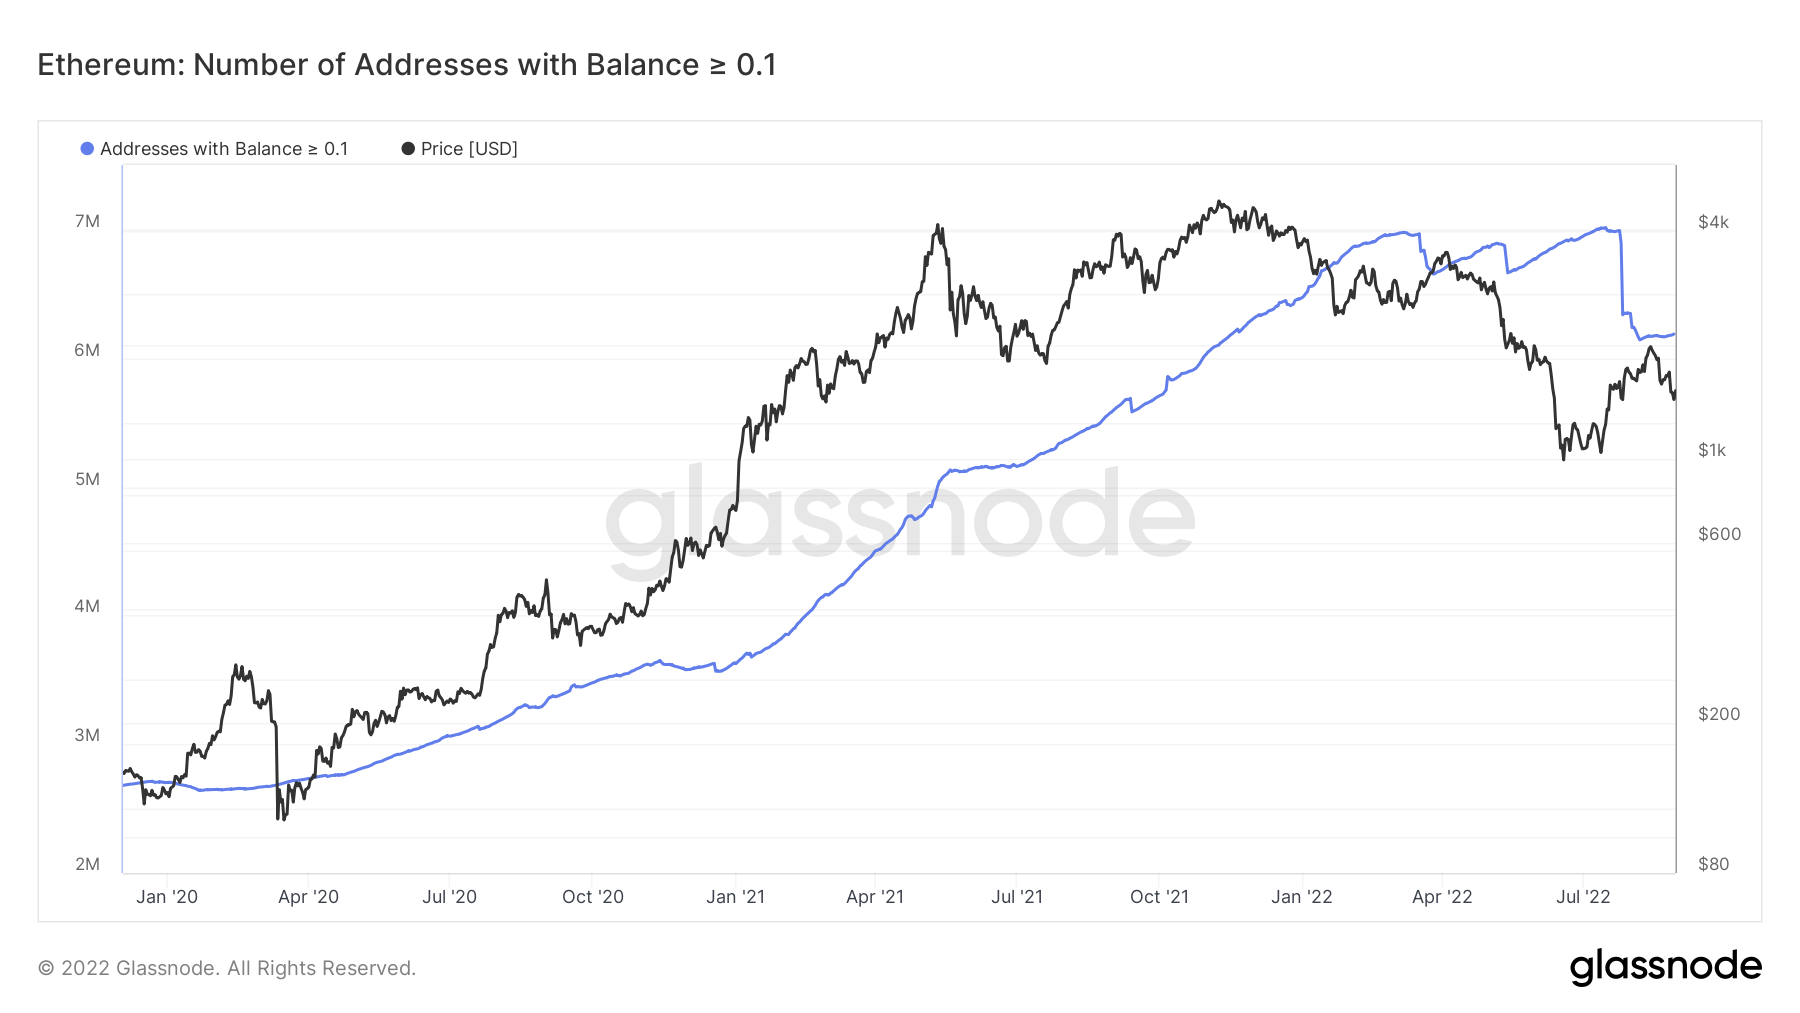
If we look at the Addresses with Balance > 0.01 Bitcoin, we can see that in the last year, they have been increasing in a steep uptrend. However, this cohort has now begun to slow, and it could almost be described as peaking out. This shows that wallets aren’t just continuing to add sats as the price of BTC comes down and perhaps the market is more sceptical of adding at current prices.
Bitcoin – Addresses with Balance > 0.01 Bitcoin
 When looking at the Futures Estimated Leverage Ratio, we are looking to see if the ratio is high. If the ratio is high, then this may indicate that there is a lot of leverage and that this may be needed to be flushed out, potentially causing a volatile move. Usually, a sign of a healthy leverage ratio is between 0.18 and 0.22. Currently, the leverage ratio is at 0.295. This would indicate that there is a lot of leverage built up and therefore we could be vulnerable to a nasty move.
Metric 2 – Purpose Bitcoin ETF Holdings
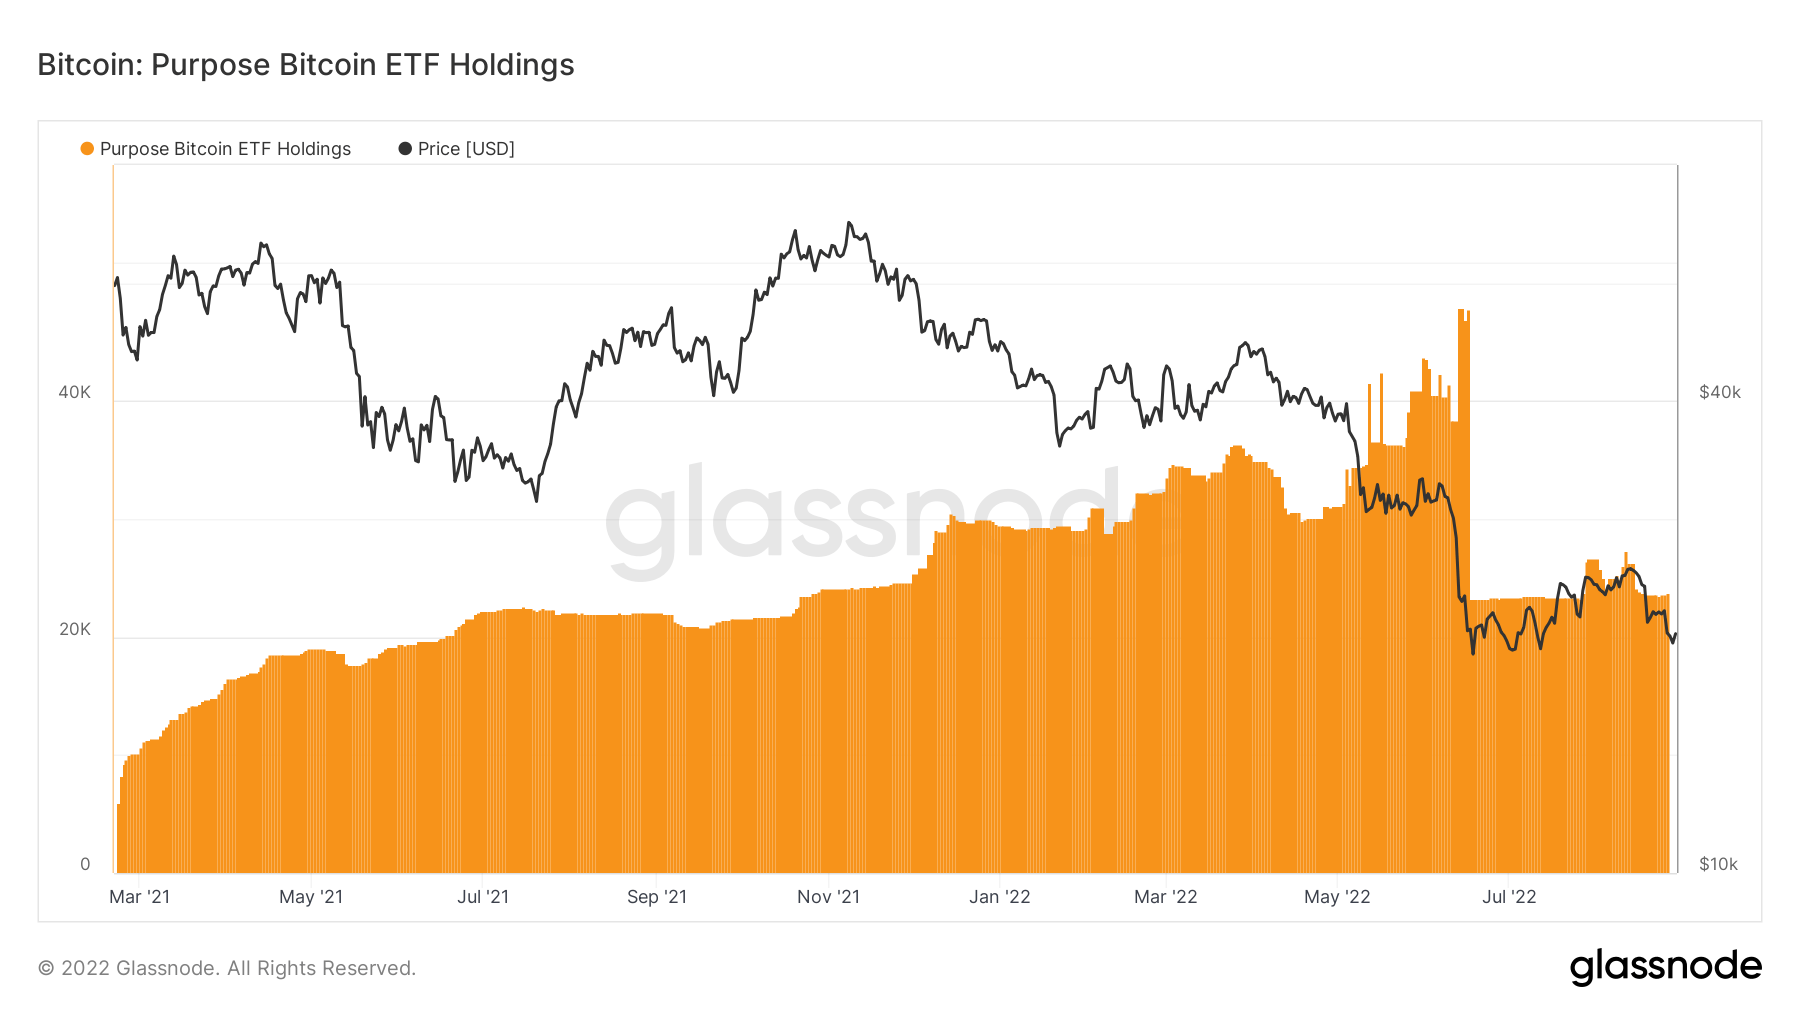
When assessing the largest wallet holders, it is key to understanding what the institutional players are doing – another metric we can use for analysis. We can see that the Purpose Bitcoin ETF sold around half of the coins they owned at the June lows and is yet to risk back on.
Bitcoin – Purpose Bitcoin ETF Holdings
 Metric 3 – MVRV Z-Score
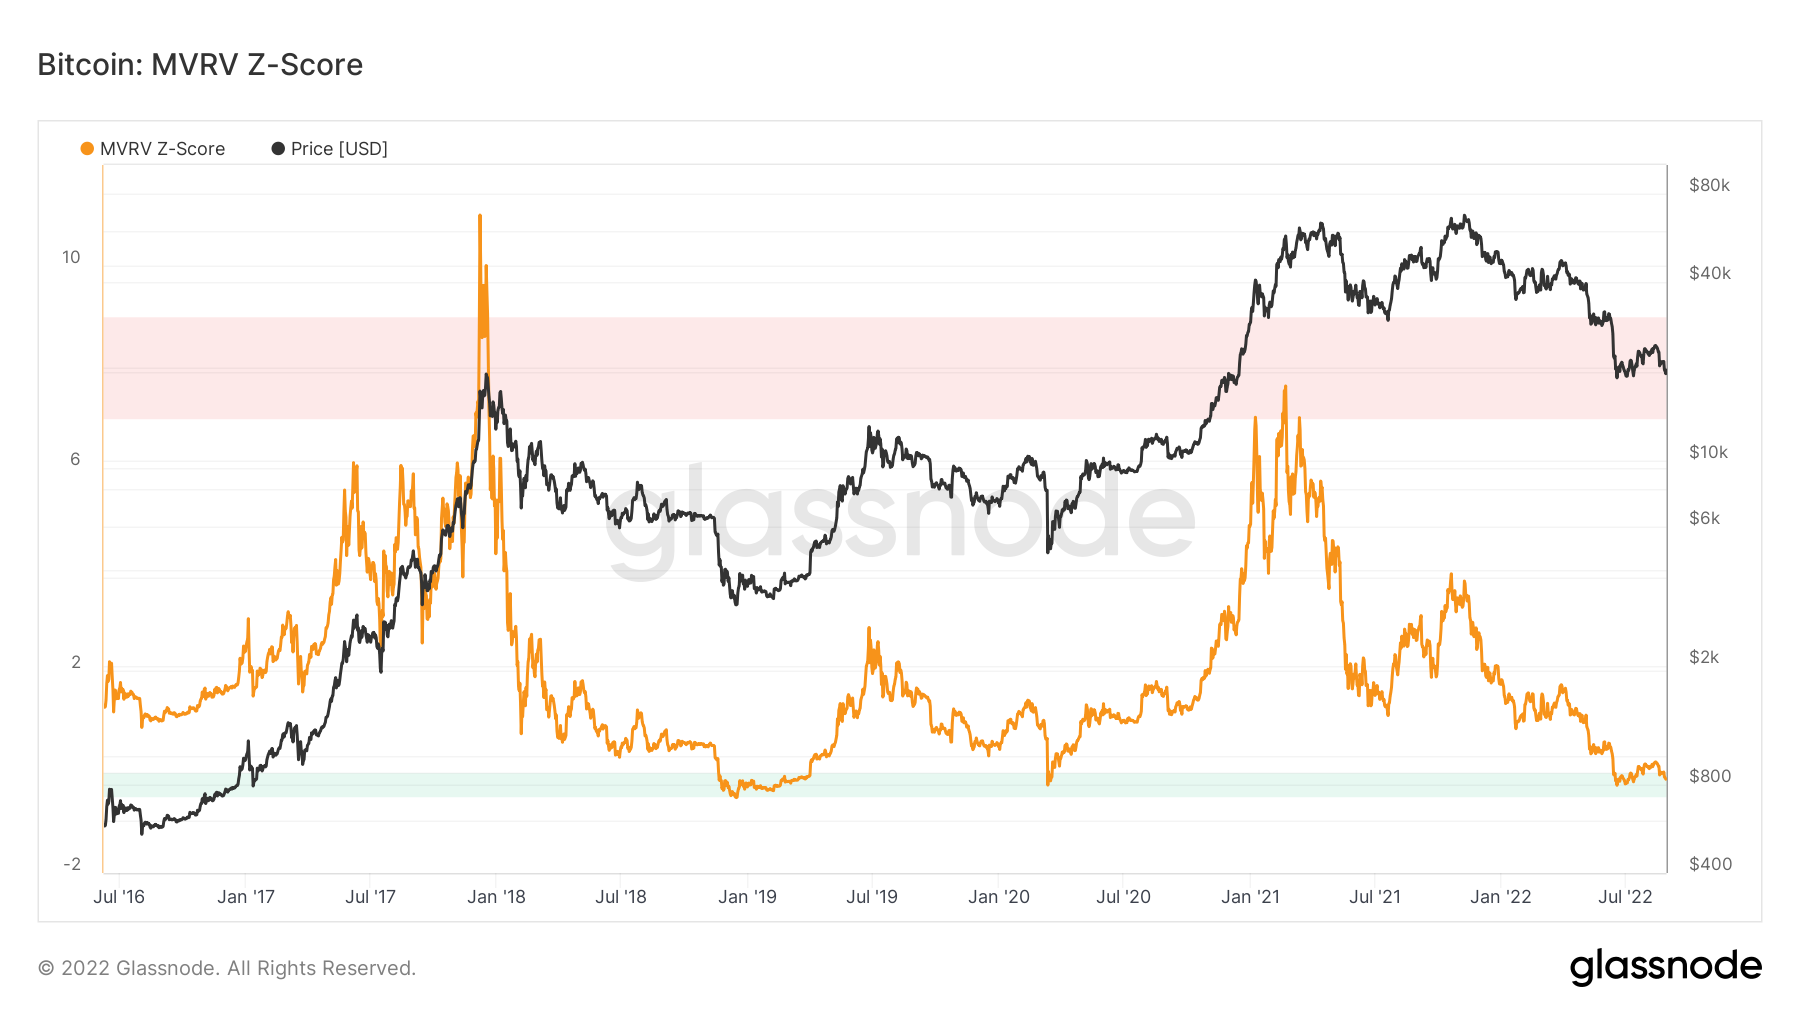
The MVRV Z-Score is one of the best metrics for assessing when the Bitcoin market is over or undervalued relative to its ‘fair value’. Historically, the green zone has been one of the best times to buy Bitcoin. The MVRV Z-Score is now again showing that it is in the green buy zone. However, it should be noted that in late 2018, when this metric first entered the green buy zone, the BTC price was $4,800. This metric eventually saw a touch of the bottom of the green buy zone, which was a price point of $3,200, so, it is still possible to see a significant retrace after entering this zone.
Metric 3 – MVRV Z-Score
The MVRV Z-Score is one of the best metrics for assessing when the Bitcoin market is over or undervalued relative to its ‘fair value’. Historically, the green zone has been one of the best times to buy Bitcoin. The MVRV Z-Score is now again showing that it is in the green buy zone. However, it should be noted that in late 2018, when this metric first entered the green buy zone, the BTC price was $4,800. This metric eventually saw a touch of the bottom of the green buy zone, which was a price point of $3,200, so, it is still possible to see a significant retrace after entering this zone.
Bitcoin – MVRV Z-Score
 Metric 4 – Realised Price by Address
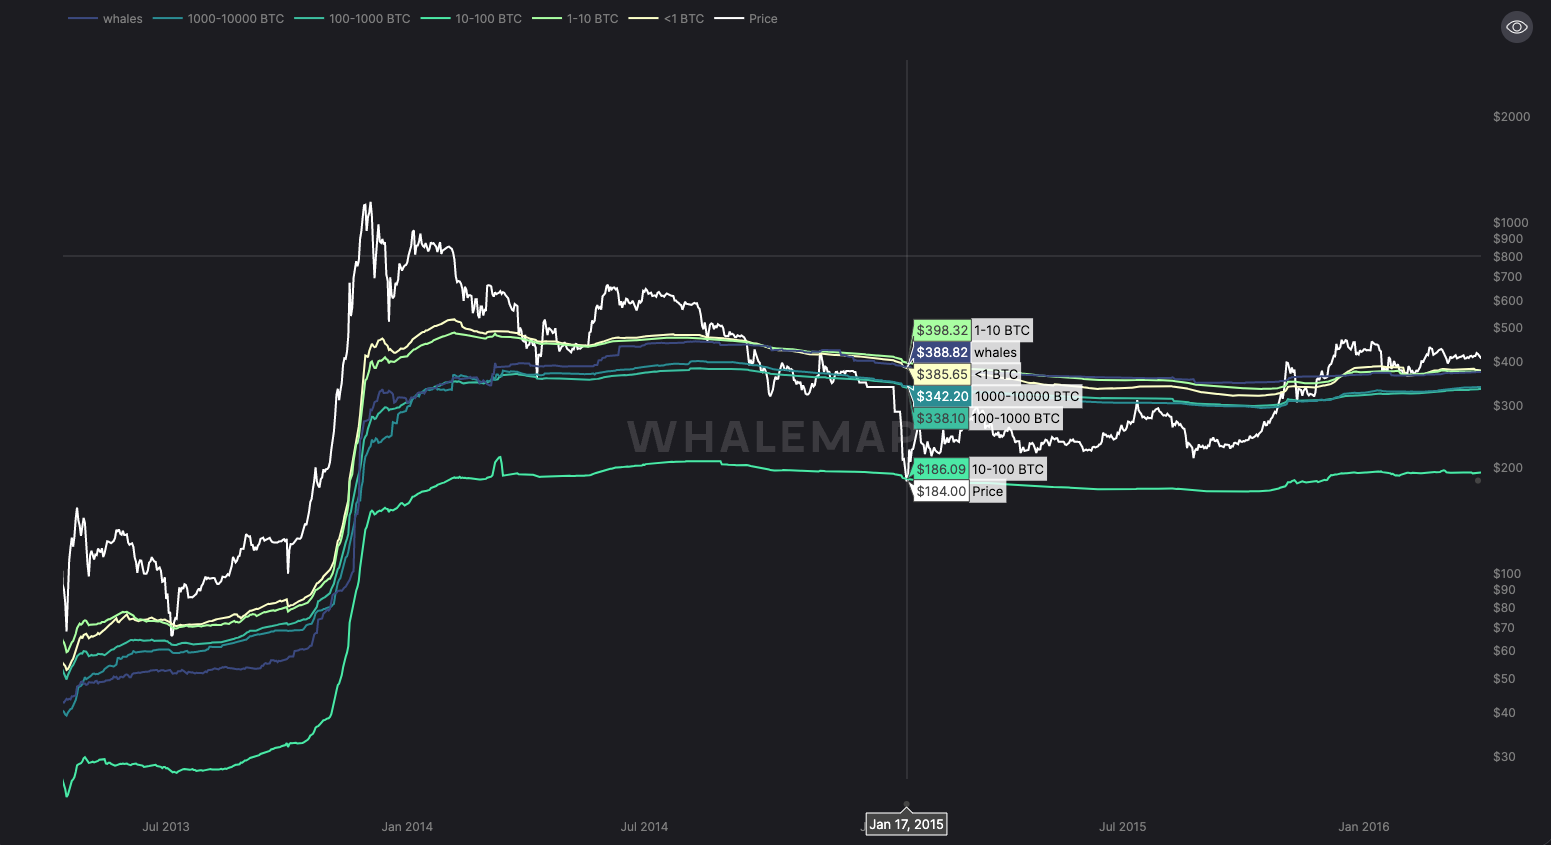
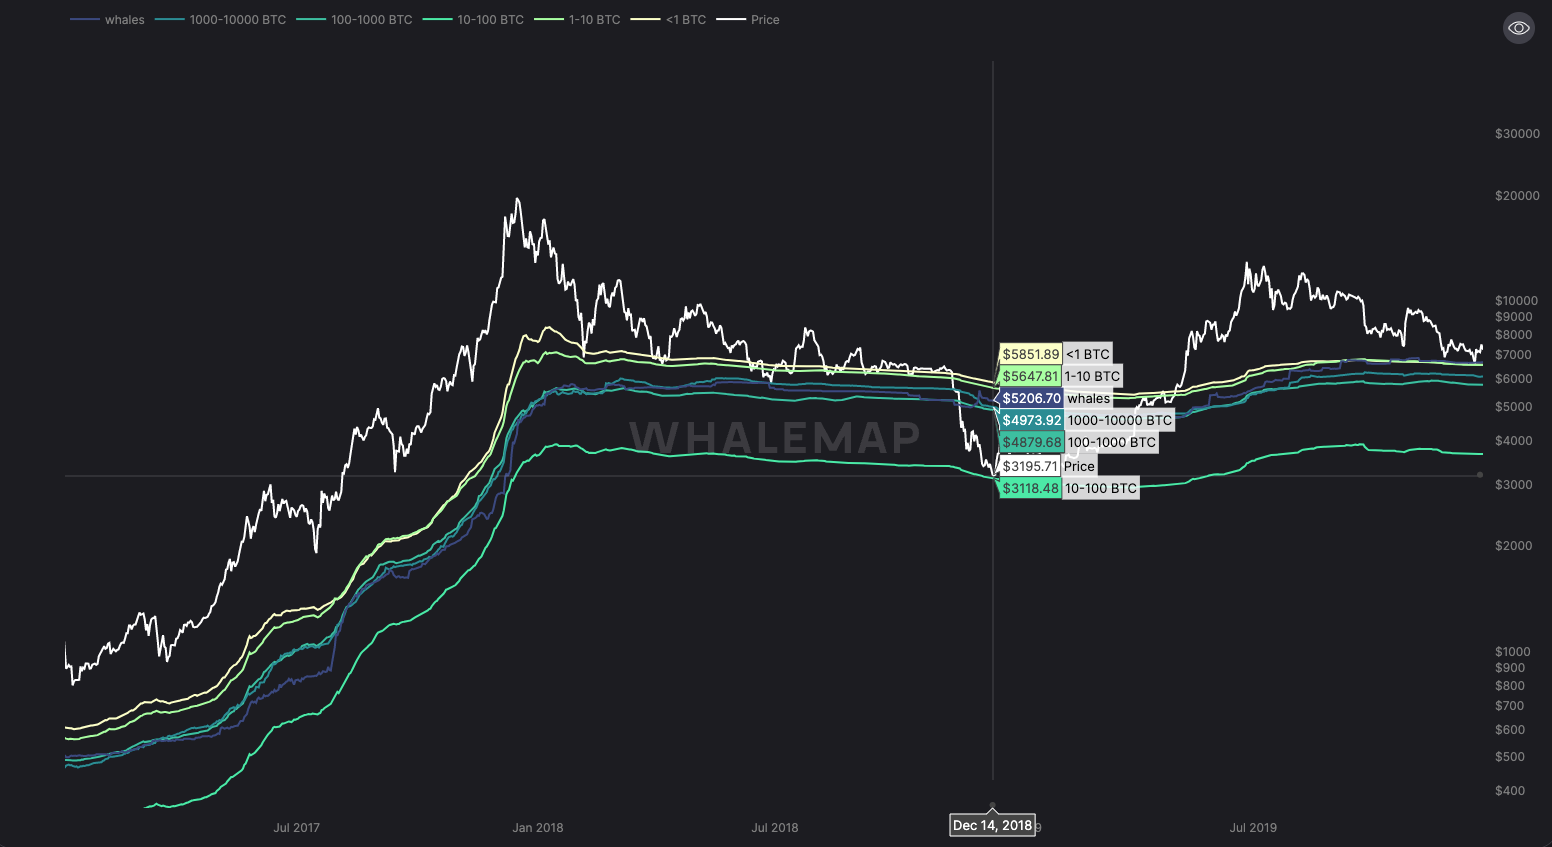
The Realised Price by Address is perhaps one of the best on-chain indicators available to us. It has historically identified market bottoms and therefore helped to predict future market bottoms. If we look at the 2014/2015 bear market and the 2018 bear market, we can see that the Realised Price of the address cohort 10-100 Bitcoin, was the strongest macro support.
Bitcoin – 2015 Realised Price by Address Bear Market Bottom
 Bitcoin – 2018 Realised Price by Address Bear Market Bottom
 We can see in both the above examples that the 10-100 BTC Realised Price was strong support. This is what the 2022 chart is now looking like.
Bitcoin – 2022 Realised Price by Address Bear Market Bottom
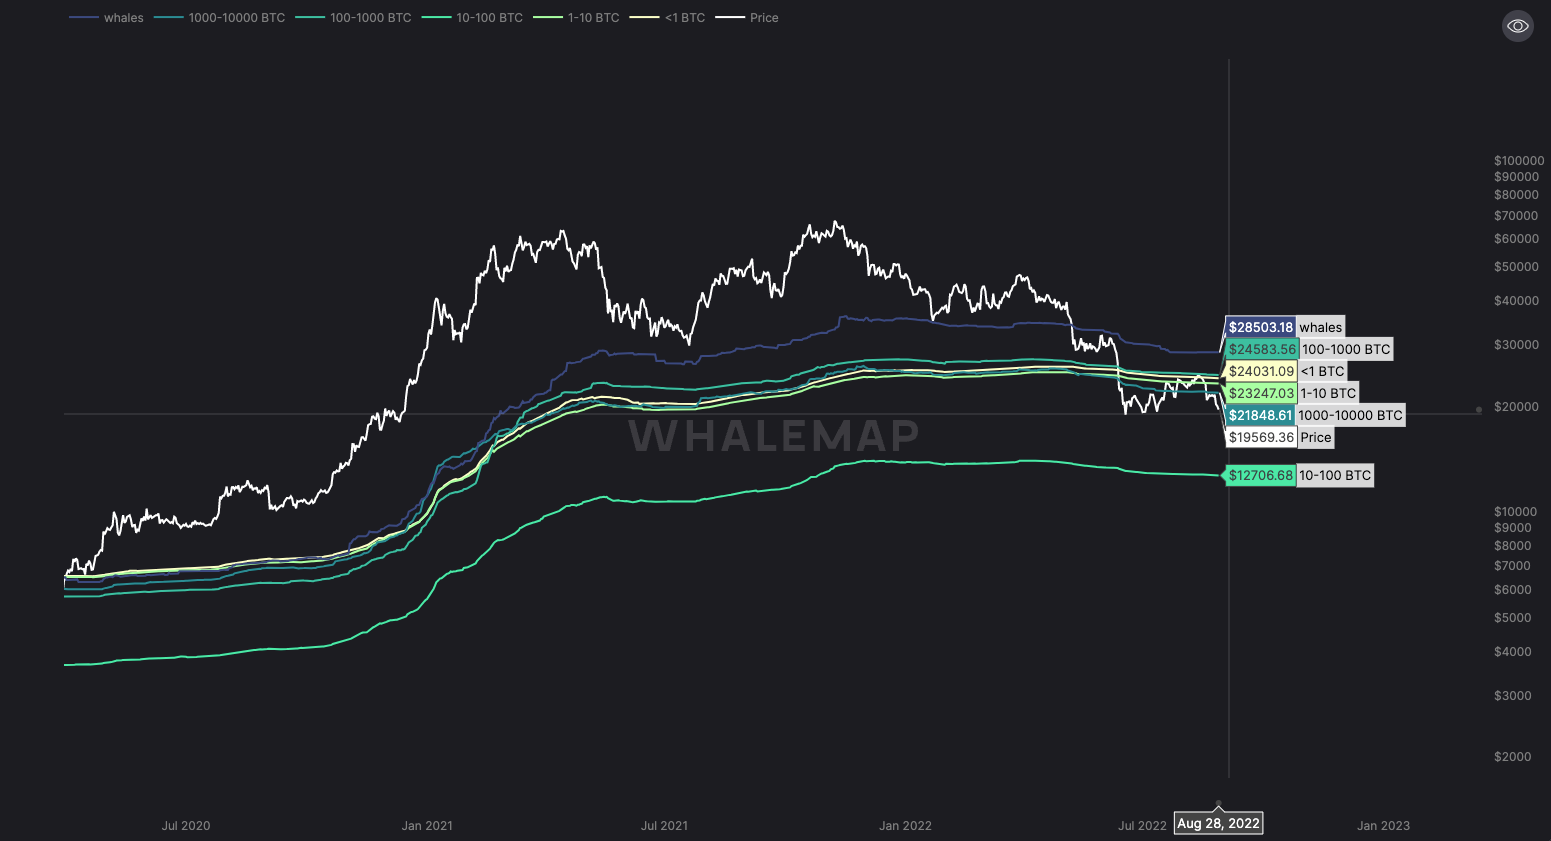
If the past were to repeat itself, then $12,700 may be the target area for a potential bottom, however, that is a 40% decline from current levels. Either way, it is a difficult call to make but this is a metric that has proven itself in the past and one that we should continue to watch.
S&P 500 Index
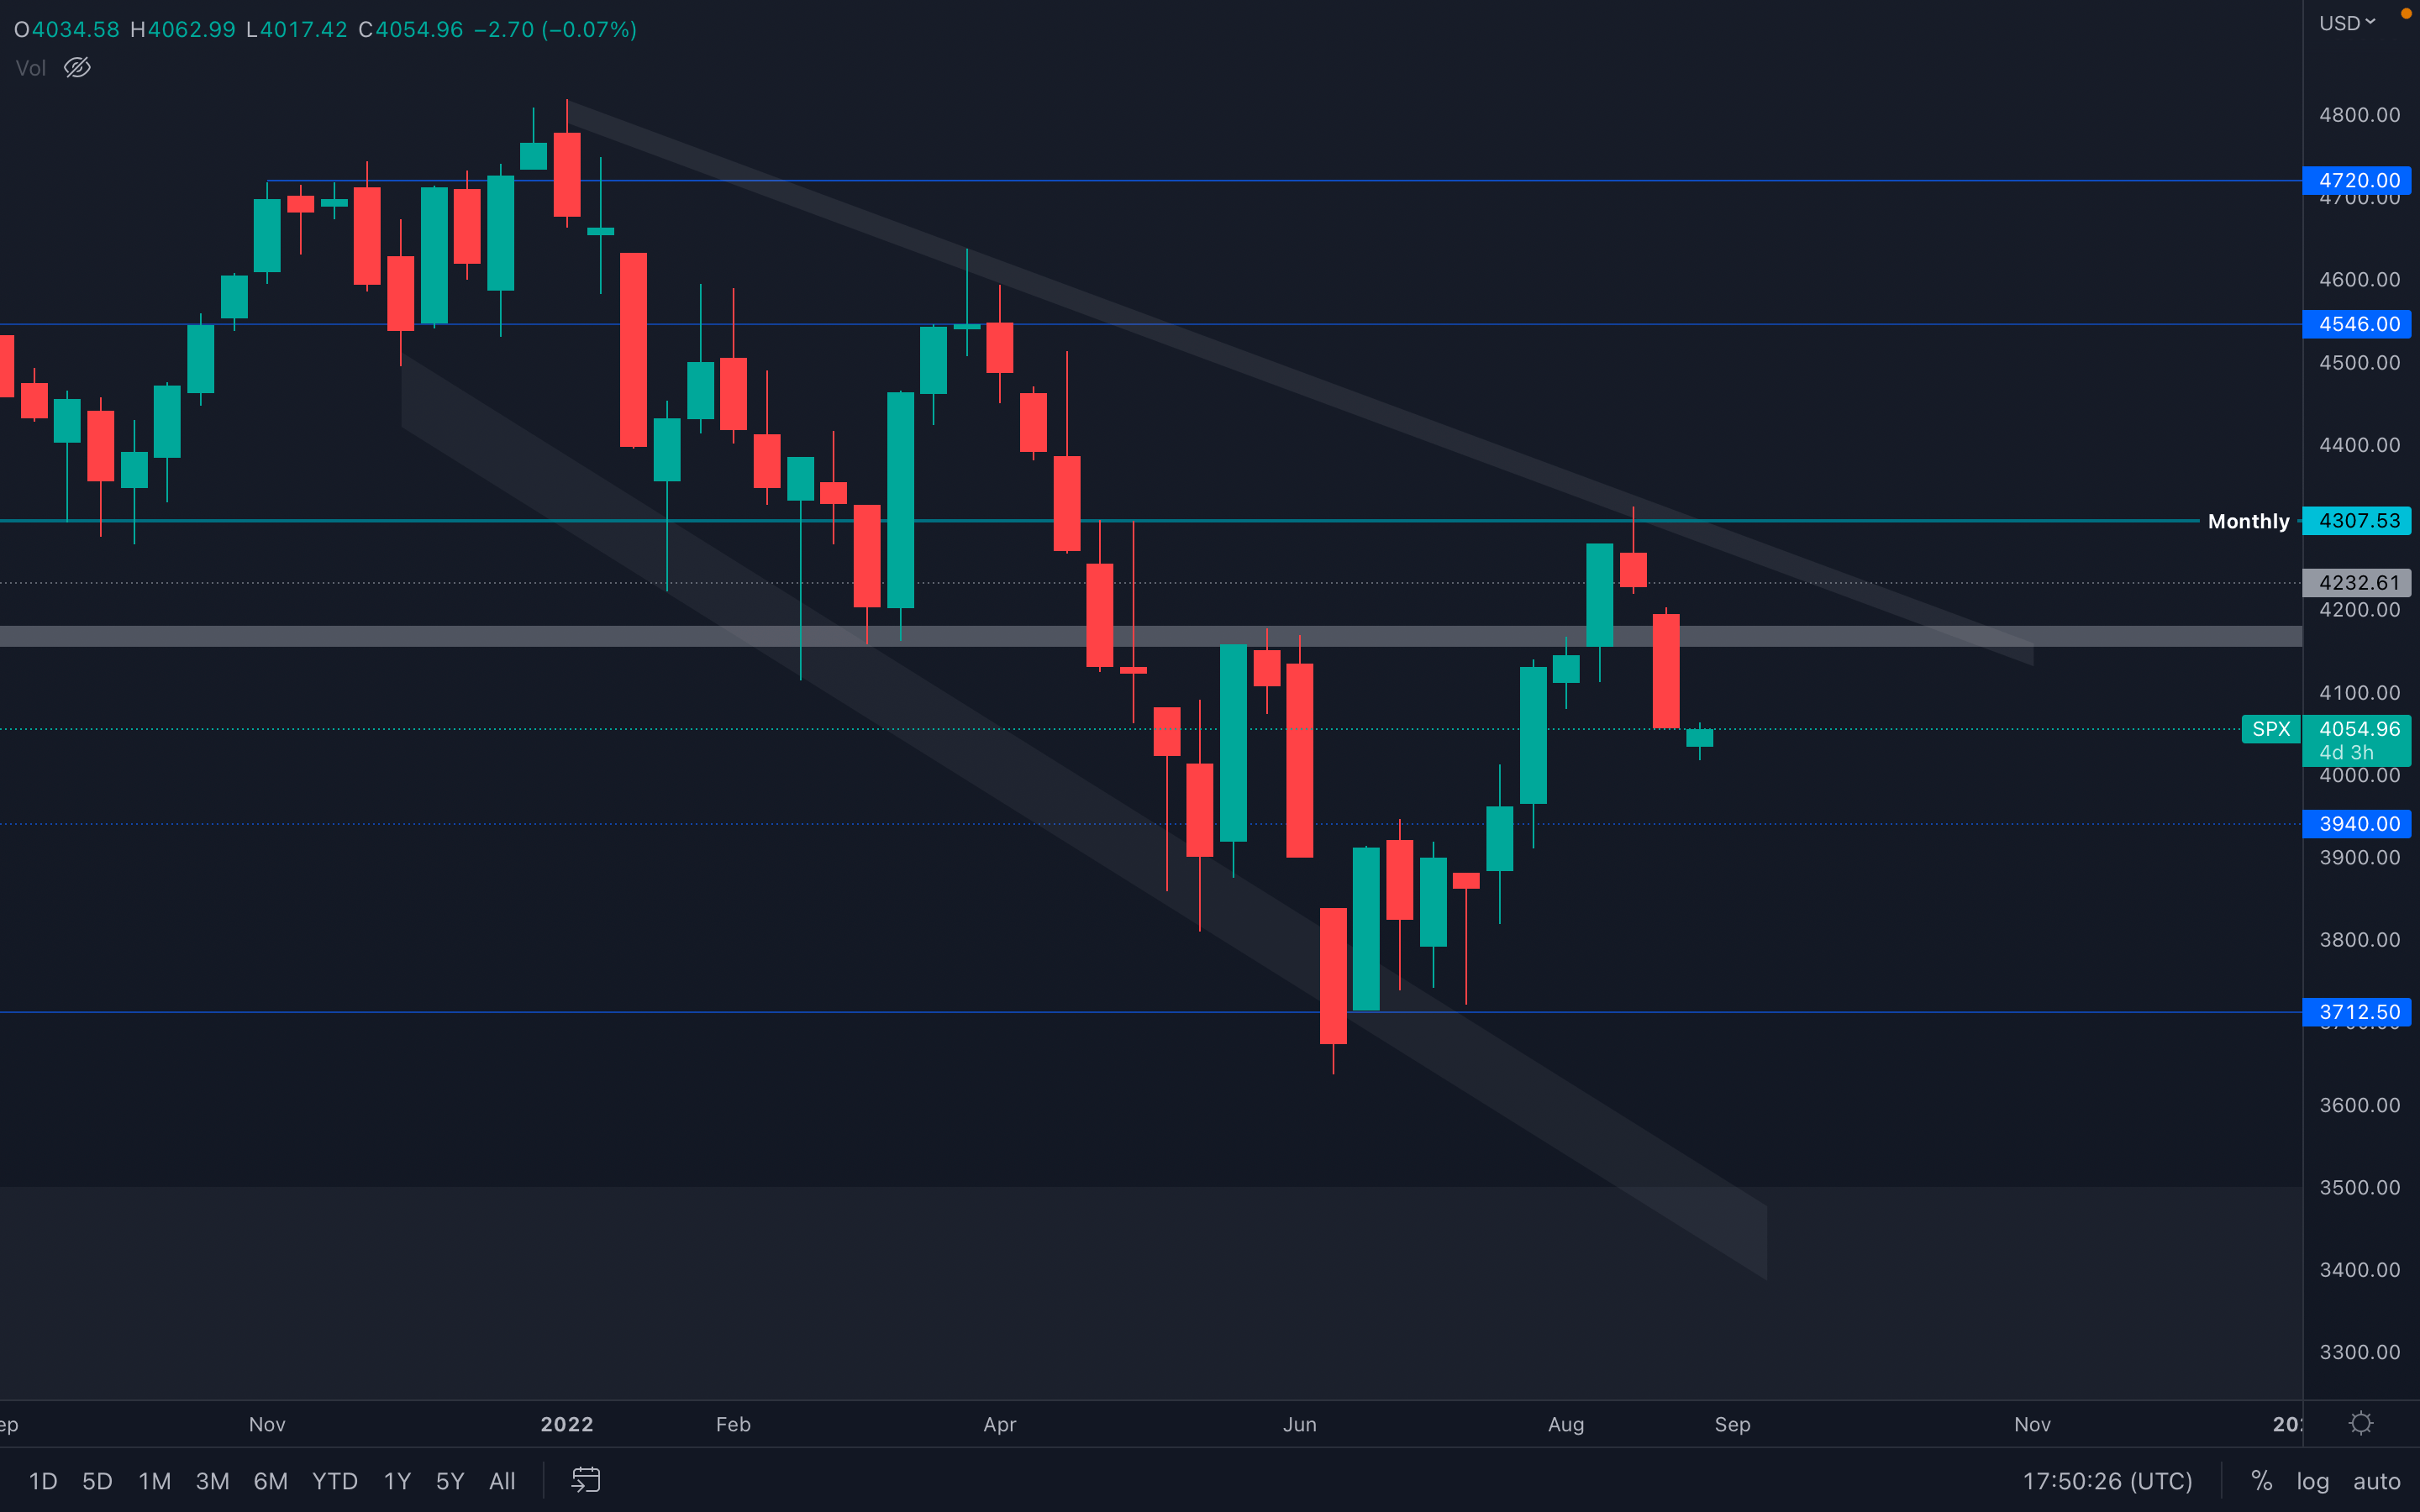 The S&P 500 Index hasn't shown any signs of strength as of yet - the $4200 level has been lost, and the overall trend remains bearish, which suggests a $3940 test is on the cards. This will negatively affect the crypto market, as we are aware that there's a strong correlation between the two.
Ether - Technical & On-Chain Analysis
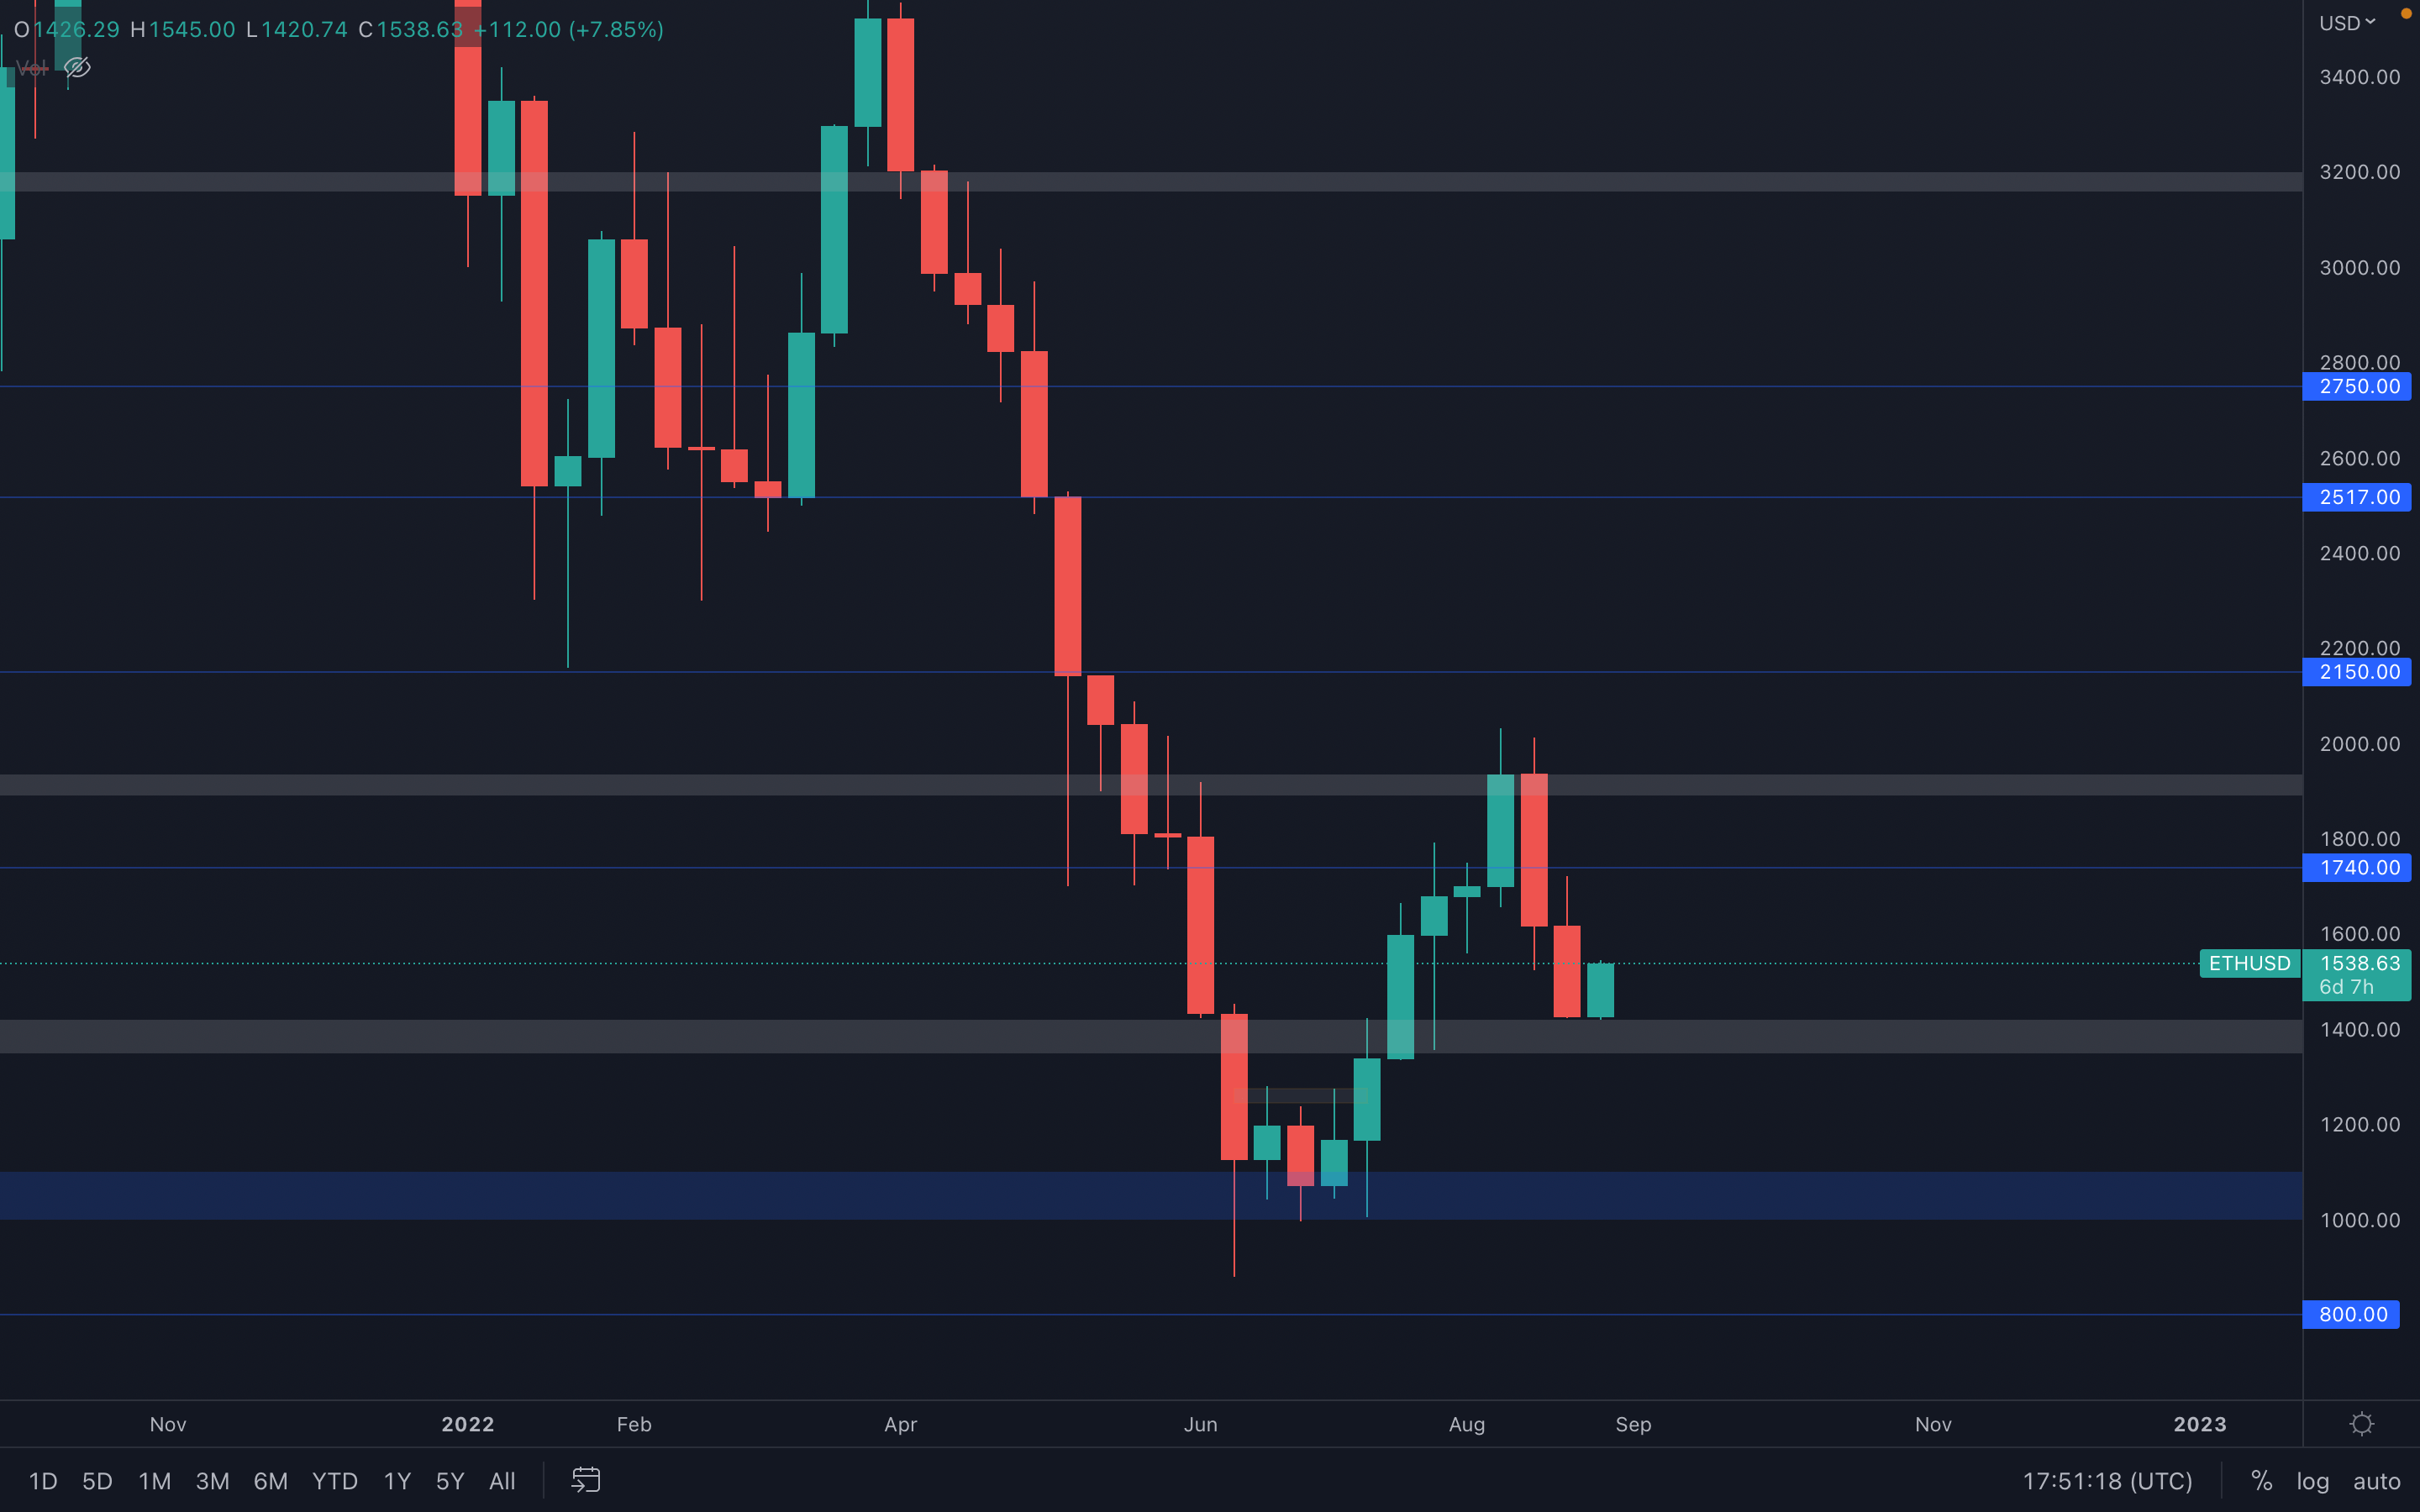
We stand by our opinion - candlesticks are the most powerful piece of data we could base our analysis on - and we've proven that multiple times, including in last week's report. After registering a bearish engulfing candle two weeks ago, ETH quickly came back down towards $1400 and closed right into support last week, which might imply a bit of uncertainty as there is still liquidity to be found at lower levels.
For now, Ether has printed a bullish engulfing candle on the daily timeframe, which suggests we could be seeing upside movements in the coming days. The daily bullish market structure has been altered, so bigger, more aggressive moves to the upside might get short lived due to a lack of buying pressure in the market.
Metric 1 – Addresses
If we now turn our attention to Ether, we can see that, the smallest cohorts of Ether wallets (by the amount of Ether that those wallet cohorts hold), have also turned down quite significantly – sold some of the Ether they were holding, rather than continuing to add like they have done over the past few years.
Ether – Addresses with Balance > 0.01 Ether
It is difficult to know what the above means for price action going forward. When analysing addresses, we try to emulate the historically most profitable cohorts and do the opposite of what the smallest wallet cohorts are doing. However, here the data is contrasting. We have the smallest wallets risking-off (selling down the amount of BTC and ETH that they own) yet the biggest wallets cohorts (the ones we try to emulate) are not de-risking or risking back-on again, they’re almost remaining inactive for the time being. Until there is significant risking back-on by the ‘Addresses with Balance > 1,000 Bitcoin’, it is worth remaining cautious before adding risk.
DOT
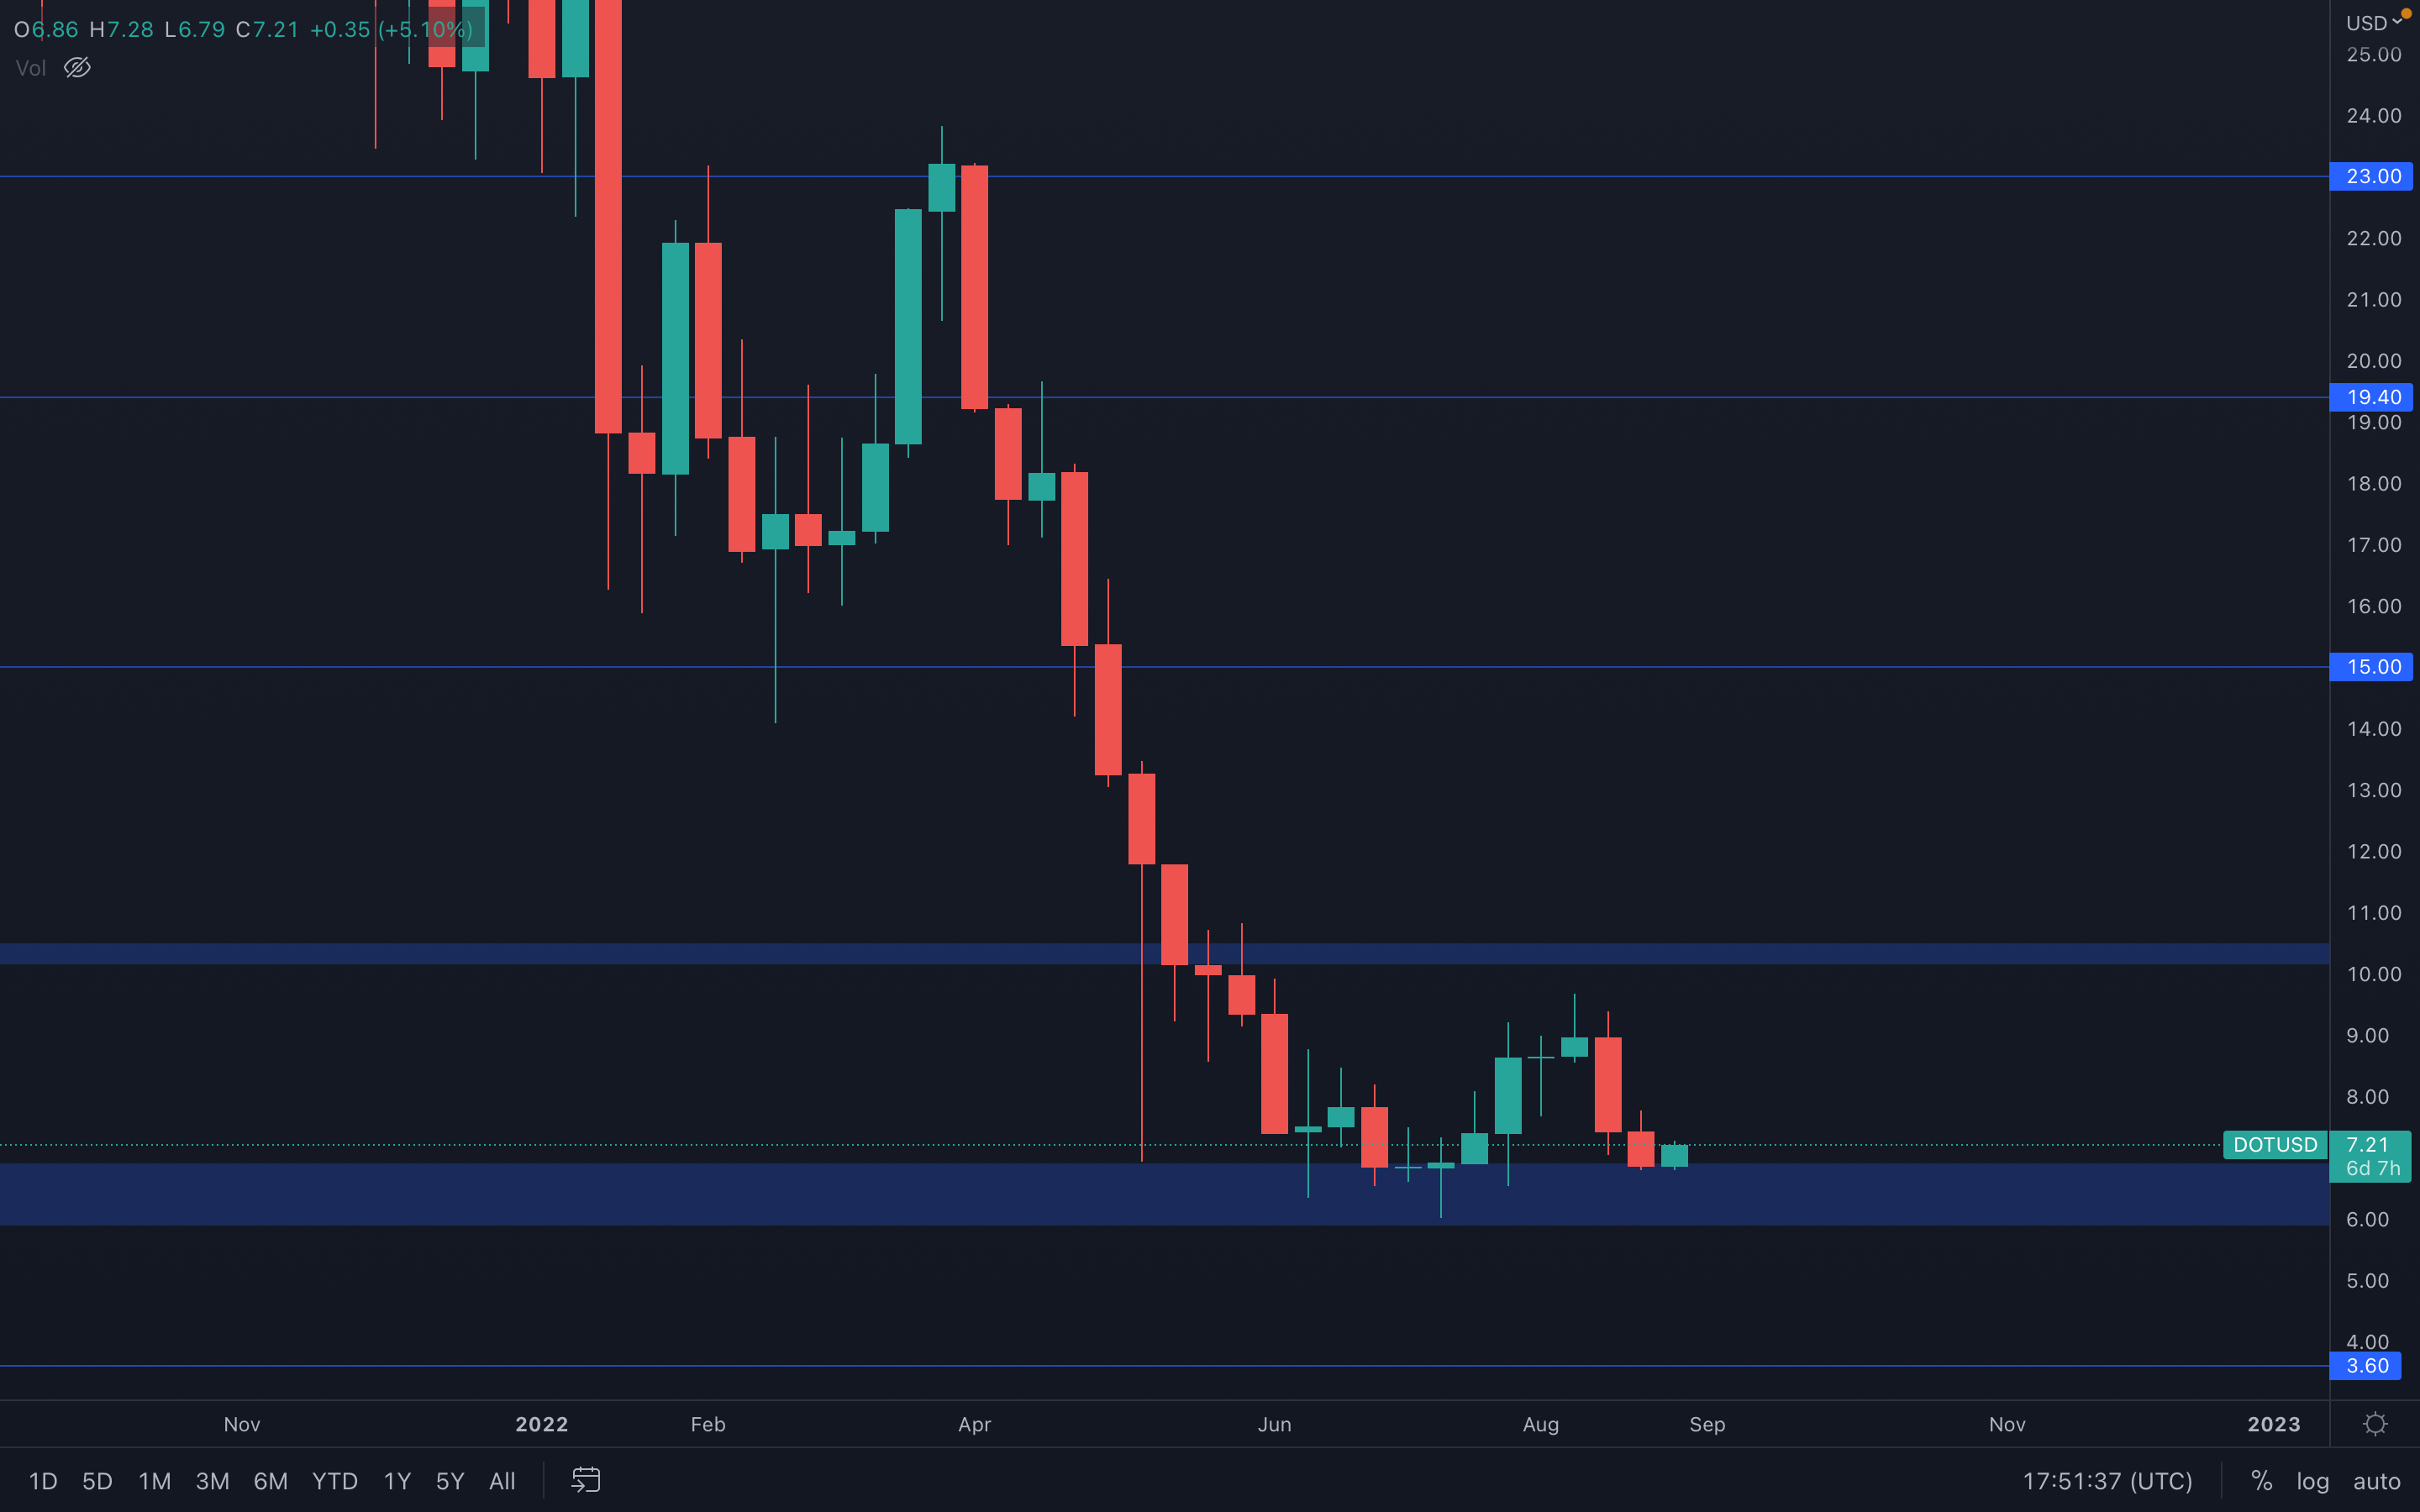 Smiliar price action as to that of RUNE & SOL (which can be found below) - DOT lacks volume and sellers are clearly still in control based on how the previous two weekly candles look like. Last week, DOT closed the week right into support, which might suggest we could see a bit of action from the buyers, especially after forming a bullish engulfing candle on the daily timeframe.
There is still a significant risk involved, and that is if DOT starts to drop and range inside the $6 - $7 support area. Any trades from DOT's current level should be treated as bets, as the price could easily descend, grab liquidity and fuel a move to the upside by closing out stop losses.
SNX
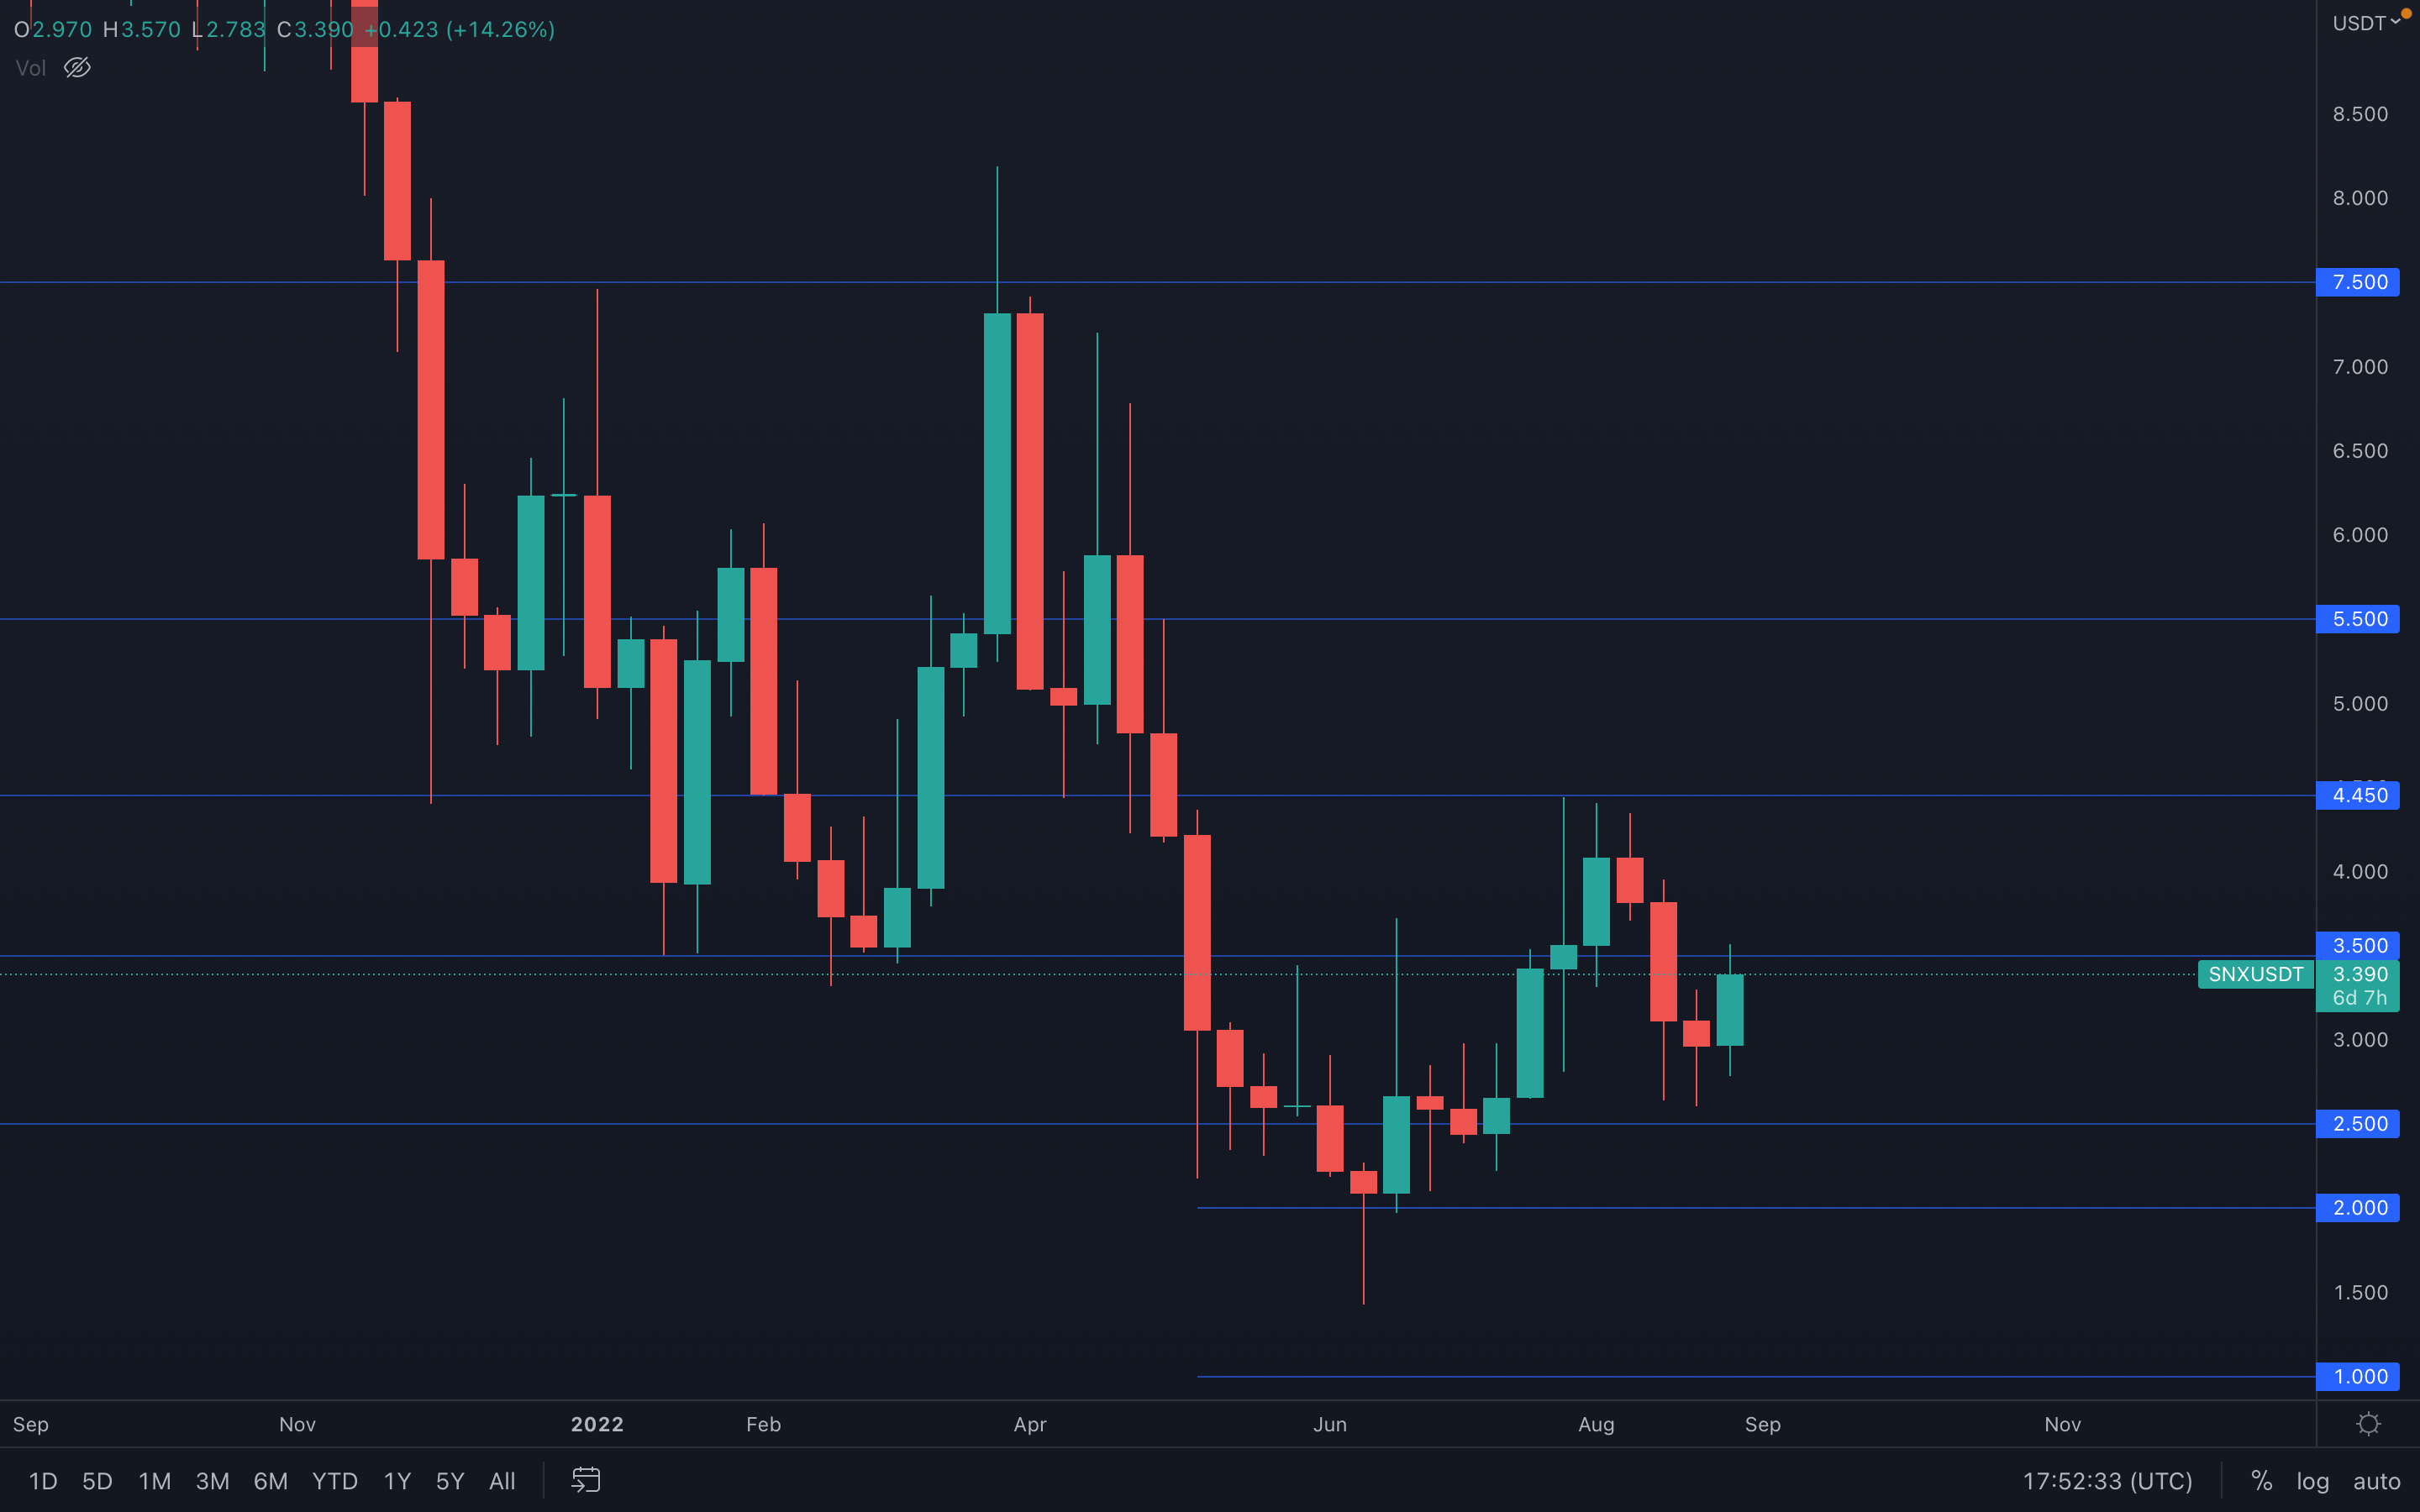 Extremely strong performance from SNX and the week is just getting started. SNX has risen over 20% in the last 24h and has managed to validate a double bottom pattern on the daily timeframe. Not only that, but there's also a potential weekly change in market structures, with the current candle forming a higher low at $3.
SNX is currently encountering resistance at $3.50, an important level which, if broken, will easily lead towards $4.45 and above.
RUNE
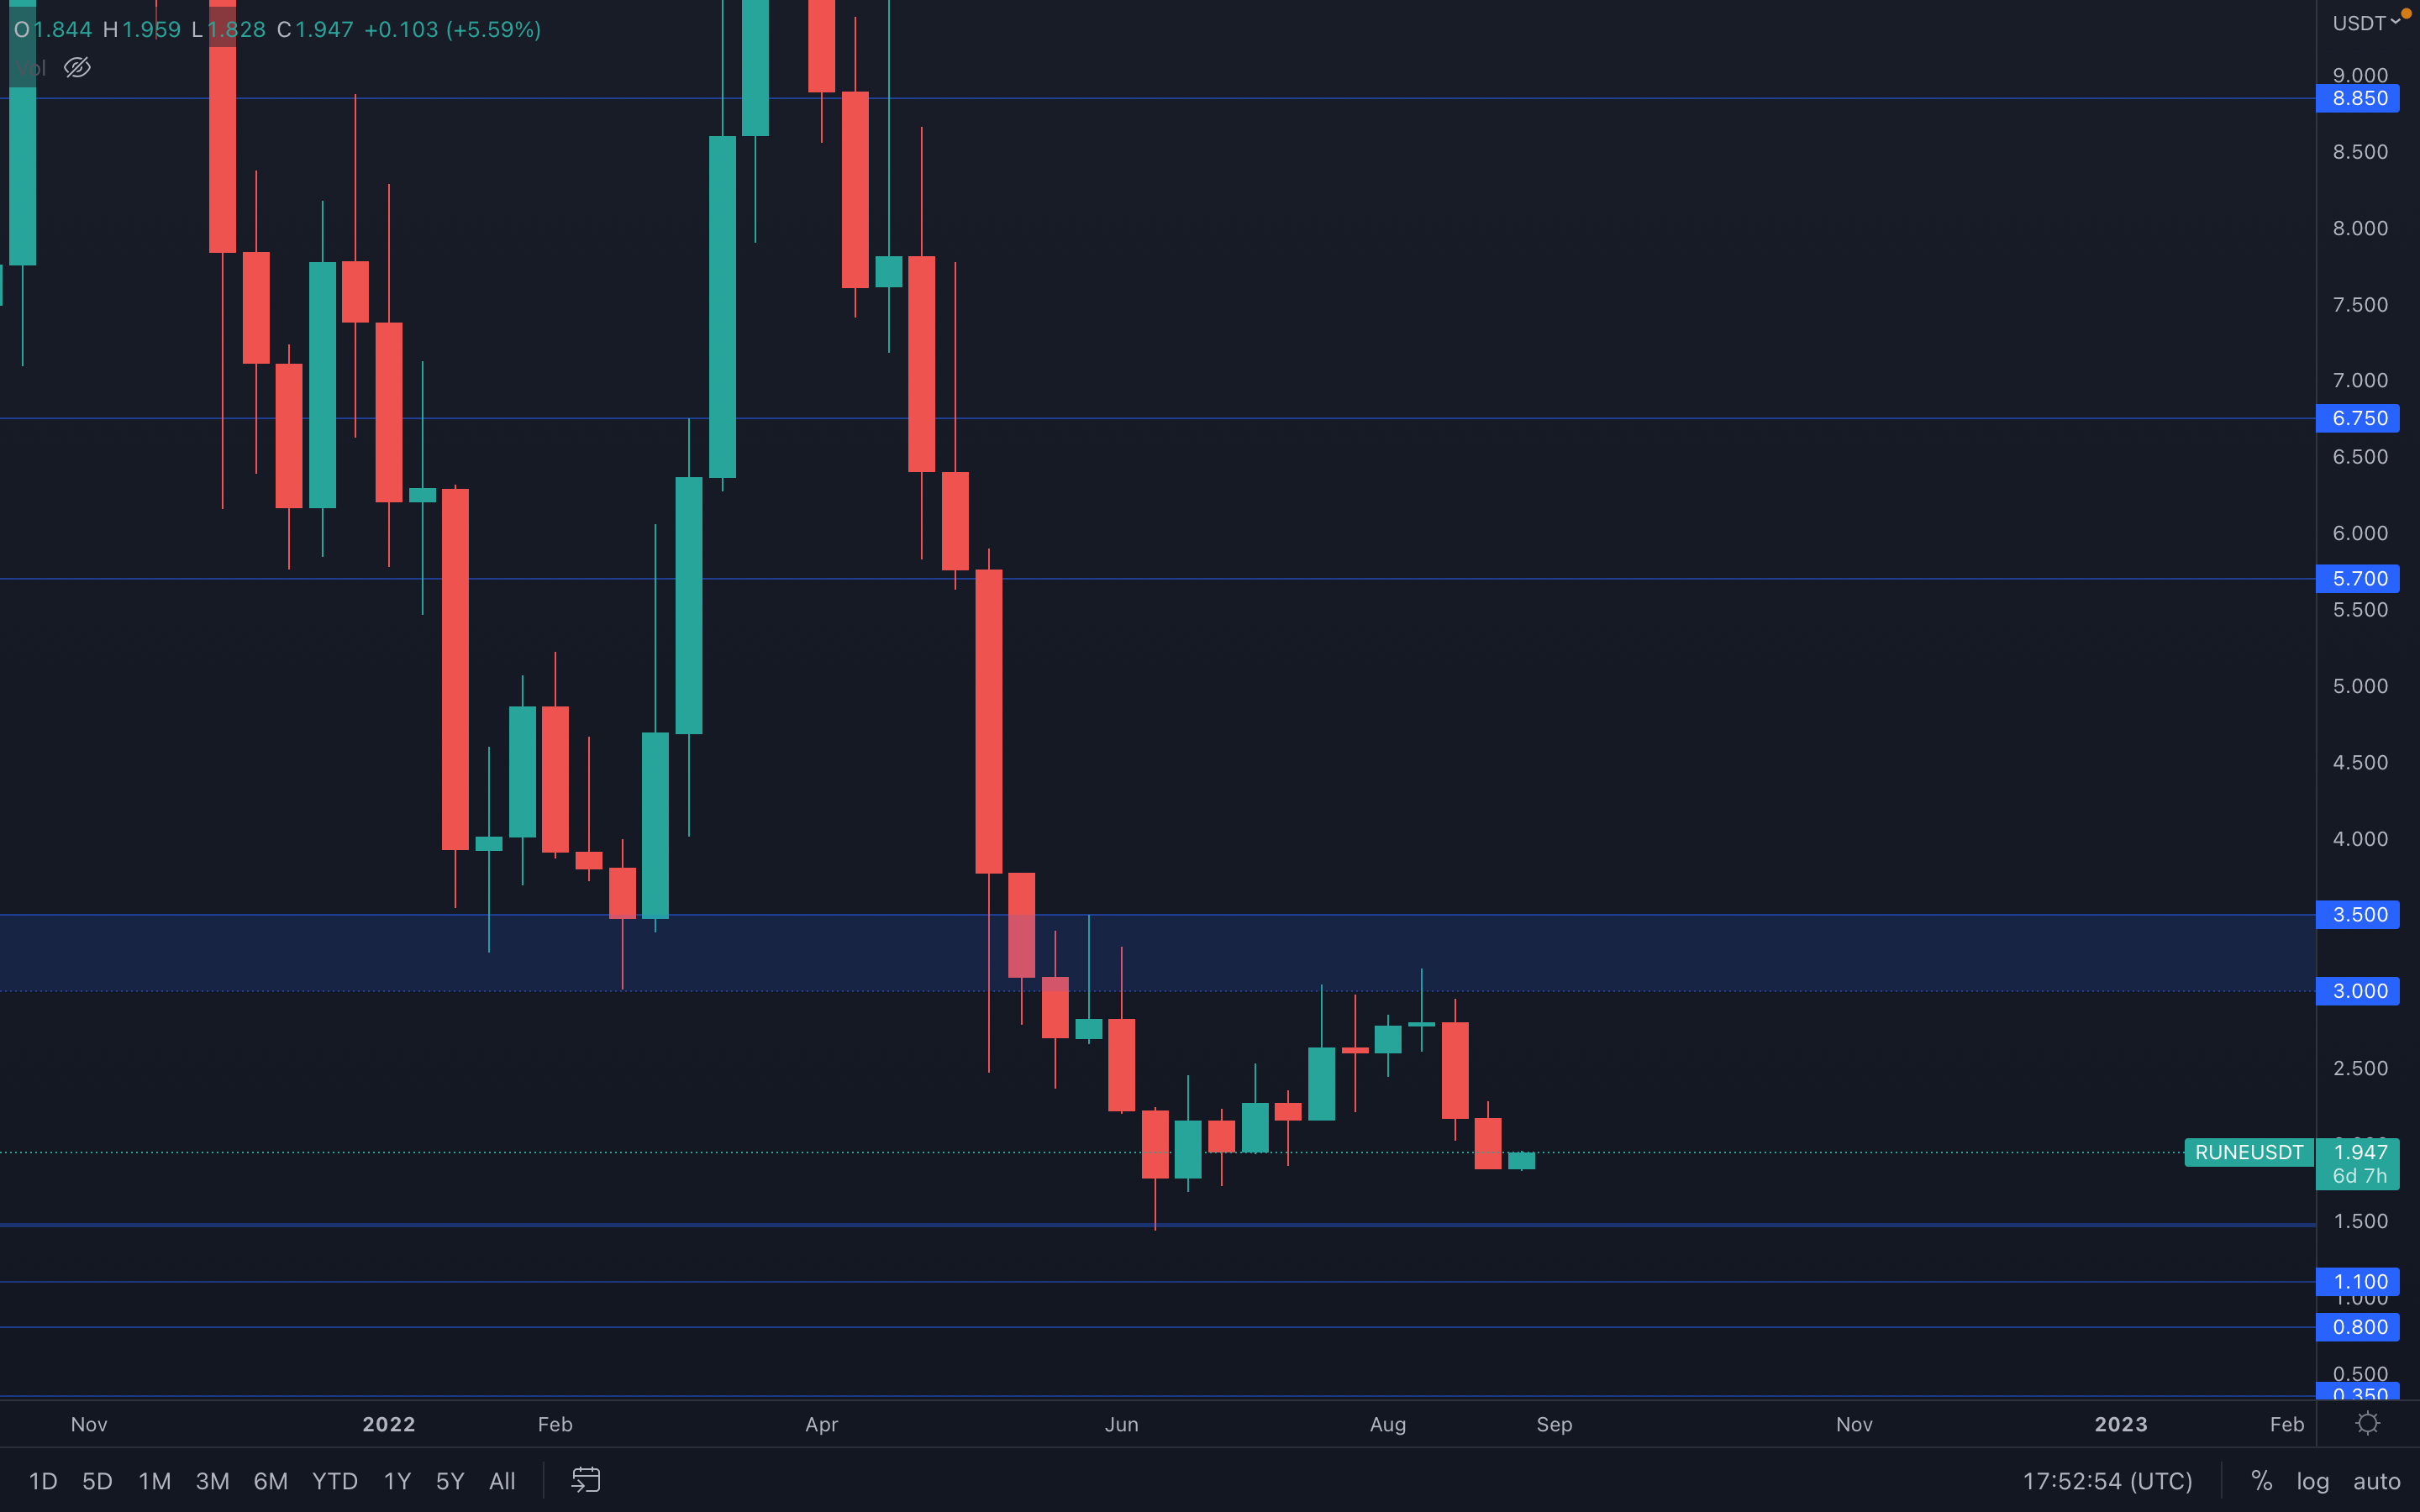 RUNE's price action was obviously influenced by the majors, which brought the price at June lows once again. Similar to most assets in this week's report, a bullish engulfing candle has formed on the daily timeframe, which suggests buyers will most likely regain control and push prices higher - how higher remains to be seen.
SOL
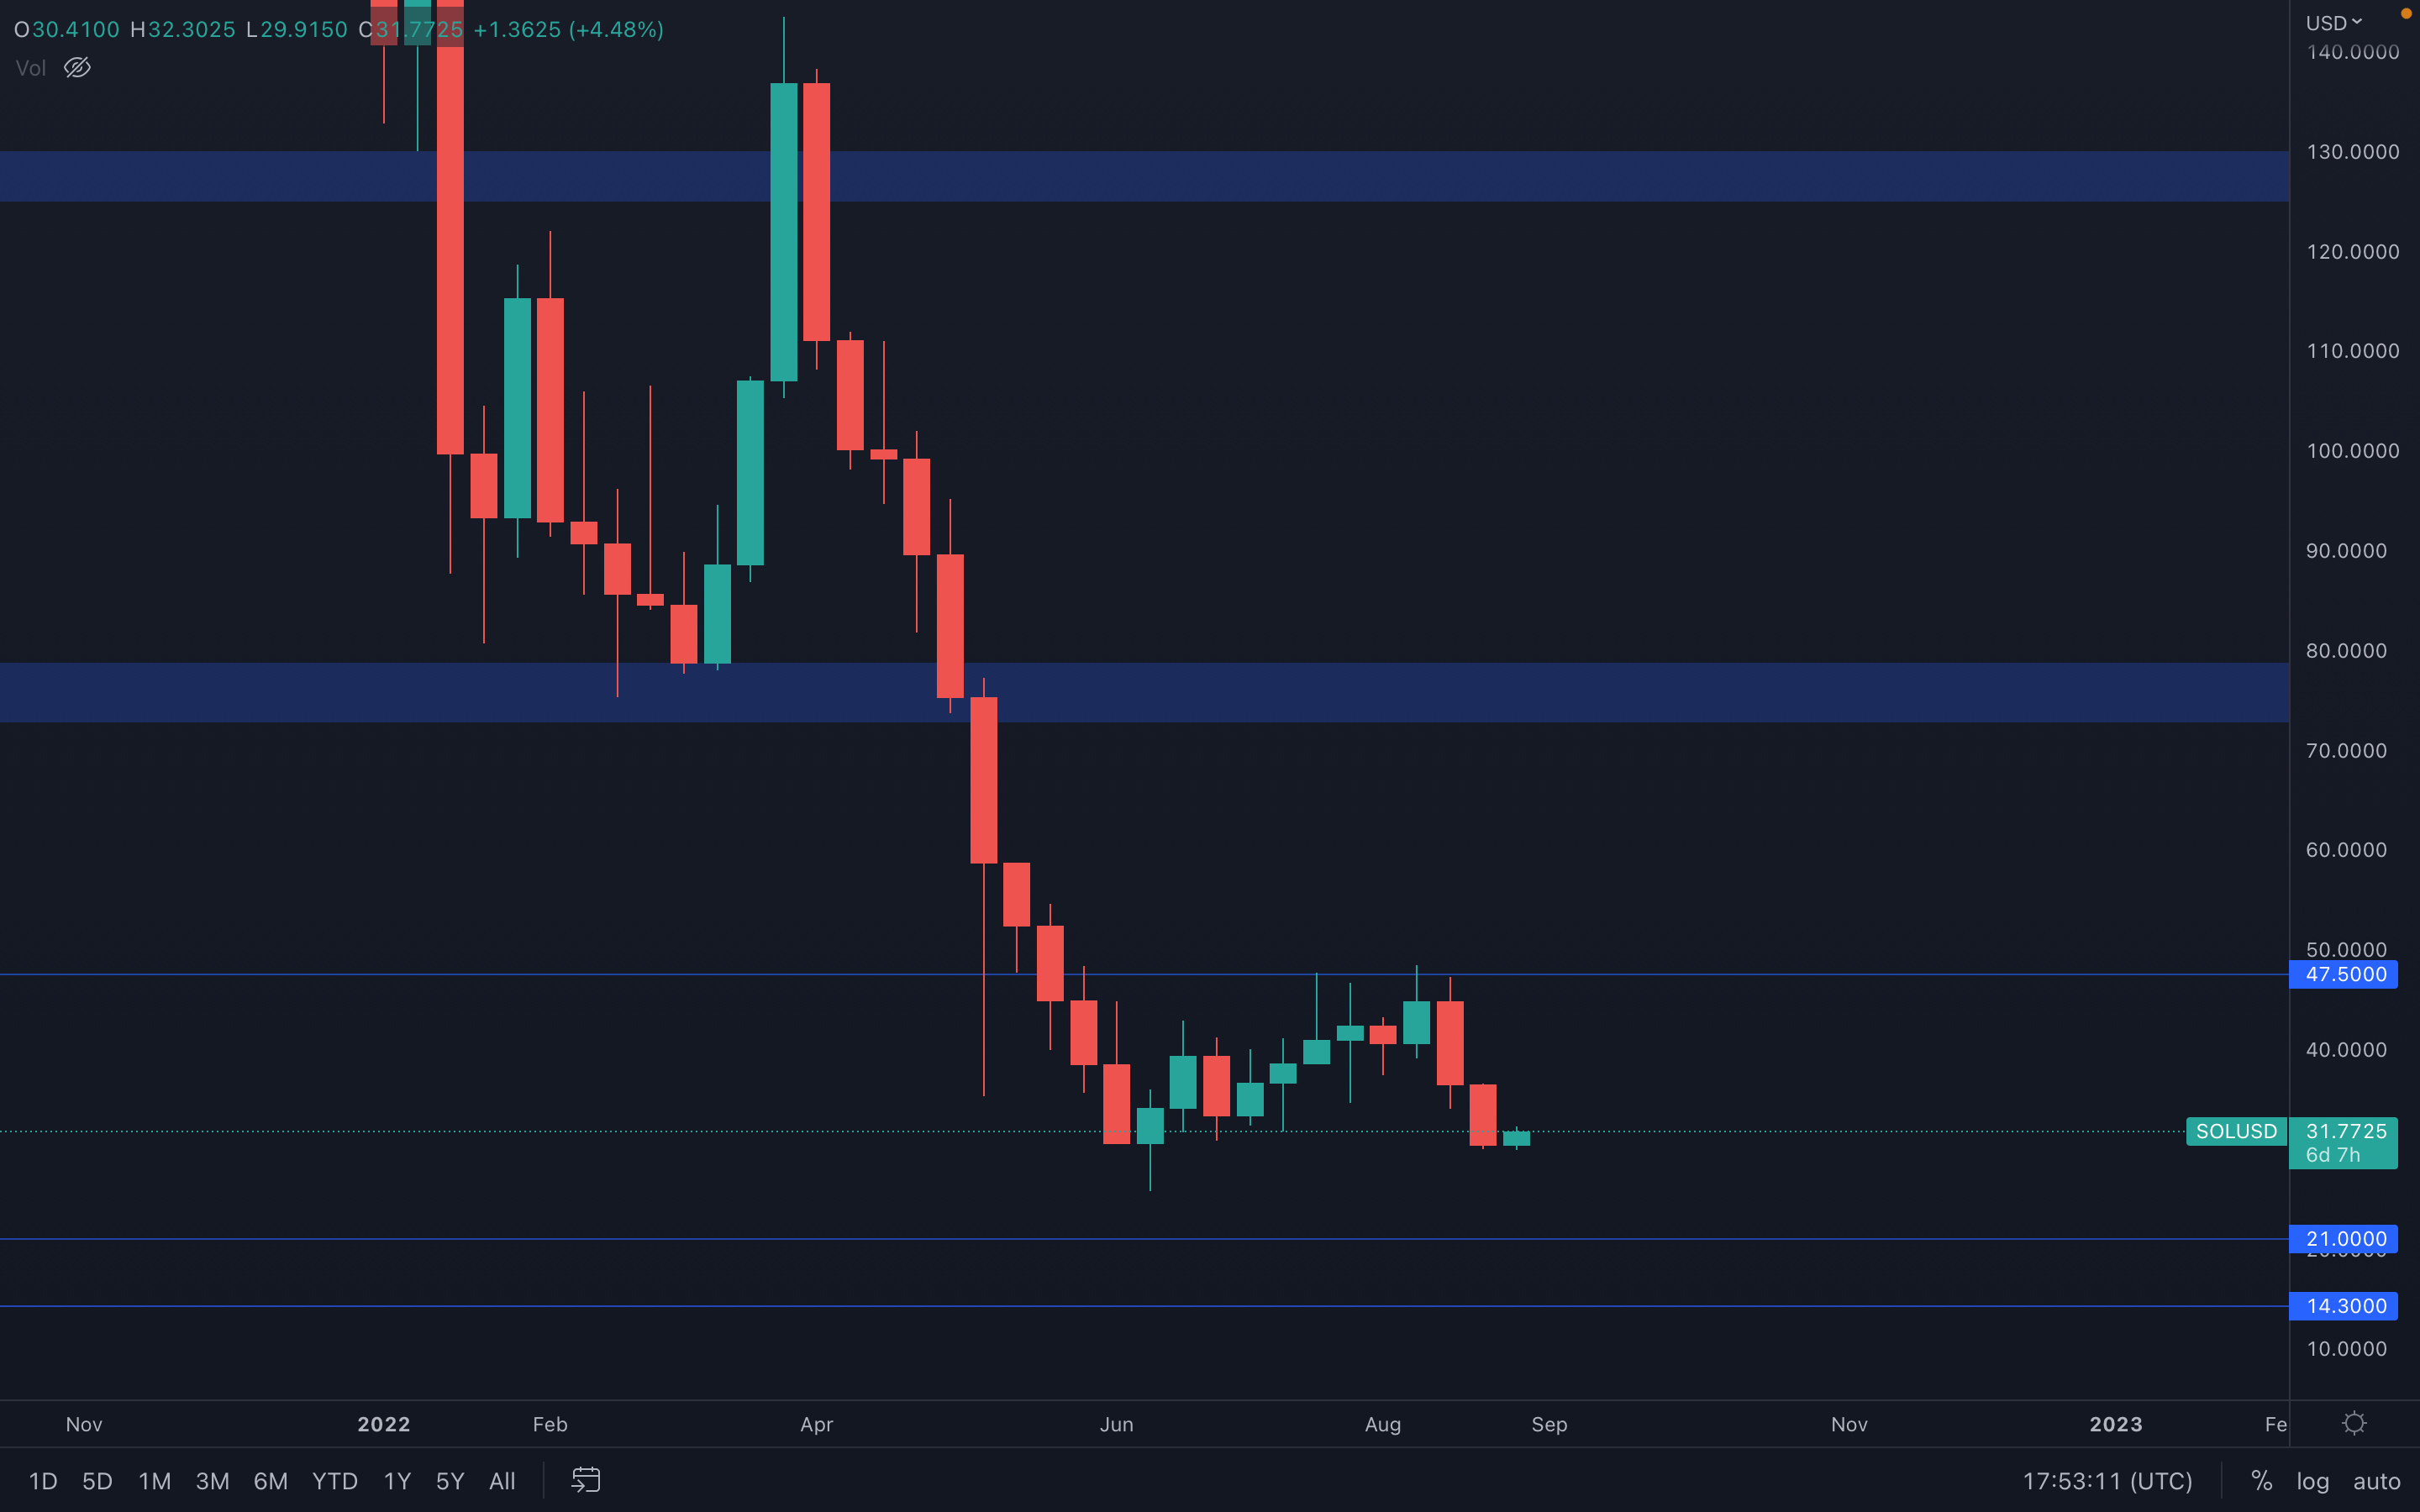 SOL quickly dropped back to $30 (a scenario we made sure to mention in previous reports) after being unable to break above $47.50 in multiple attempts. Last week closed even lower than the previous low registered back in June, something to keep in mind when diving into SOL in the coming weeks. As of now, sellers have managed to remain in control and unless $47.50 is broken, then no further upside can occur - expect SOL to range between $30 and $47.50 until either of these levels are broken
SRM
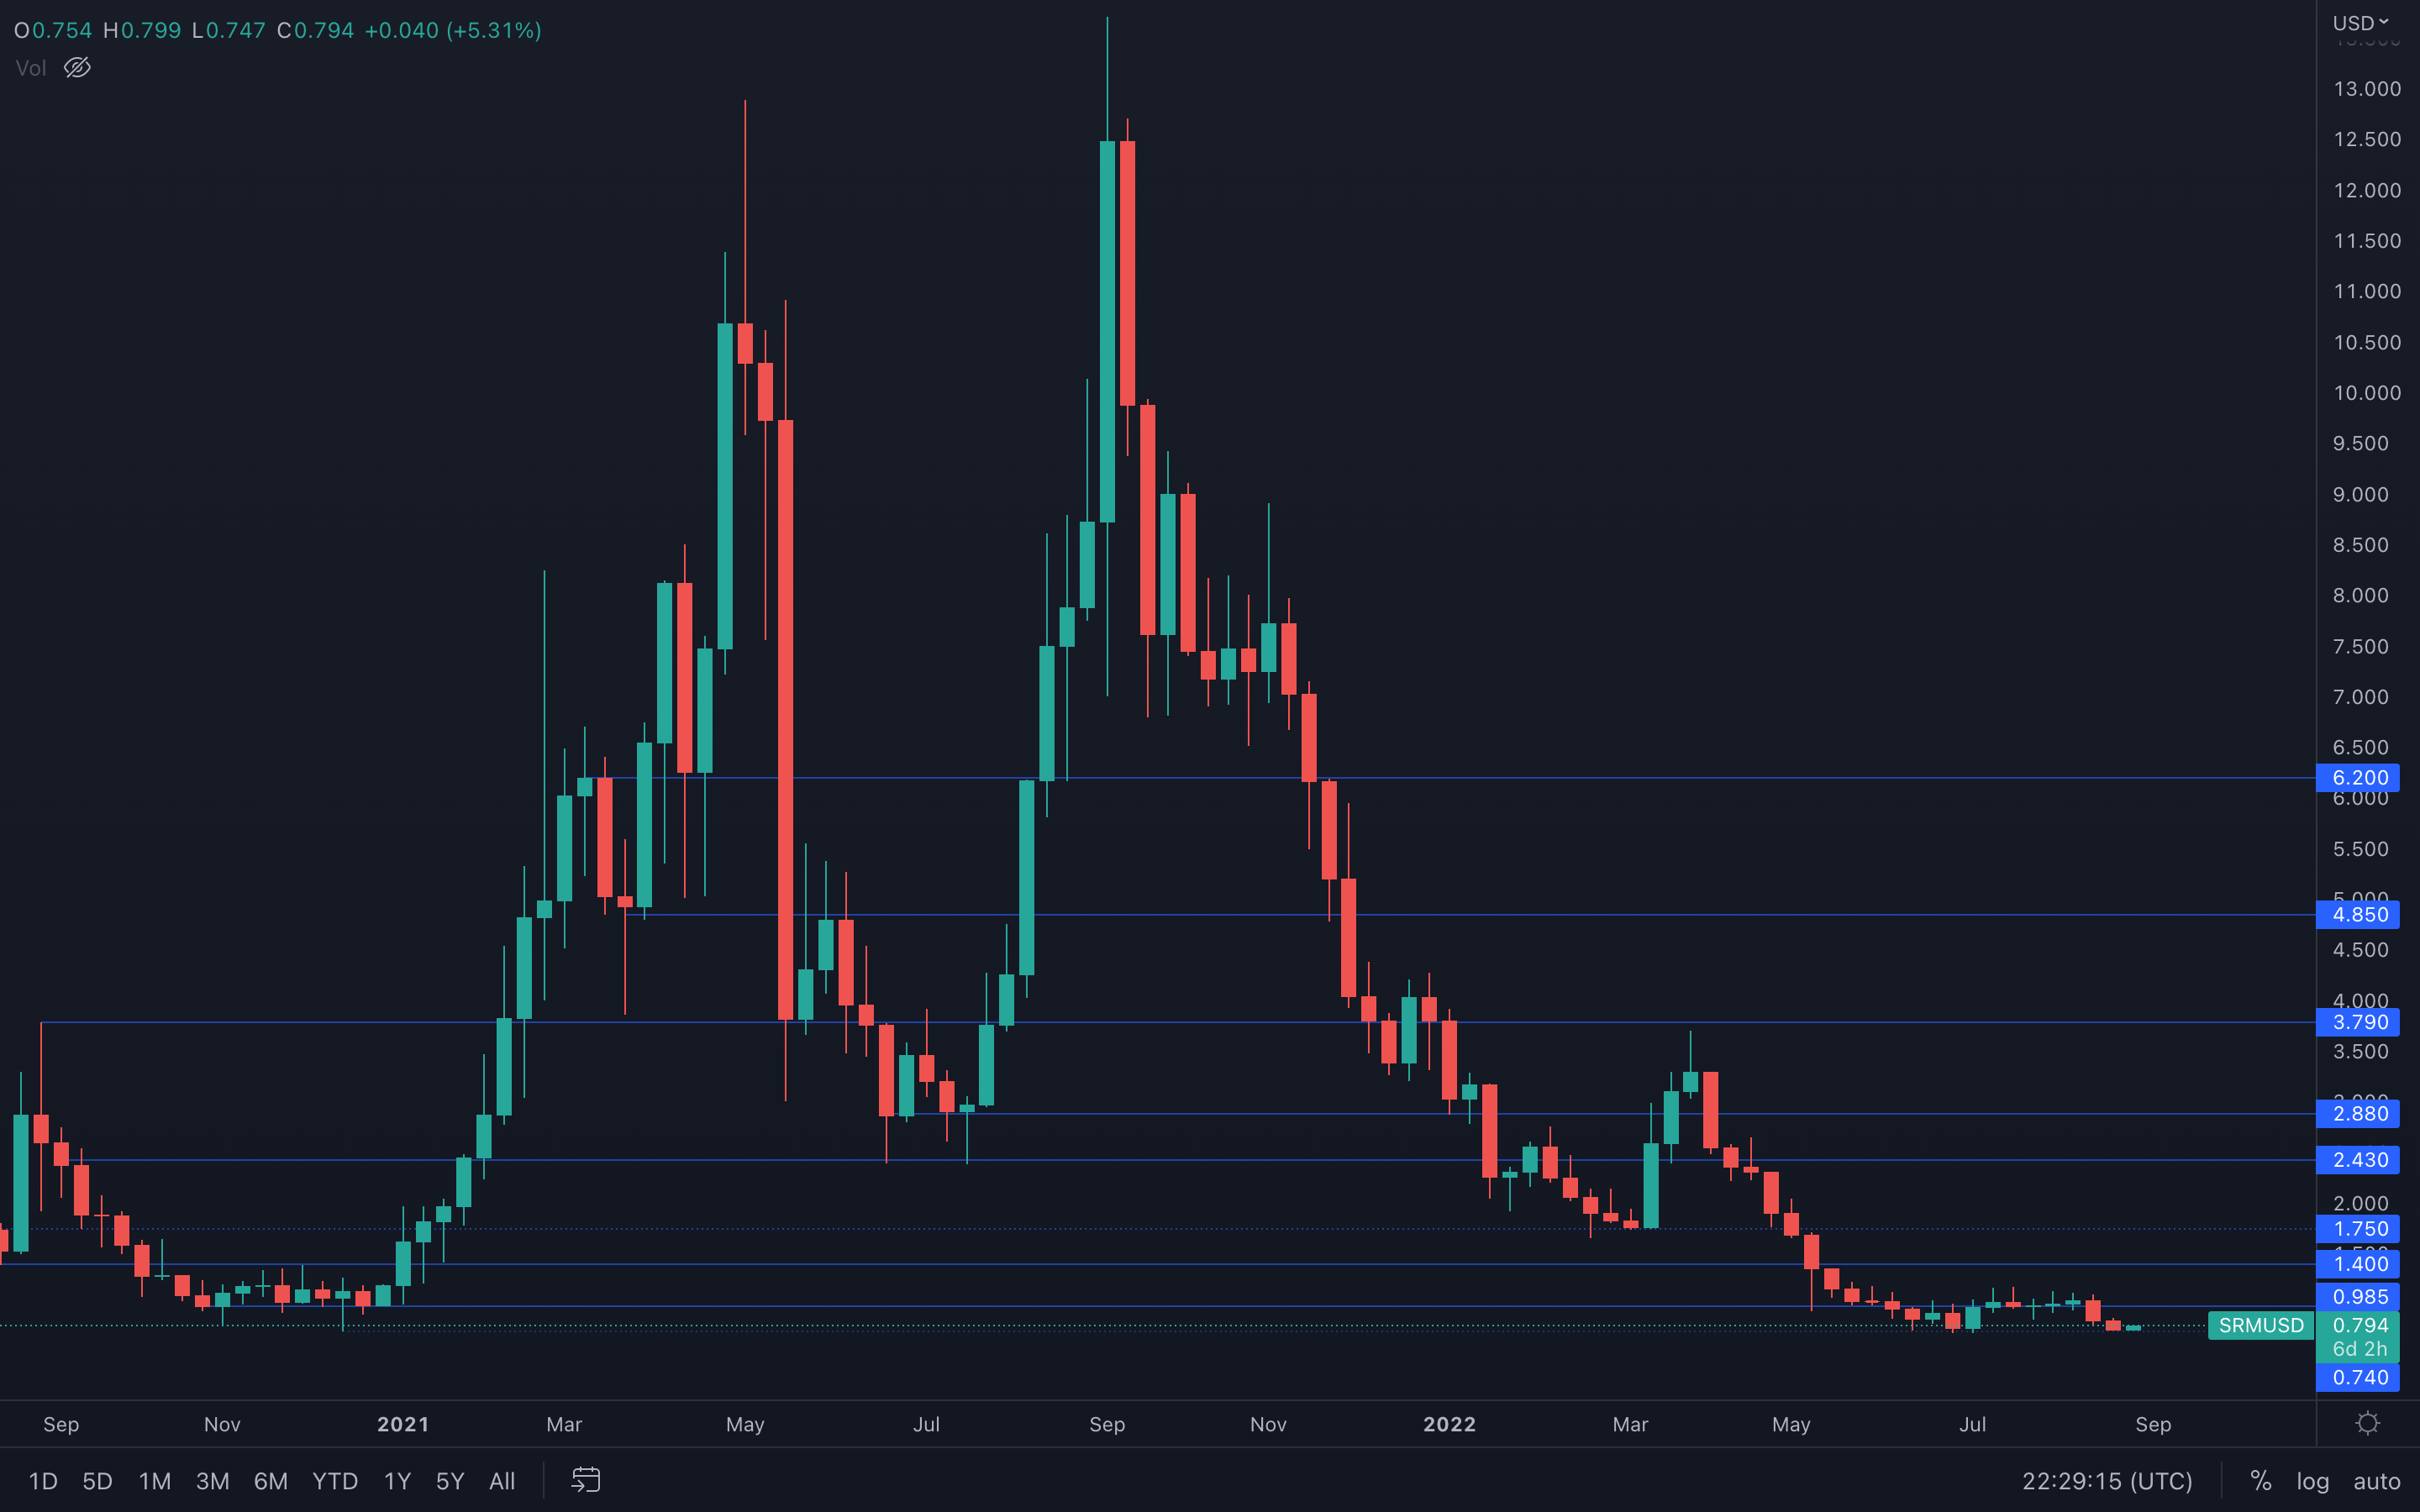 Another week passed, and SRM still managed to maintain its title of "the asset with the most boring price action". Last week, SRM retested its all time low at $0.74 and is currently forming a bullish engulfing candle on the daily timeframe - this suggests the probability of rising further from here. A loss of $0.74 will lead to downside price discovery, and only a break above $1 can offer confidence for higher prices.
FTT
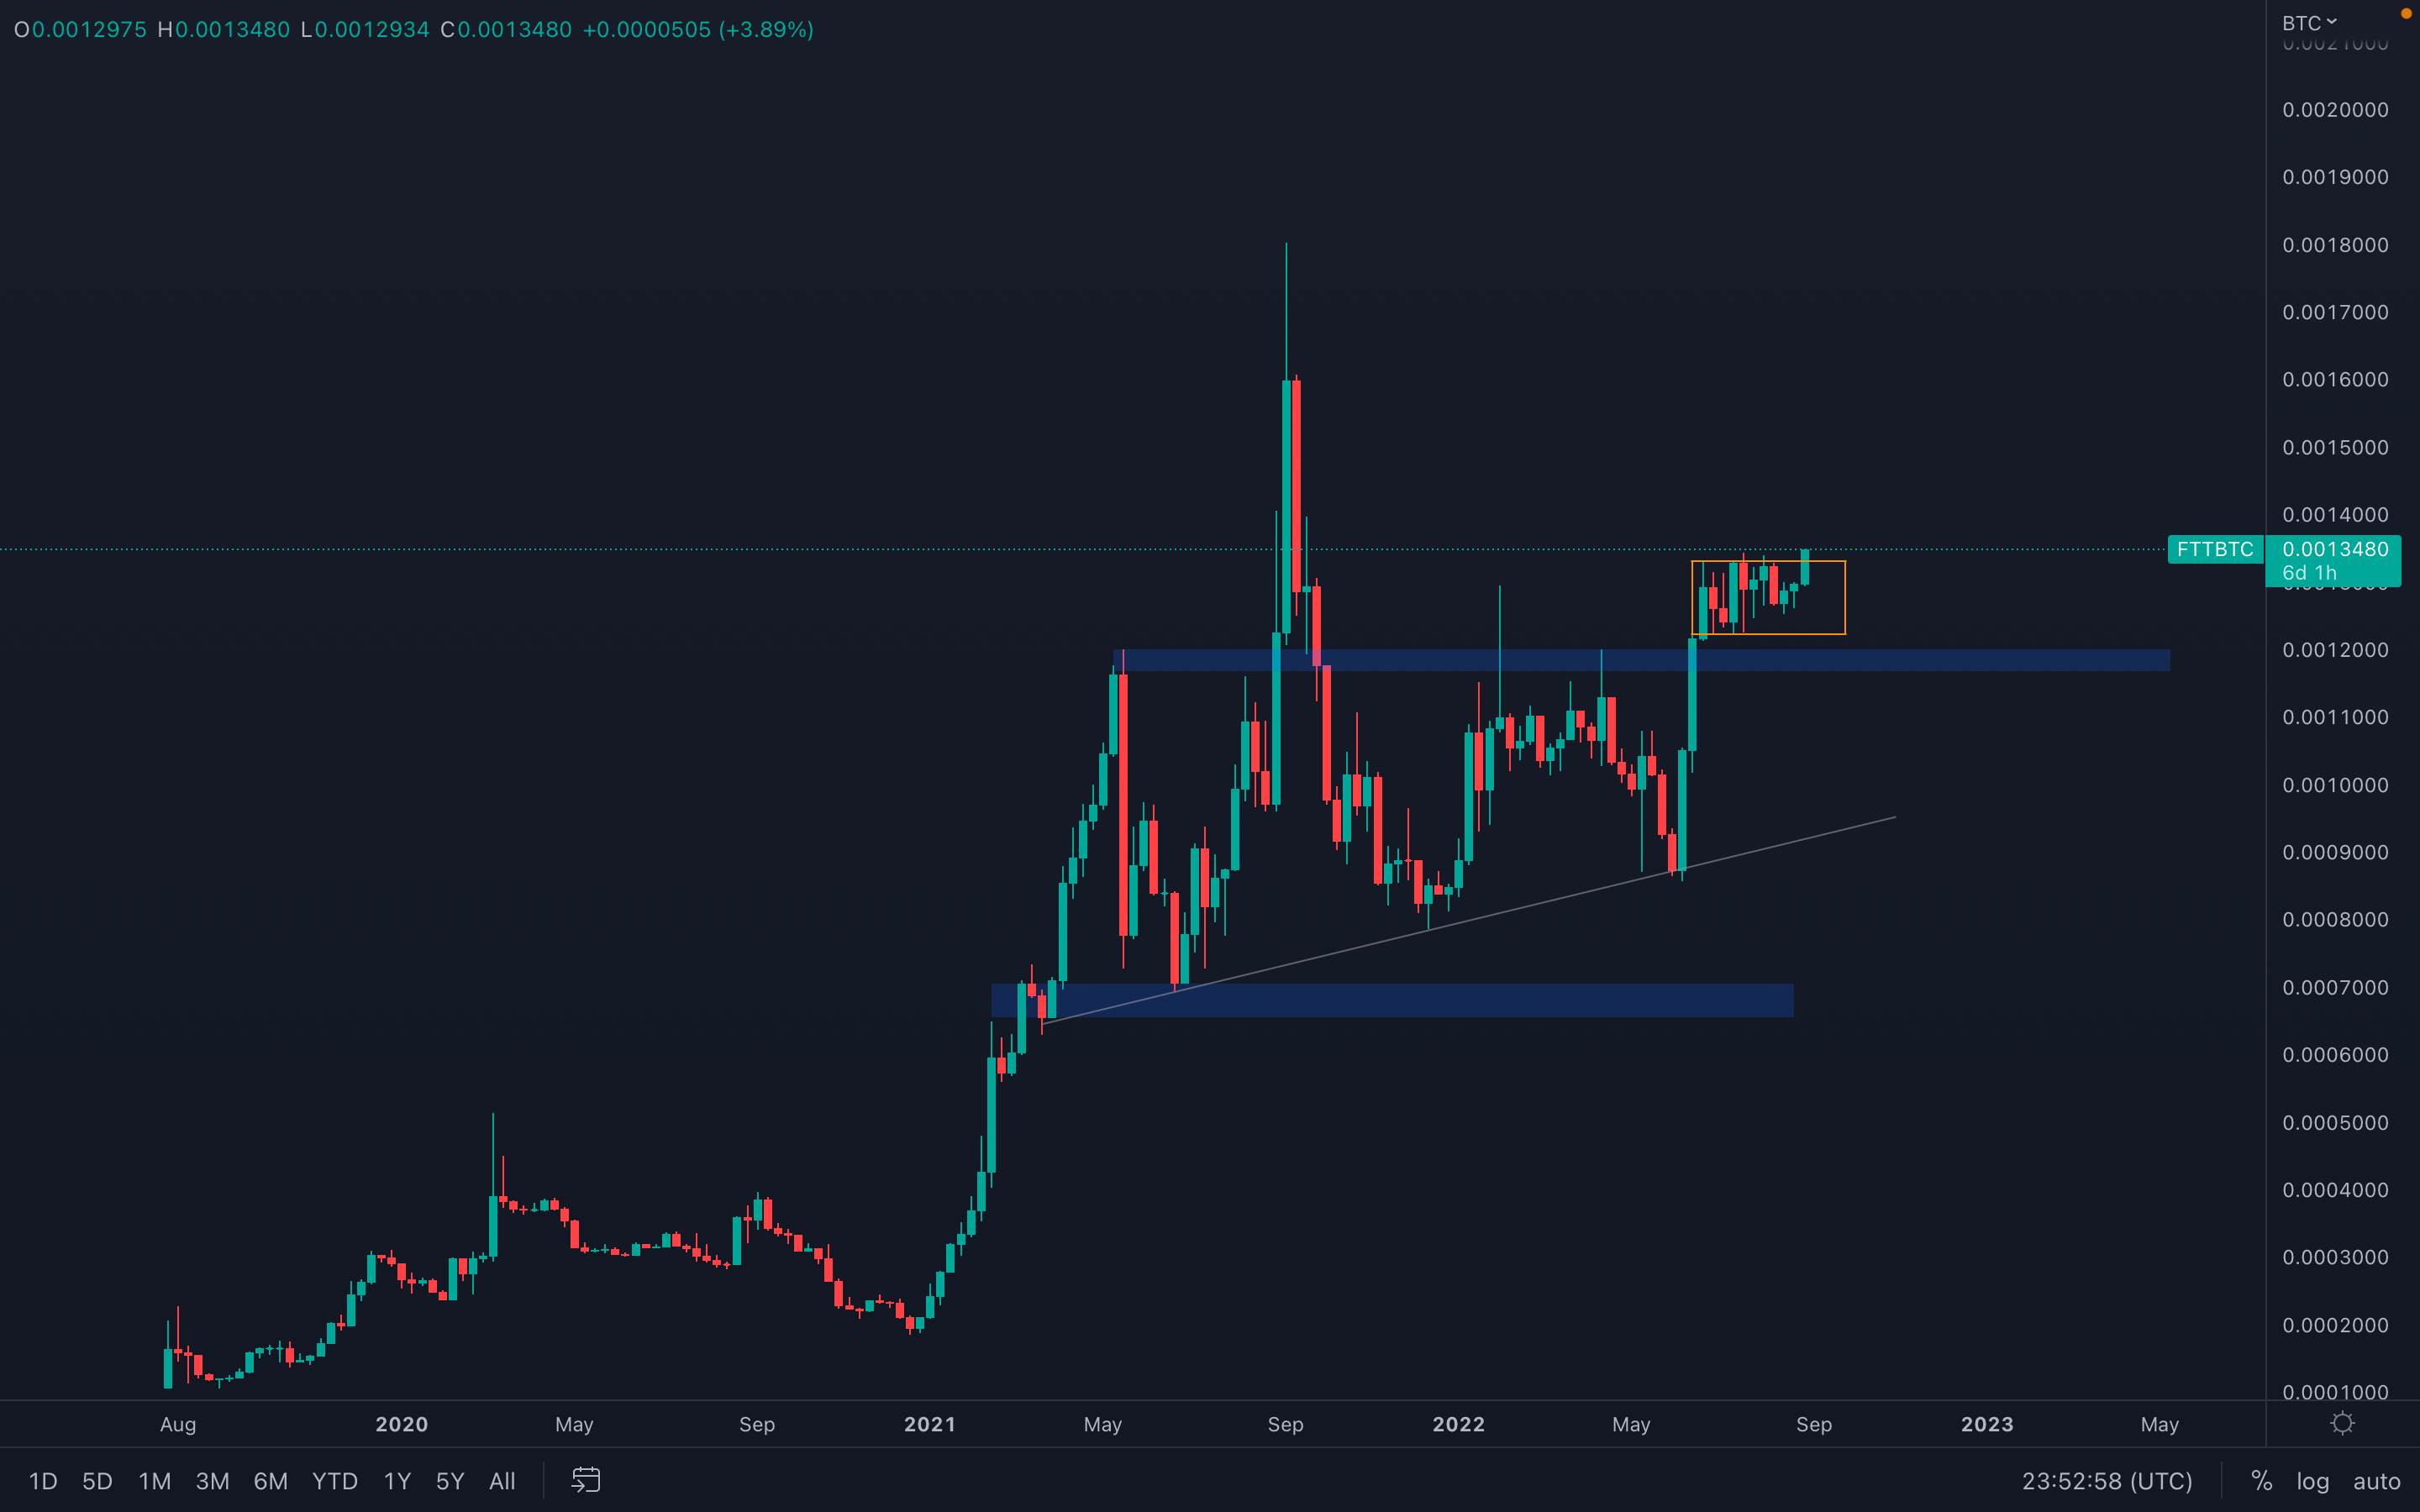
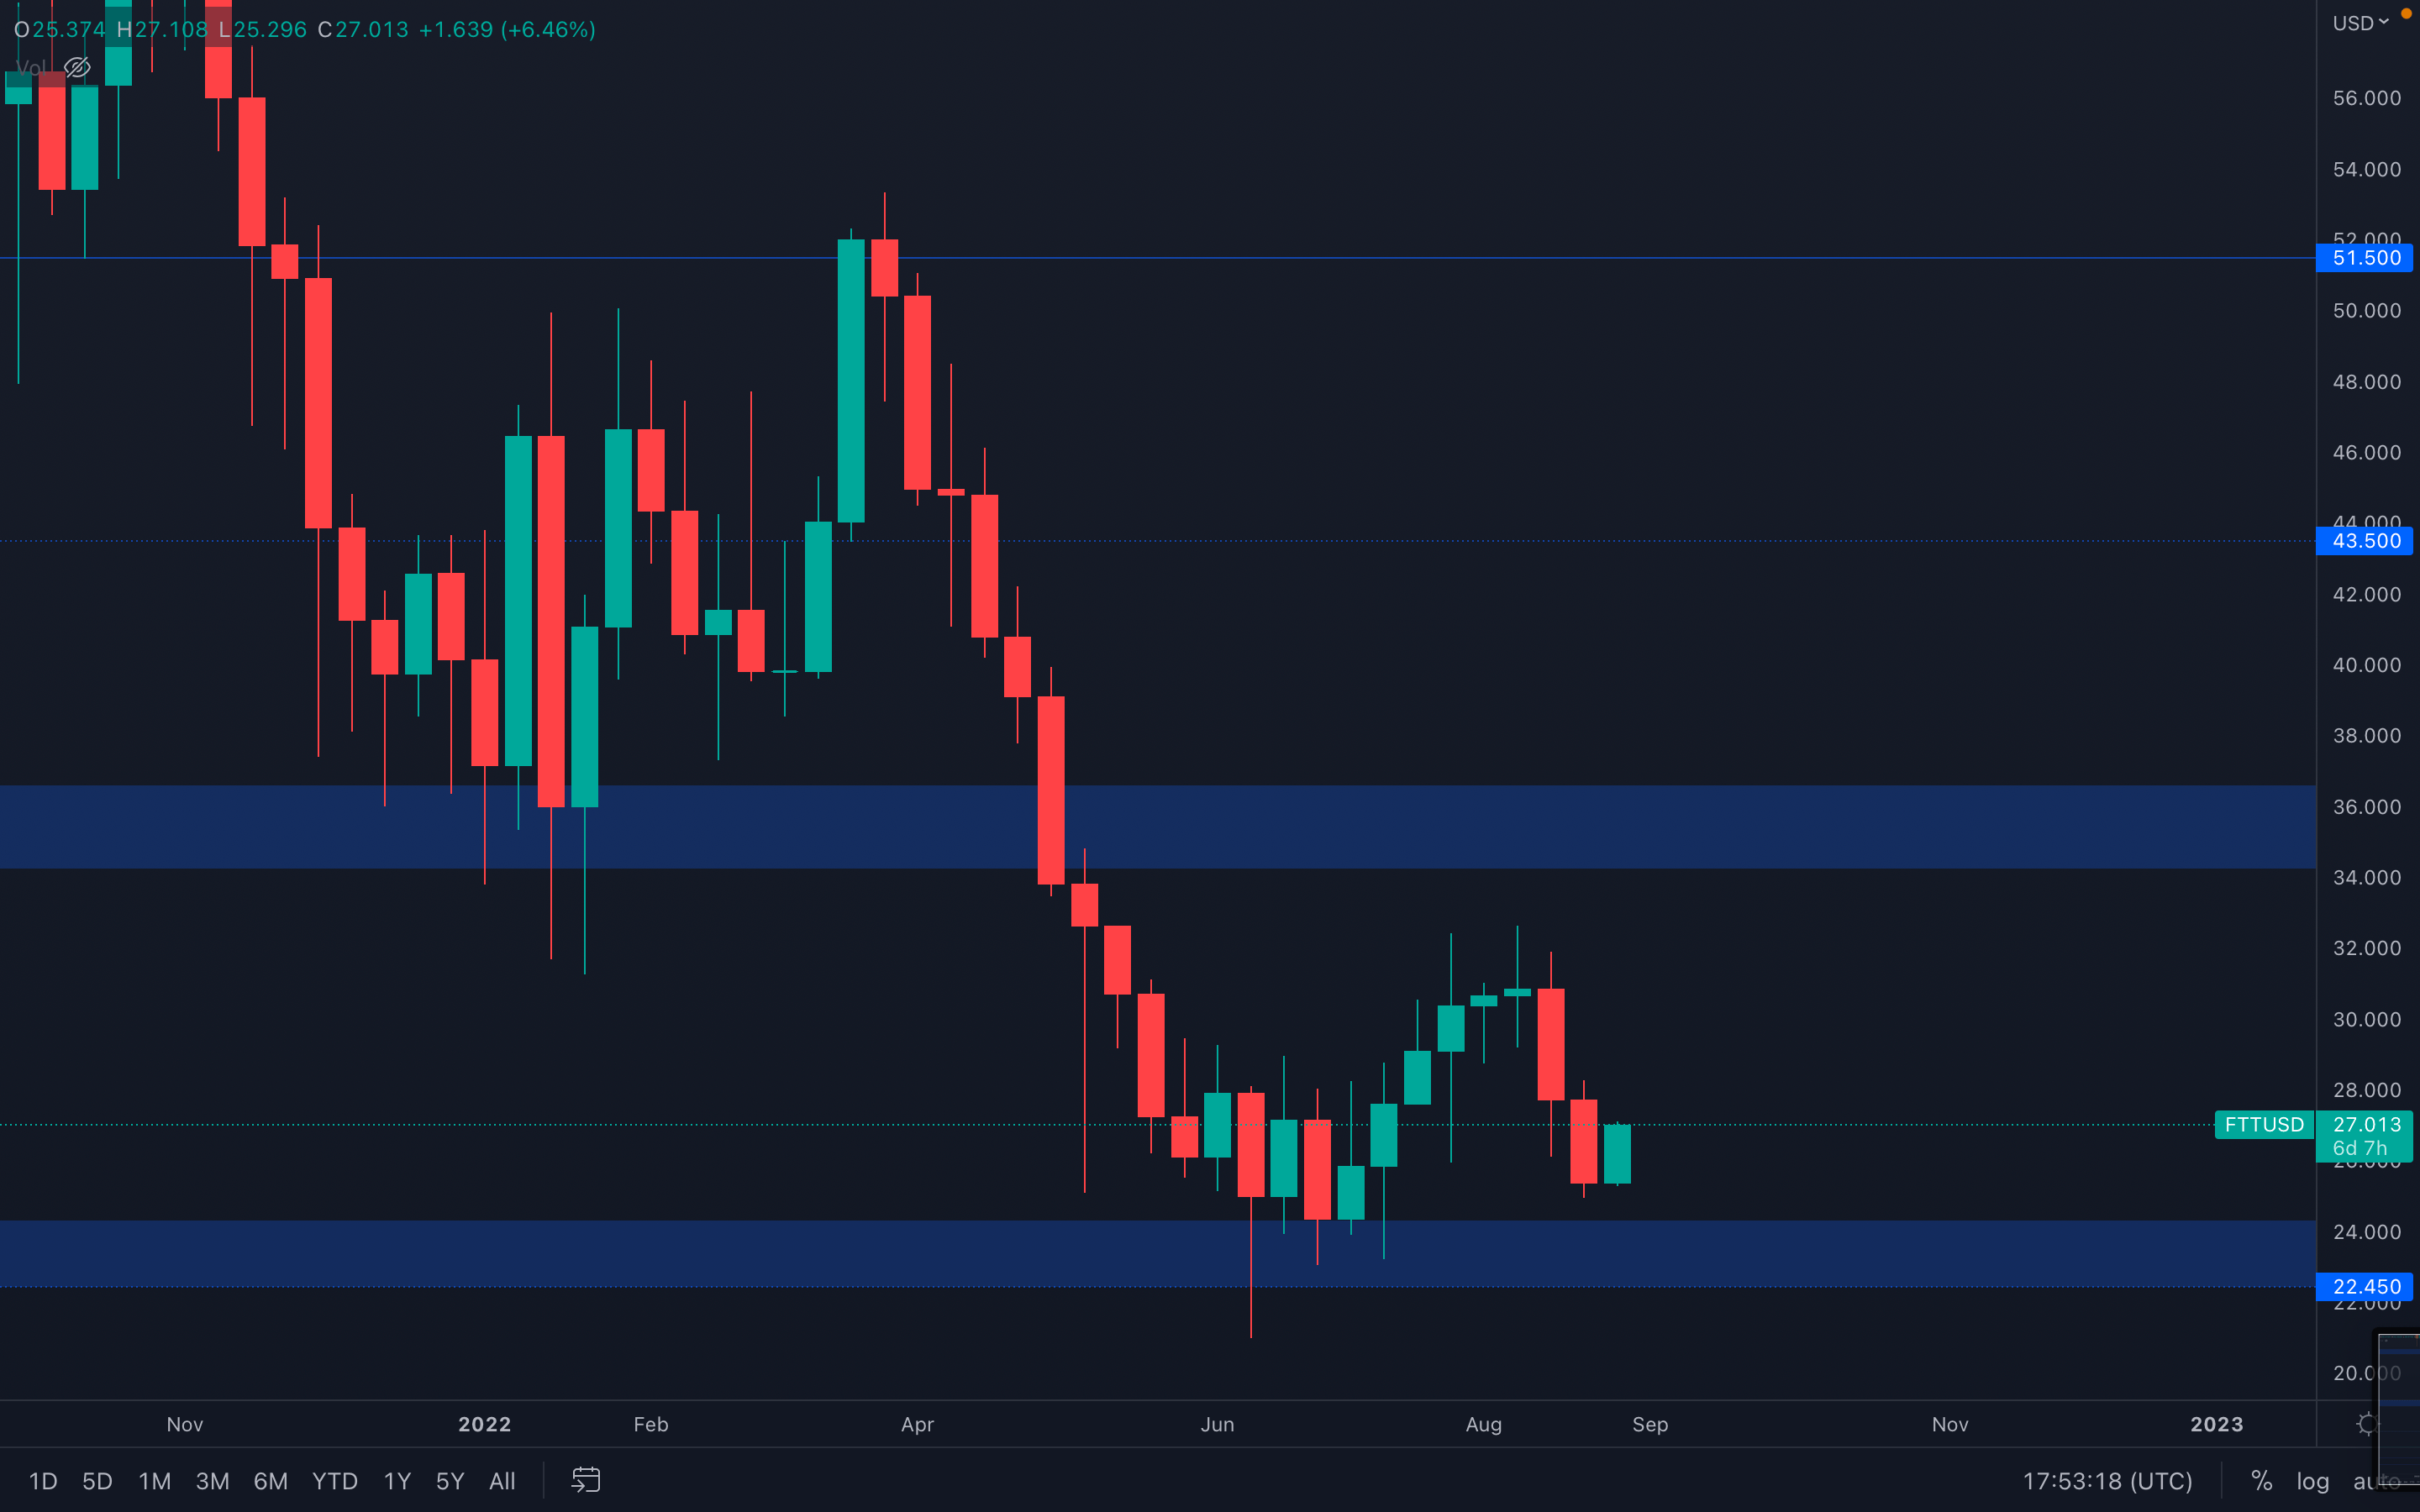 Another red week, which is almost close to being invalidated due to a strong performance from FTT. A major change is about to occur on the FTT/BTC pairing, as we can see a potential break out from the consolidation area highlighted below. If this area is successfully broken (weekly closure above needed), we should expect FTT to become one of the biggest outperformers in our asset list over the coming weeks, of course, if the rest of the market behaves accordingly.
FTT/BTC
MINA
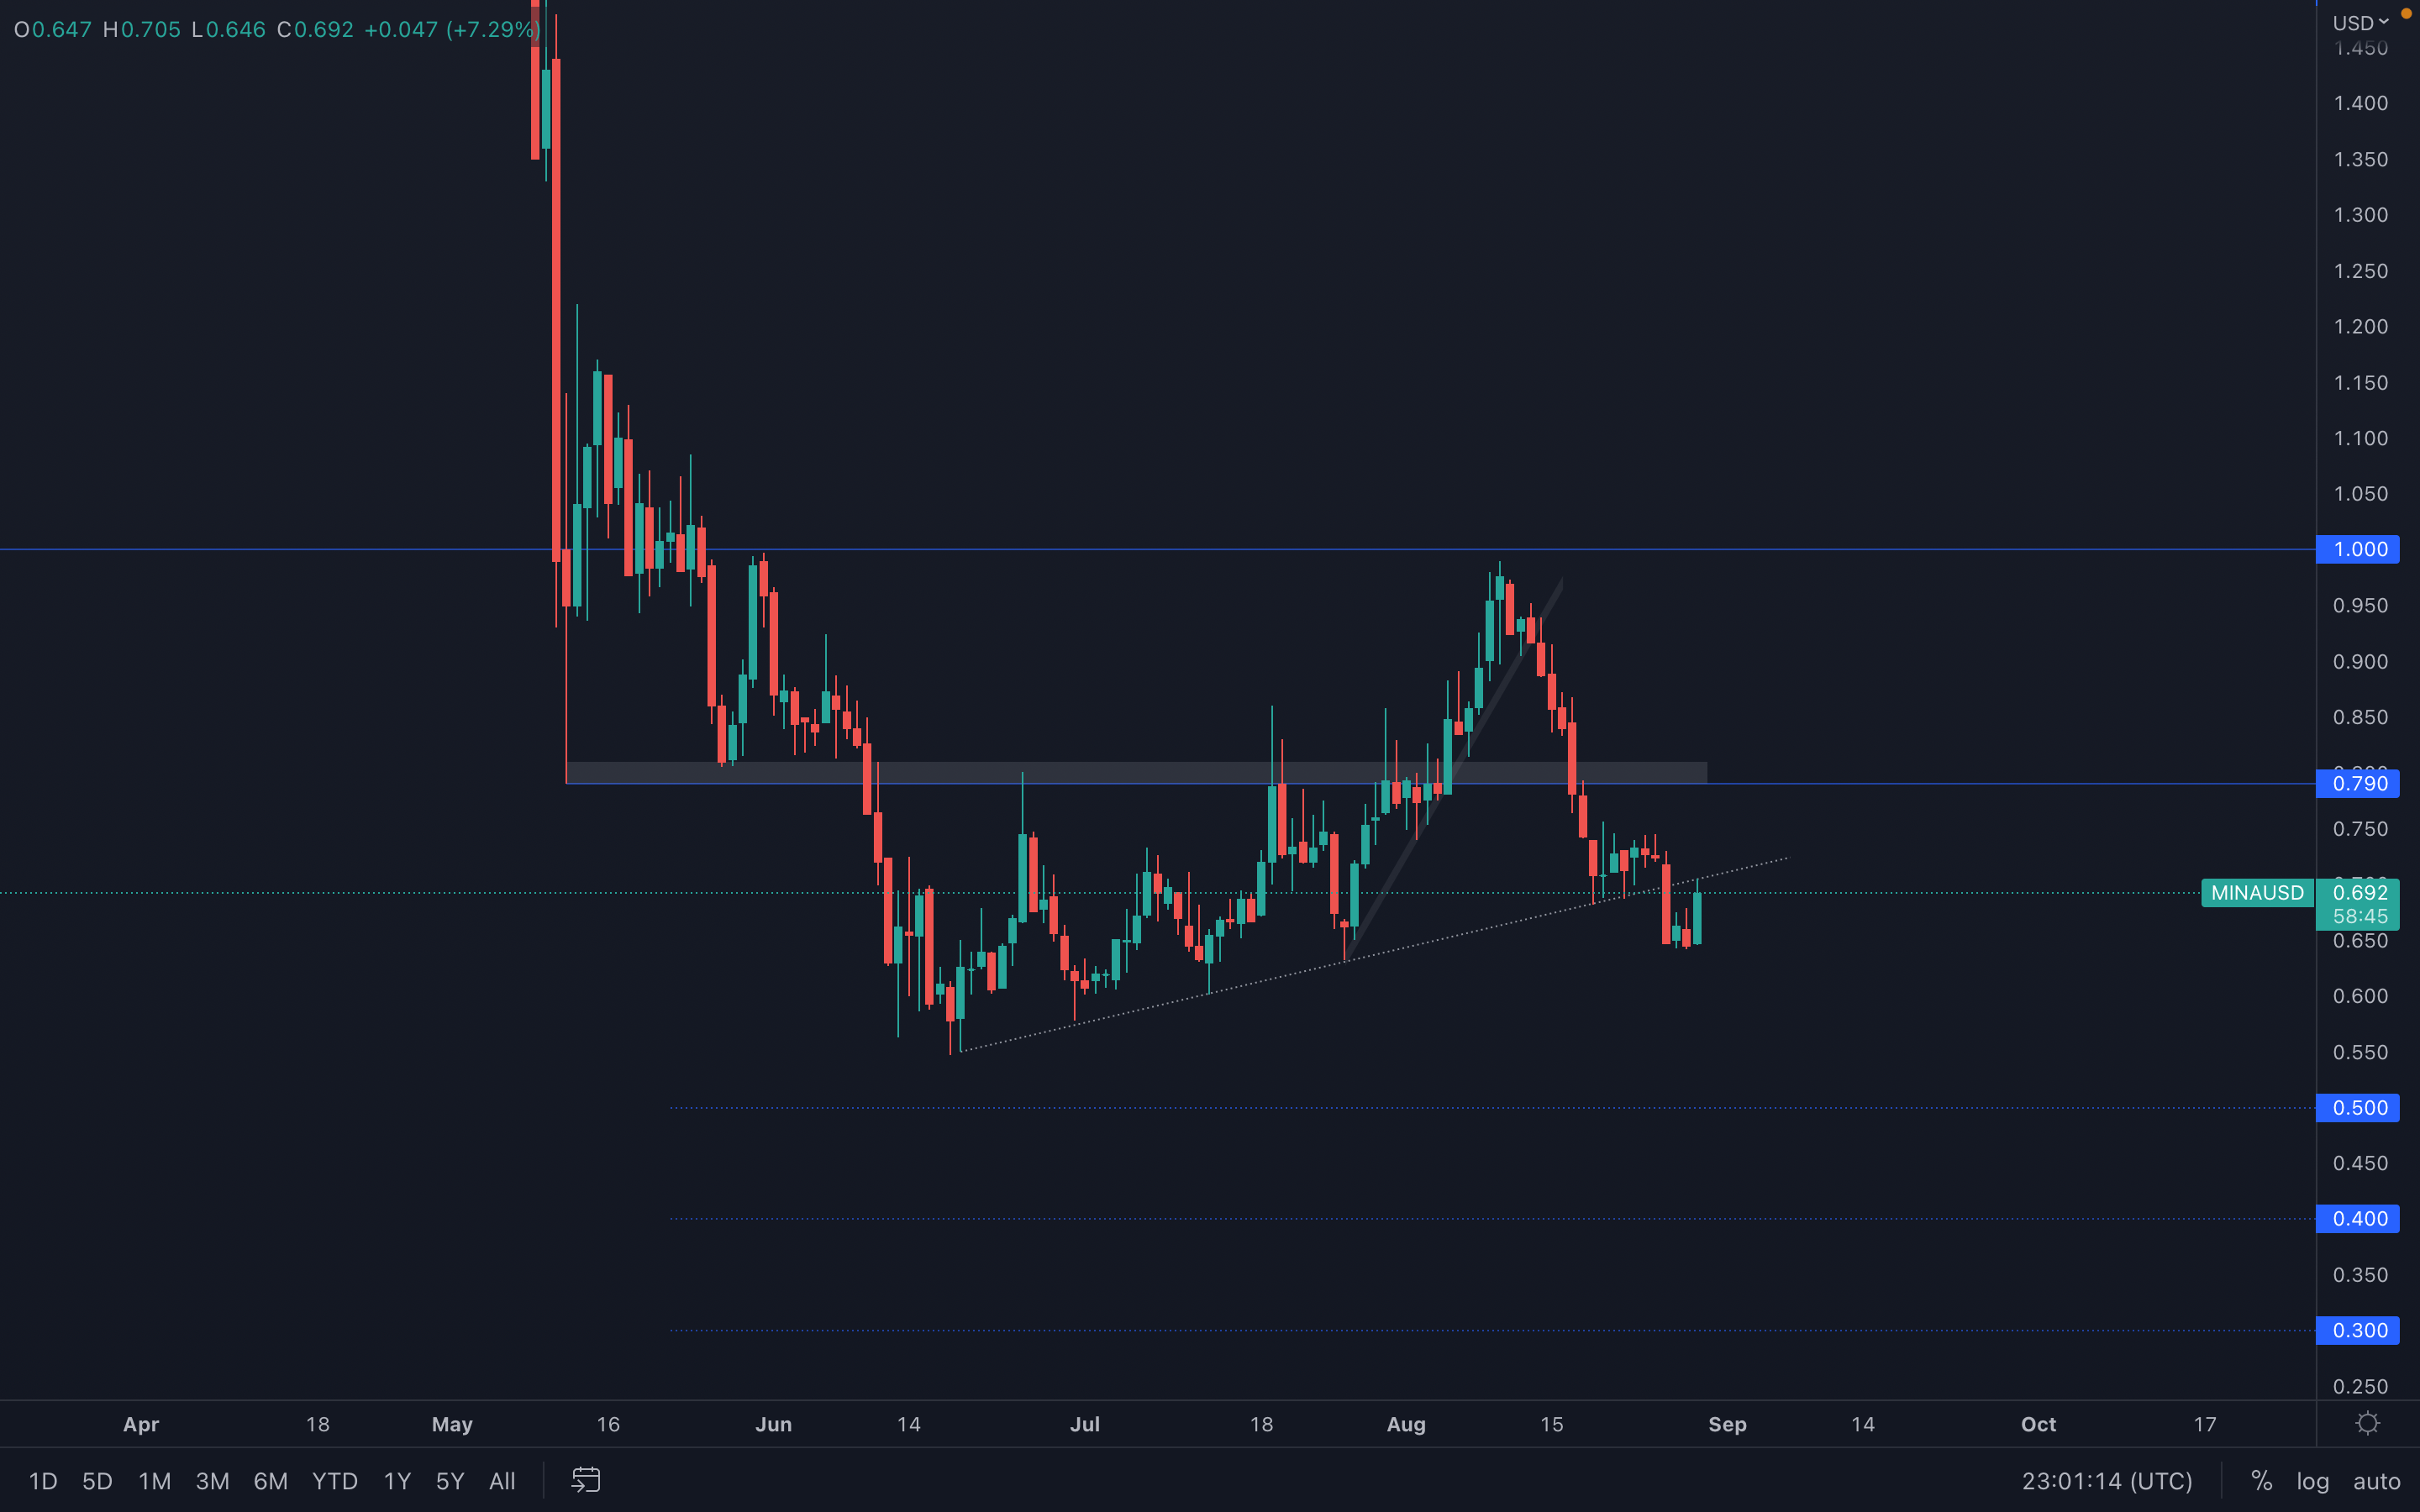 (Daily chart was used)
The accuracy of the highlighted trend line never ceases to amaze
(Daily chart was used)
The accuracy of the highlighted trend line never ceases to amaze  , which MINA proved once again by perfectly retesting the trend line after breaking under it three days ago. Unless the majors come to its rescue, MINA is at risk of heading lower. A daily reclaim of the highlighted trend line will invalidate further downside and put $0.80 as the next price target.
dYdX
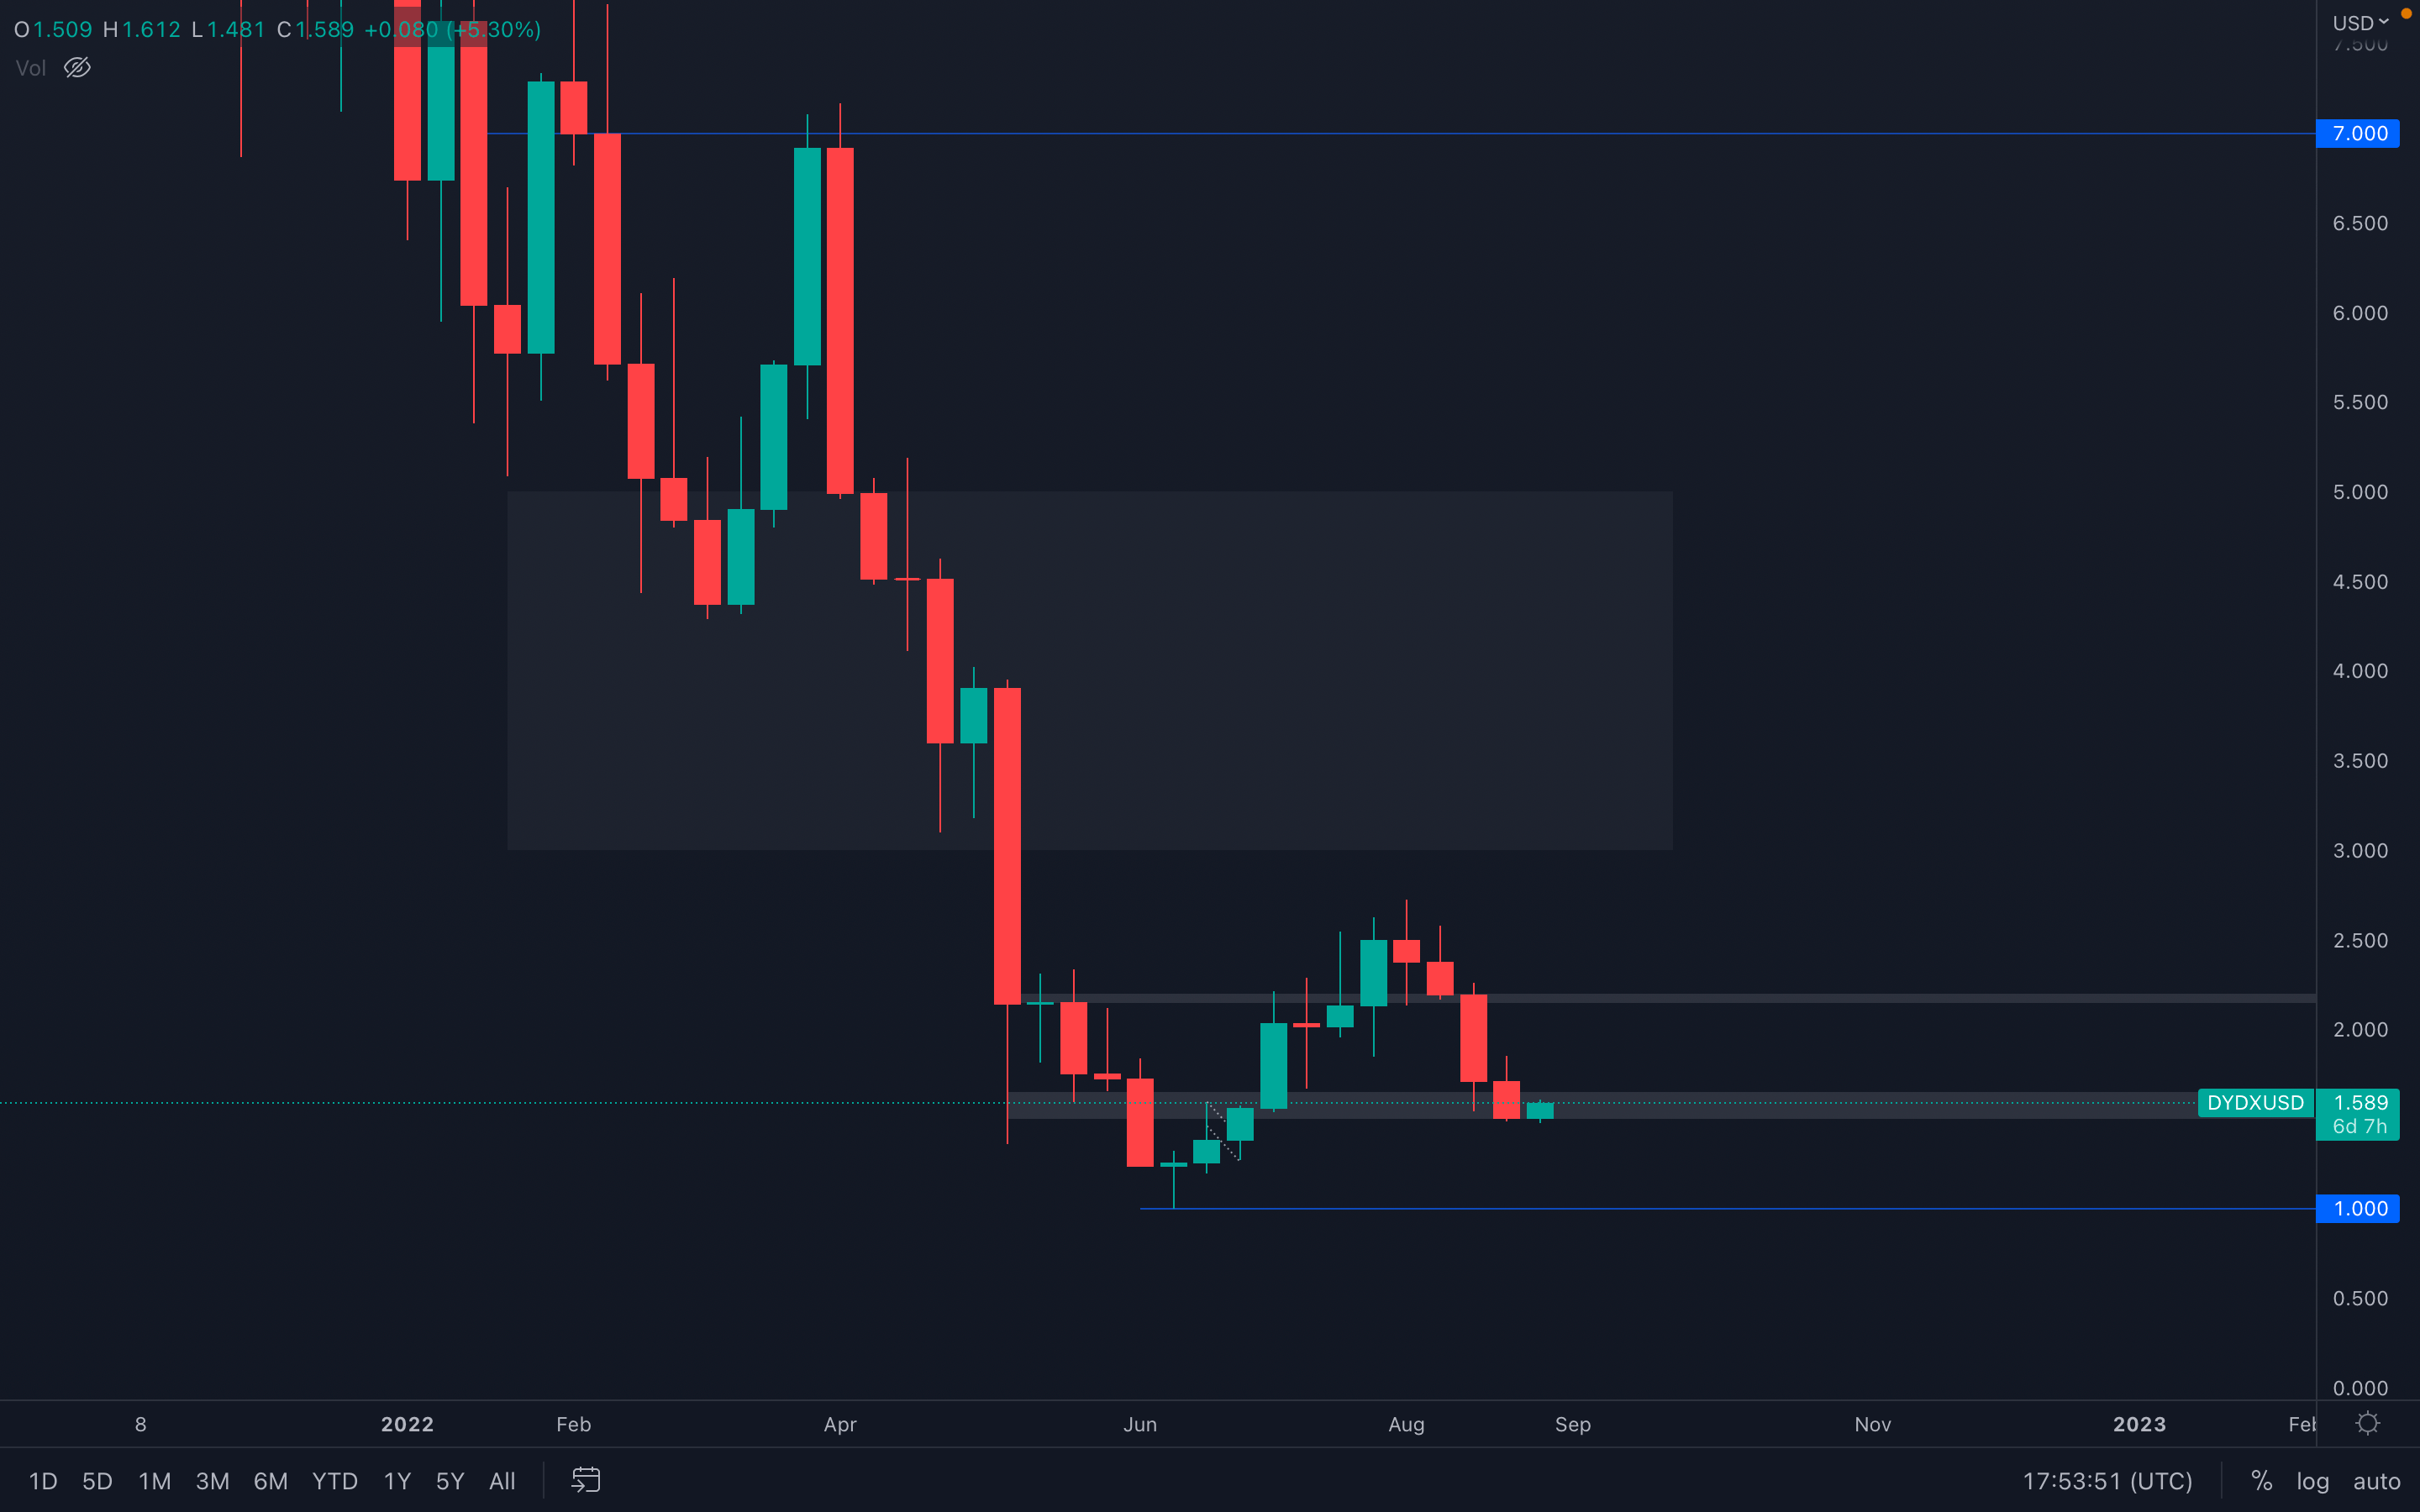 As we mentioned in last week's report, in order for dYdX to continue outperforming the market, its $1.50 - $1.60 support area needs to be held successfully. Last week, dYdX closed right into support and is now experiencing an early week rise, most likely influenced by the majors' price action. It's unwise to expect upside movement from here yet and only a weekly closure will provide the necessary data for us to make assumptions on where dYdX is headed next.
For now, maintaining the $1.50 - $1.60 support area is crucial for further upside, as this will act as a higher low on the weekly timeframe, the first sign of a potential shift in market structures (from bearish to bullish). A weekly closure under $1.50 will invalidate this scenario.
Summary
In analysing the above, we can see that there is still no significant risking on being done by the wallet cohorts that we track more intently, and we’re now beginning to see the wallet cohorts that have continually accumulated over the past 2 years begin to slow down in their accumulation rate. With a number of macro headwinds on the horizon, risk sentiment continues to be low, so even though a number of on-chain indicators point to a possible bottoming area, there’s no reason why the Bitcoin market can’t go down another 20-40%.Until we see some more clear signs that risk is being added by some of the wallet cohorts that we track, it would be wise to maintain a reduced amount of risk.
Recommended from Cryptonary


