Save 23% ($351) & Get a Free 1-1 Call with our Team ⏰ : 0d 2h 59m 43s

Disclaimer: Not financial nor investment advice. You are responsible for any capital-related decisions, and only you are accountable for the results.
Macro
Last week, the FED raised interest rates by 0.75% after the surprising inflation print of 8.6%. This has led the FED to take a more aggressive tone and has also seen them raise rates by 75 basis points rather than just the 50 (which is what had been forward-guided). This signalled to the market that the FED would do what it could to bring down inflation. However, this now most likely points to another 75-basis point rate increase at the July meeting also. The current interest rate sits at 1.75%, and it is expected that by the end of 2022, the rate could be as high as 3.5%. It is likely that until the FED announces an easing of the aggressive tightening policy, it may be tricky for risk-on assets such as crypto to form a macro bottom. Yet, many of the on-chain indicators are showing possible bottom signals after last week's heavy flush out in prices. Let's dig more into the on-chain metrics below.TLDR
- The macro-environment continues to provide headwinds with an unexpectedly high inflation print of 8.6%.
- The Exchange Netflow Volume chart showed mass buying of Bitcoin over the weekend, but this was not reciprocated in Ether.
- The addresses show continued accumulation by the smallest wallet cohorts, yet the 1,000 Bitcoin wallet cohort (the ones we look to) still have not added more exposure to Bitcoin.
- The Purpose Bitcoin ETF saw its largest ever sell of Bitcoin, reducing its holdings by more than 50%.
- The Net Realised and Unrealised Profit/Loss metrics are beginning to show signs that a bottom is near. However, until the macro eases up, crypto may struggle to gain any meaningful momentum.
Total Market Cap
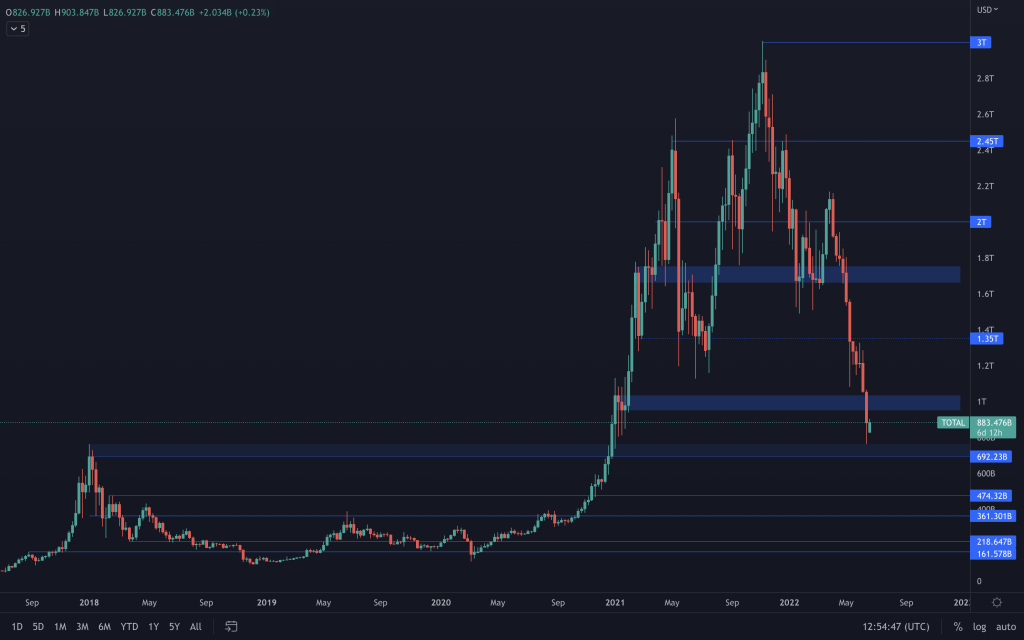
What a week it was for crypto as the Total Market Cap sliced through the $1T support level and headed towards $750B. Both indices have retested their 2017 all-time highs, with the Total Market Cap index pulling back to close the week in the middle of its range ($700B-$1T). However, this gives us no indication that the market has yet bottomed. Yesterday's daily candle did close as a bullish engulfing candle on both indices and the majors. So, it will be worth monitoring the daily charts as there is potential to see some early week relief.
Altcoins Market Cap
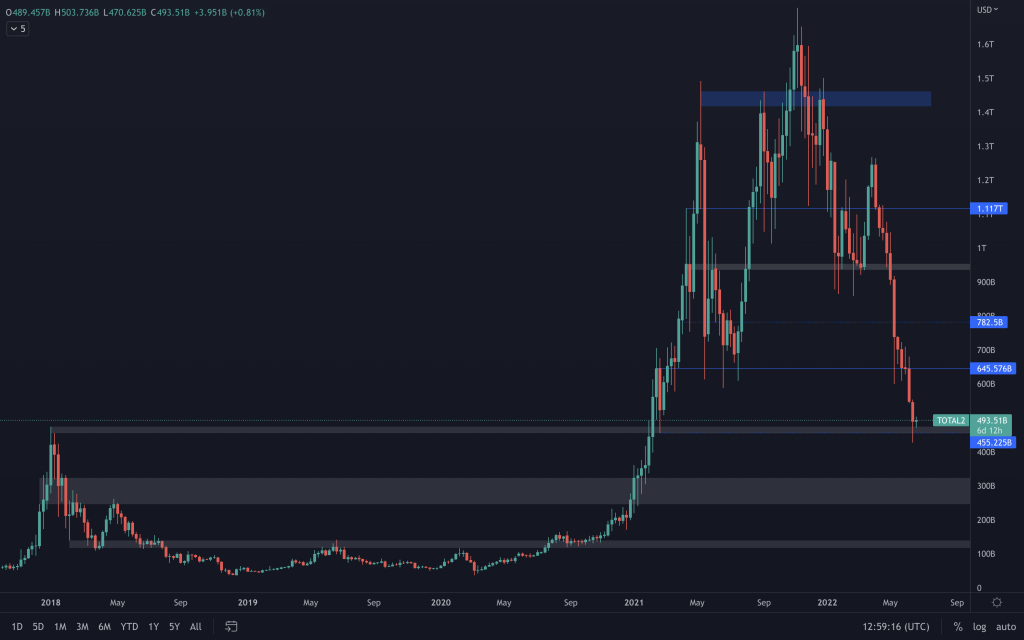
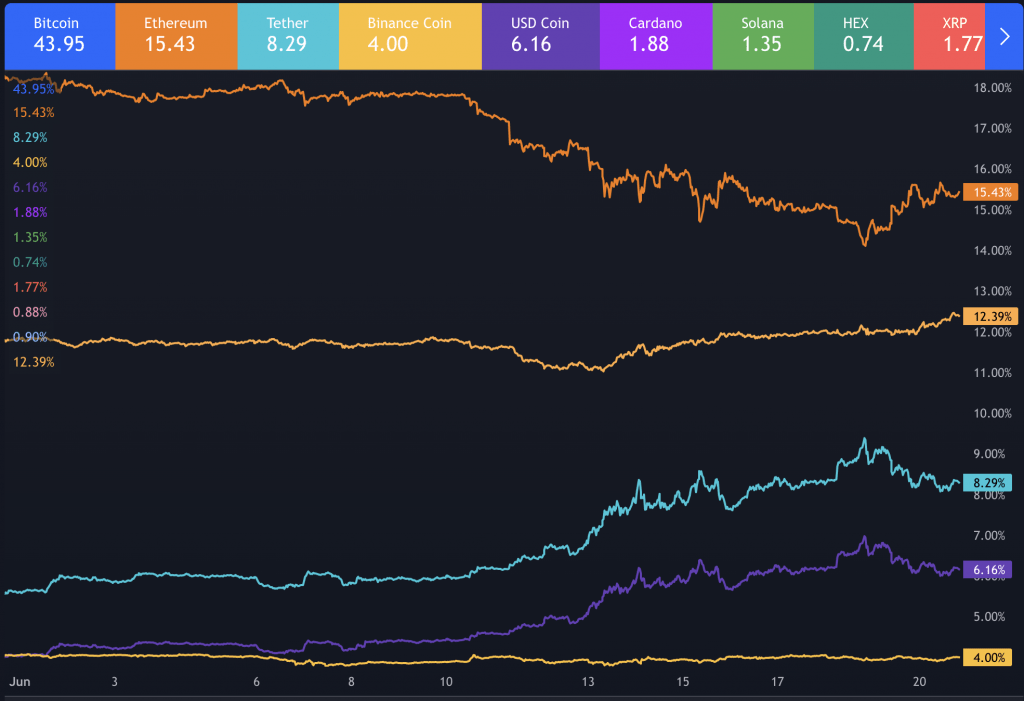
We can attribute much of last week's market cap decline to Bitcoin's sell-off, which is why we see very little difference in this chart compared to our previous edition of Weekly Digest. However, instead of the funds rotating into altcoins, as Bitcoin's dominance declined, they continued to be rotated into stablecoins. This suggests that investors felt safer in stablecoins, believing the bottom (at least local) was not yet in. This increased stablecoin dominance. It's worth noting that the largest stablecoins are taken into consideration in the altcoin market cap. The below chart is a visual representation of the dominance of Bitcoin, Ether, Tether and USDC (Binance coin happens to sneak in there).
Bitcoin – Technical & On-Chain Analysis
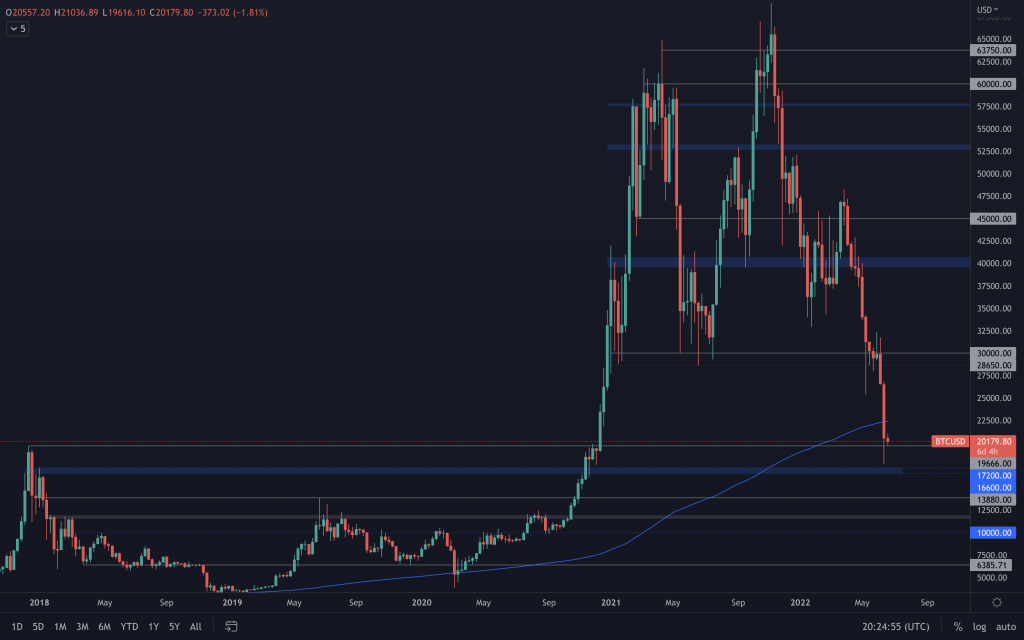
We witnessed our second volatile weekend in a row, and on the last day of the week Bitcoin pushed back above the 2017 all-time high that, on this particular chart, is positioned at $19,666. You'll notice that last week we mentioned the significance of the weekly 200MA that has previously acted as a bear market support. The 200 moving average is currently located at $22,500 and we can clearly see in the chart that Bitcoin has now closed below it, meaning that the market may well be headed lower over the coming weeks/months. We've also spoken about how close a relationship Bitcoin has with the stock market of late, namely the S&P 500 (ticker SPX). There is room for the S&P 500 to decline, with its support coming in at $3,250-$3,500, and the stock market's first trading day of the week being Tuesday (as Monday was an American holiday). This is something to take into consideration as it risks seeing further capitulation. But, once again we find ourselves at a location to look out for signs of a relief rally. After all, Bitcoin has declined more than 63% (from $48,000) without so much as taking a breather and all indicies have retested (and closed back above) their 2017 all-time high. For that, we'll be monitoring the daily chart for indication of strength by bulls.
Metric 1 – Exchange Netflow Volume
Bitcoin – Exchange Netflow VolumeThe Exchange Netflow Volume shows the net flow of coins into or out of Exchanges. In the past month, there have been some significant green spikes (coins flowing to Exchanges, likely to be sold). However, after the dramatic fall in prices last week, we saw some aggressive buying over the previous weekend (indicated by the large red spike, the largest since May 2016).
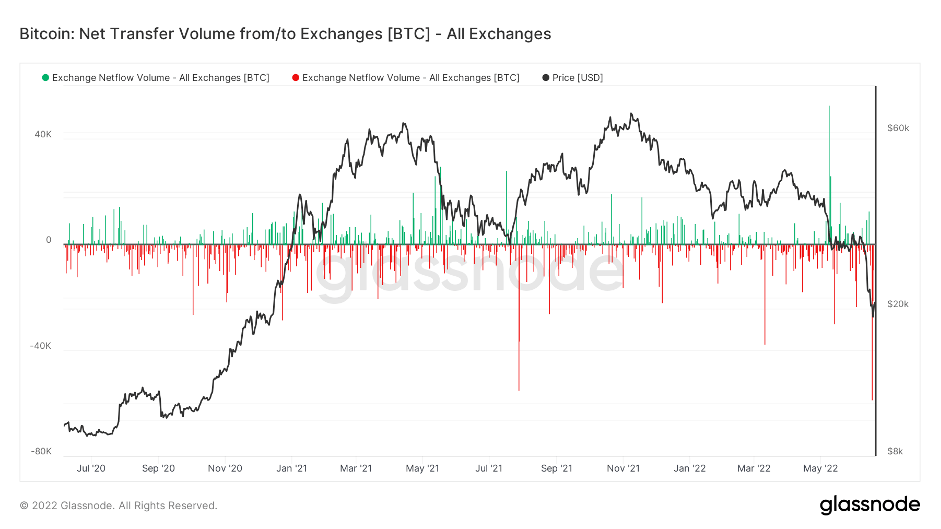
It can be noted that Binance purchased more than 100,000 Bitcoin over the weekend to help quell the market crash. This sizeable red spike may be due to Binance's purchase. Regarding Ether, we didn't see the same.
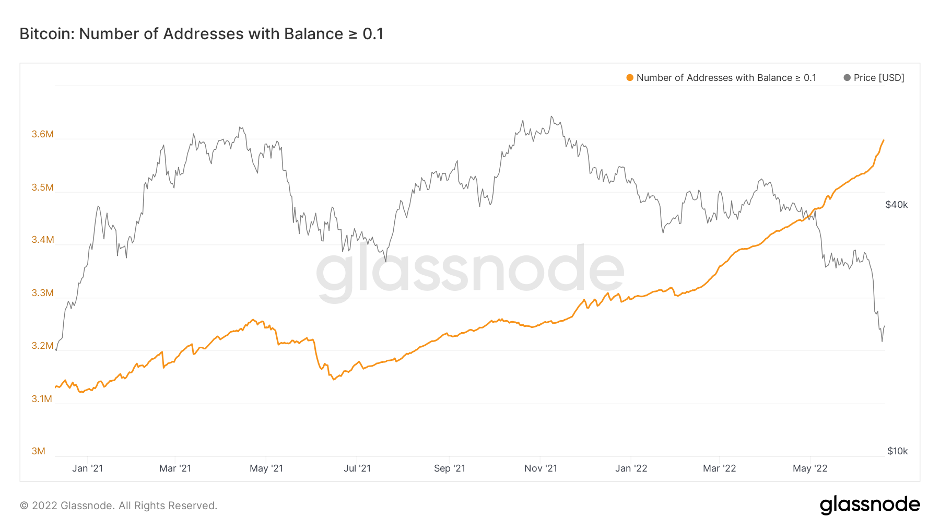
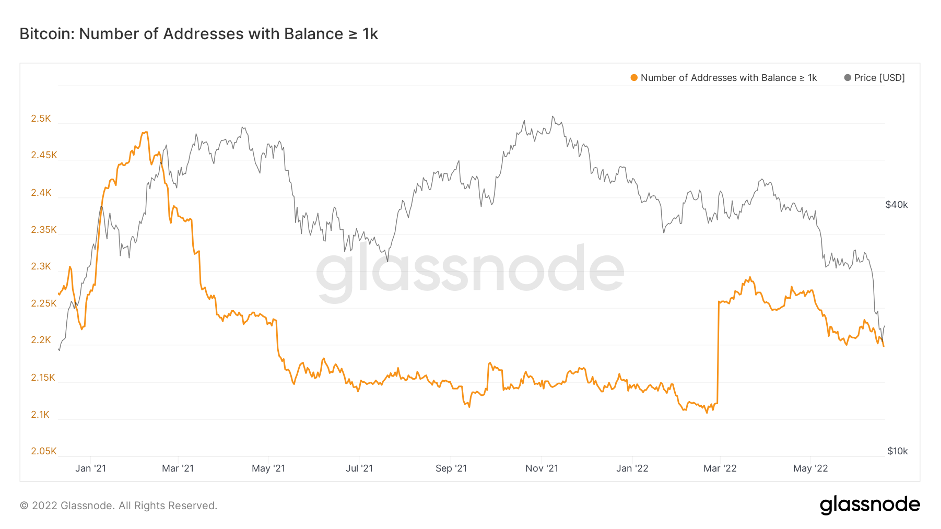
Metric 2 – Addresses
Let's now turn our attention to the addresses. We can see that the number of wallets holding more than 1,000 Bitcoin (the wallet cohort that is historically the most profitable and who we try to emulate) have not risked-on (bought) during this crash. Yet, many of the smaller wallet cohorts have.Bitcoin – Addresses with Balance > 0.1 Bitcoin
Bitcoin – Addresses with Balance > 1,000 Bitcoin
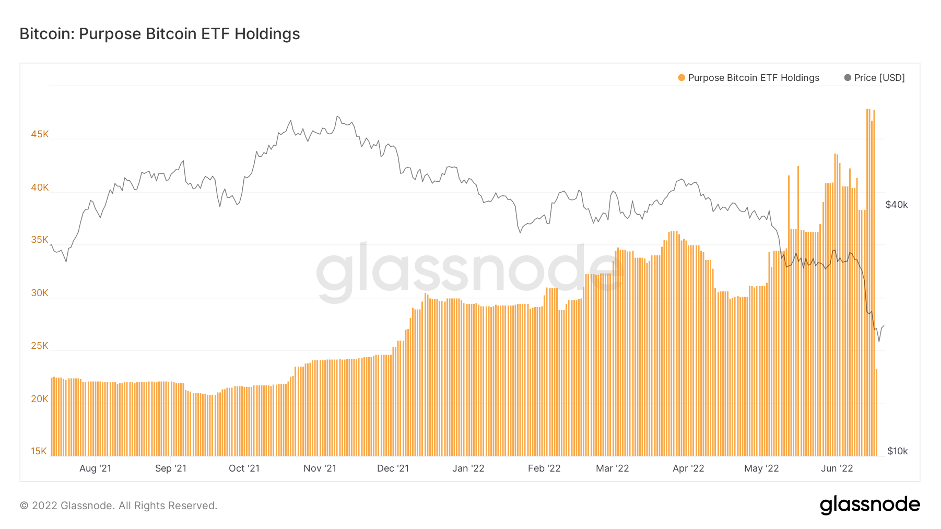
Metric 3 – Institutions
One of the metrics we place some attention on is the Purpose Bitcoin ETF and the inflows and outflows of Bitcoins. We can see that during May and June, they accumulated more Bitcoin. However, following last week's decline in price, they sold off a significant portion of the Bitcoin they held. Their total number of Bitcoin in the ETF dropped from 47,818 to 23,307 in just a day.Does this signal that they believe the market will go lower?
Bitcoin – Purpose Bitcoin ETF Holdings
Metric 4 – Realised and Unrealised Profit/Loss
In previous reports, we have looked at the realised and unrealised profit/loss charts as potential indicators of when enough losses have occurred that a market bottom may be near. We are finally beginning to see some evidence of this. Let's look at the Net Realised Profit/Loss. We can see significant loss taking (investors realising their losses) over the past week. This loss-taking was significant compared to previous large loss-taking events, i.e. July 2021.
Bitcoin – Net Realised Profit/Loss
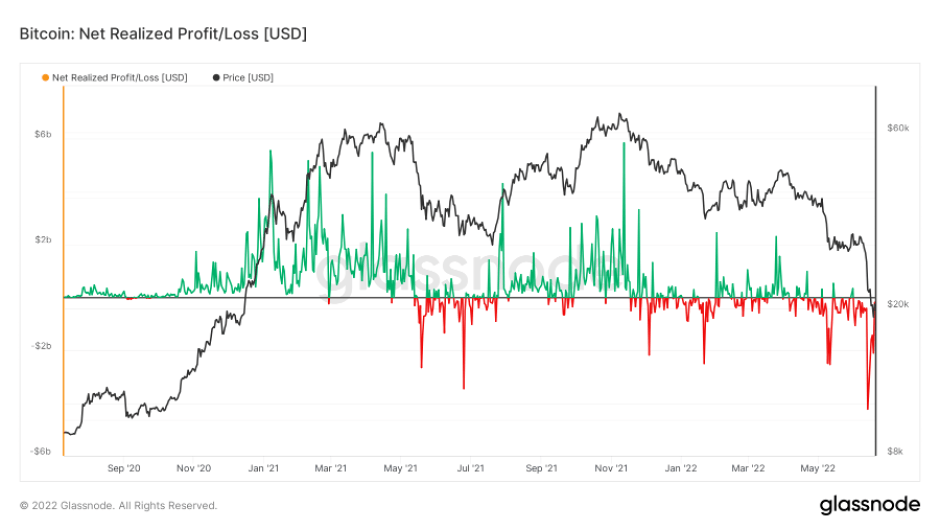
Note: We do not have this metric for Ether. However, we would assume it would look reasonably similar as Ether's flush out in price was more extreme than Bitcoin's.
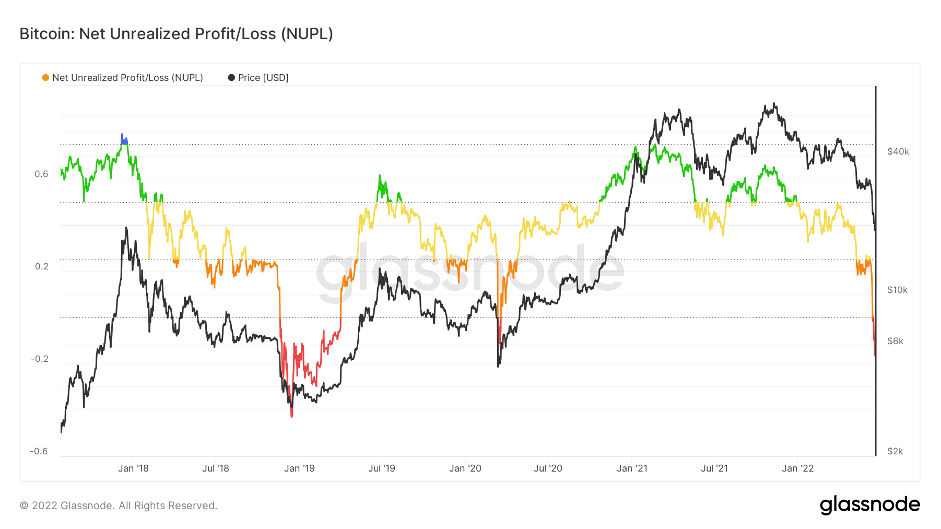
If we now look at the Net Unrealised Profit/Loss, we can finally see that we have moved into the 'red zone', which has previously highlighted Bitcoin macro bottoms.
Bitcoin – Net Unrealised Profit/Loss
Ether – Technical & On-Chain Analysis
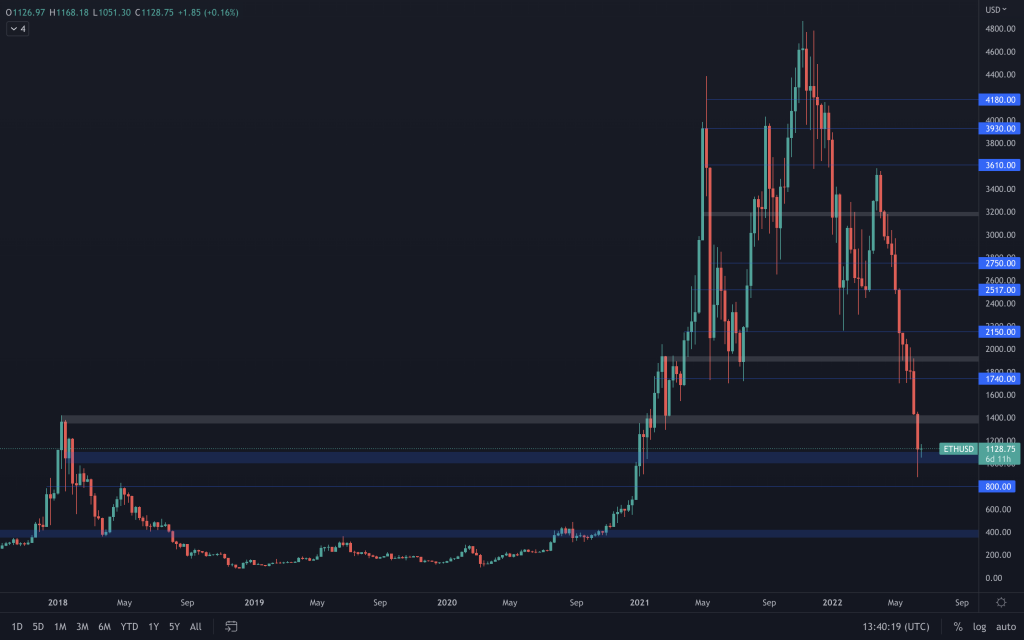
Eleven red weekly candles in a row! Ether's price action is still weak as it continues its run of red weekly candles, closed the week below its 2018 all-time high, and failed to gain any dominance whilst Bitcoin's dominance declined. Demand was found below $1,000, which helped push ETH's price back up and close the week above it, giving hope to a potential relief rally. The slow down in decline to Ether's price and the first daily bullish engulfing candle at support in quite some time has the potential to create a base for positive price action. We'll focus on market structure as Ether has been unable to form a bullish daily structure since the start of April, making that a significant change should we see it. However, with the macro taken into consideration, any relief that we see will likely be short-lived. If Ether can't maintain $1,000 by a weekly close, we'd be looking at $800 next.
Metric 1 – Exchange Netflow Volume
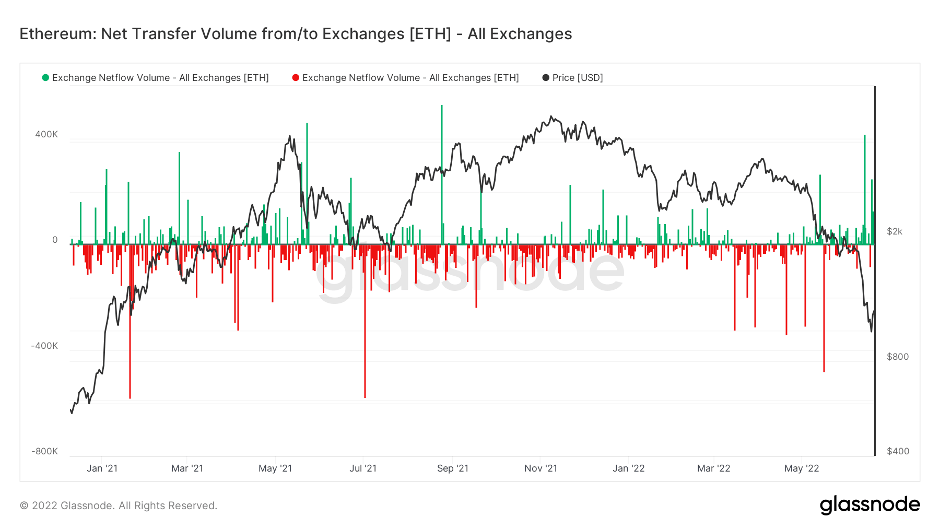
Ether – Exchange Netflow VolumeIf we look at the Exchange Netflow Volume for Ether, we can see that we have had the opposite of Bitcoin; more coins are flowing into Exchanges than flowing out. This would indicate that there is no such significant conviction in Ether as in Bitcoin.
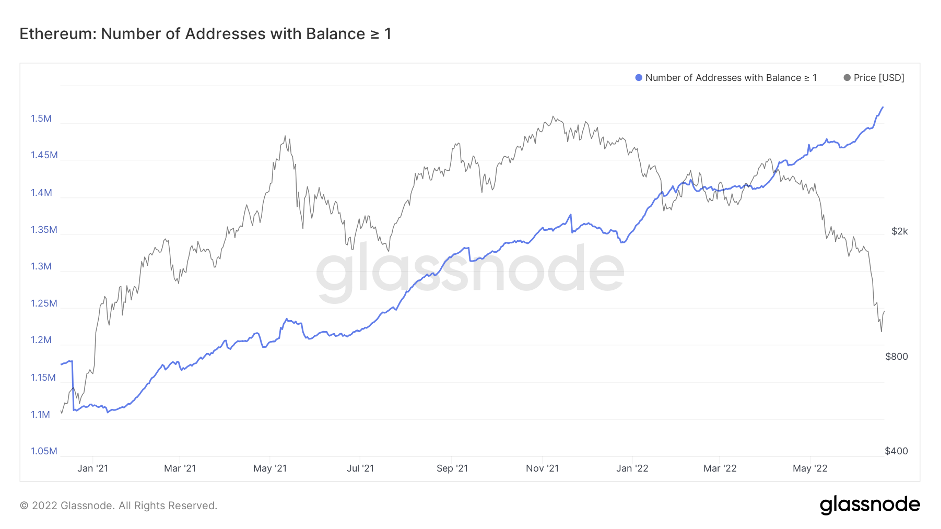
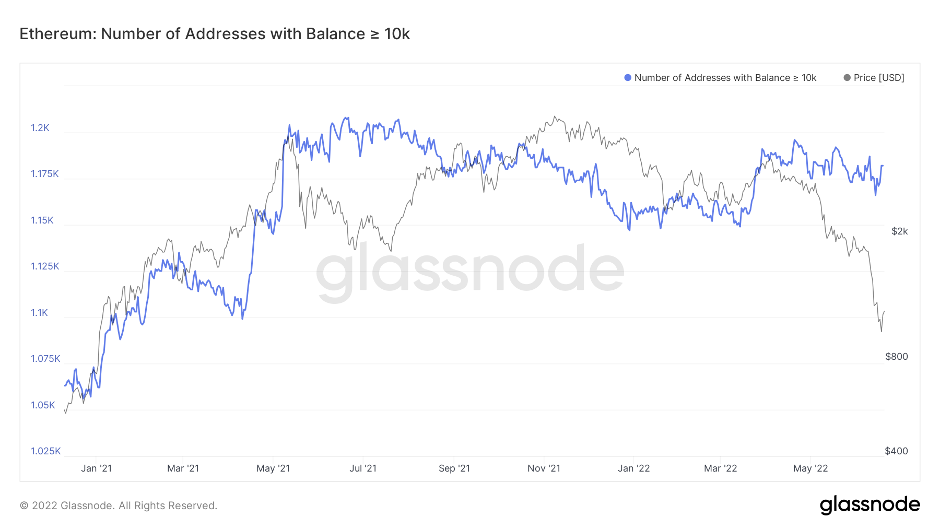
Metric 2 – Addresses
If we look at addresses for Ether, we will look at the addresses with balance > 1 Ether and addresses with balance > 10,000 Ether. We can see that the number of wallets with balance > 1 Ether has increased significantly into the market crash. However, the largest wallet holders have not purchased more Ether into the downturn, which to become bullish again, is what we would need to see.Ether – Addresses with Balance > 1 Ether
Ether – Net Unrealised Profit/Loss
If we look at the same metric for Ether, we can see that we have also begun to enter this 'red zone', suggesting we may be close to a local bottom. However, prior bear markets have shown this metric to go significantly lower. This may indicate that we have further to go, even though this metric is showing a bottom may be near.
DOT
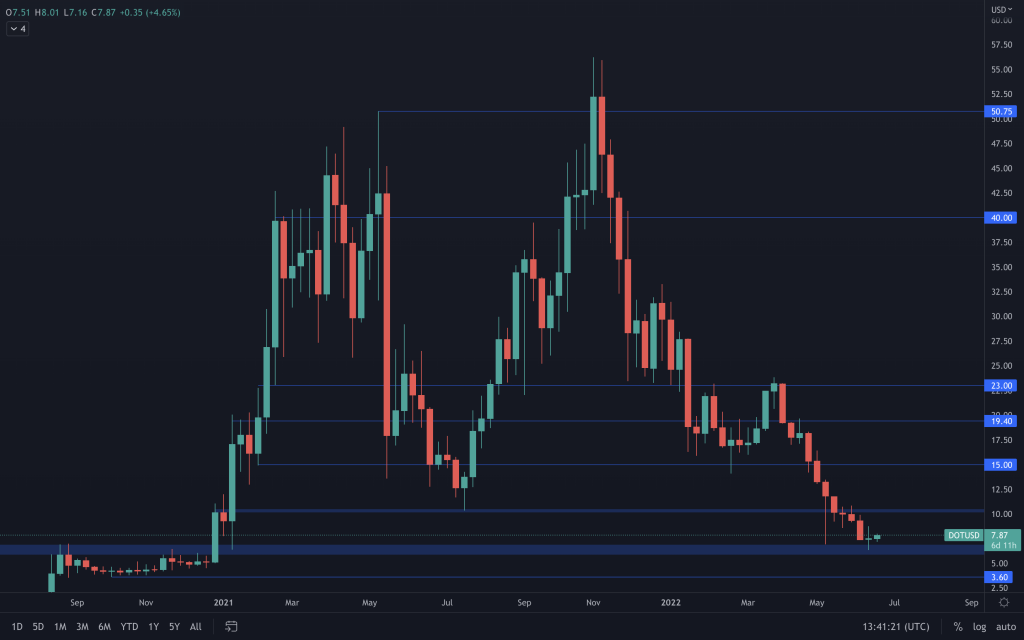
Last week saw DOT close with a doji candle as both buyers and sellers failed to make any ground. With this occuring at support, we'll be looking out for signs of a possible reversal that can push DOT back up towards $10. A continuation of downside would be confirmed if we see a weekly closure below $6.50.
SNX
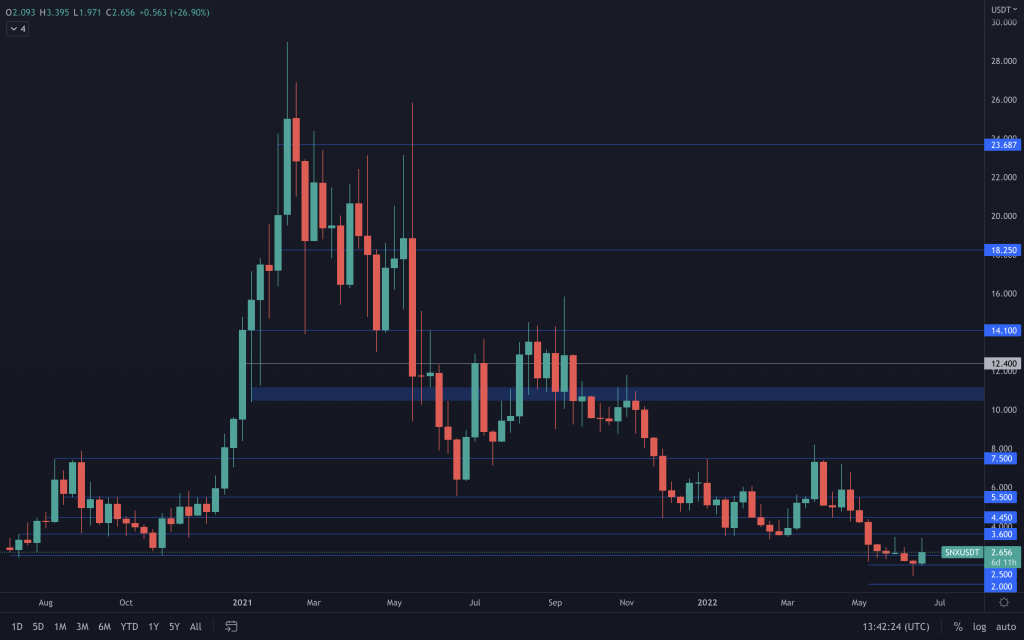
SNX closed out last week with a bullish hammer. A green closing hammer would have shown better strength by bulls, but they managed to protect the $2 level by the weekly close with a daily bullish engulfing candle. As a result of that, and Synthetix announcing that they had hit $200M+ in daily volume, SNX has now pushed up above $2.50 - the level that protected it from all-time lows for one month. We'll need to see this strength sustain and $2.50 turned back into support by a weekly close. But that will require SNX to break above its resistances on both its BTC and ETH paired charts.
RUNE
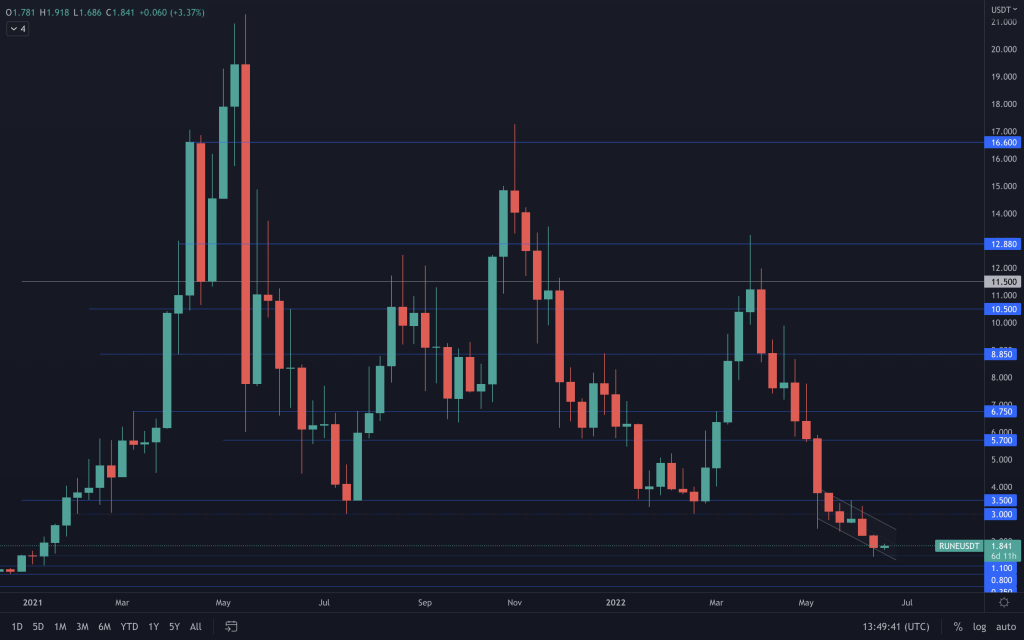
THORChain's move to mainnet has had little impact on price so far. It continues to slowly decline since losing $3.50 - a level that we'd want to be reclaimed to offer any kind of bullish argument. With it still grinding its way down, we look towards the $1-$1.10 area next.
SOL
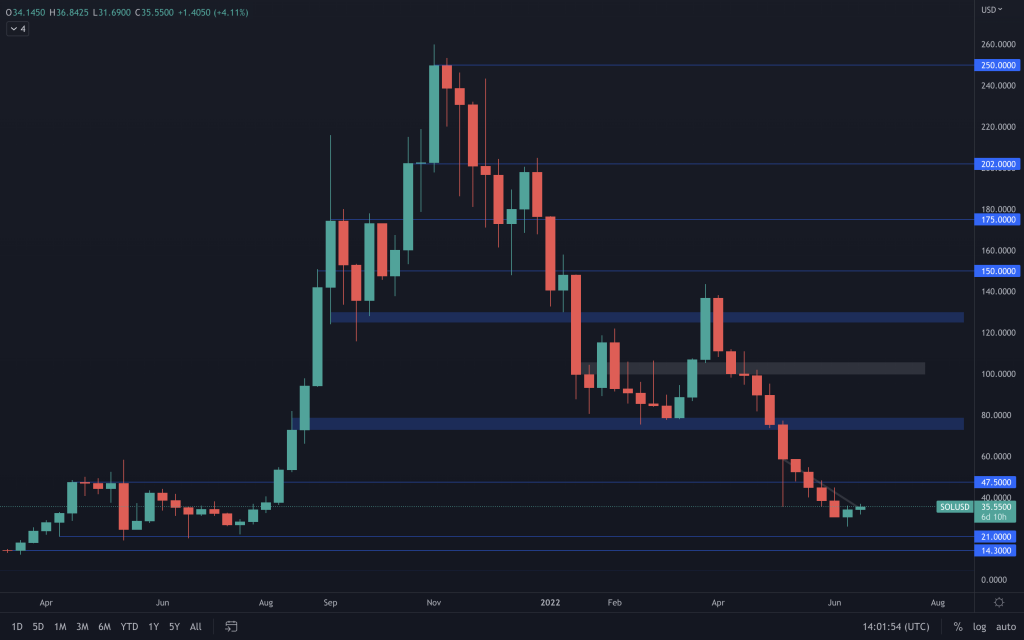
After 10 weeks of red for SOL, there's finally a green candle! It hasn't come from a major support level, but may offer SOL some relief from the downside - monitoring the daily timeframe will help here. $47.50 remains our level of interest for a reclaim, otherwise it'll simply remain in down-mode, with $21 coming in as its support.
SRM
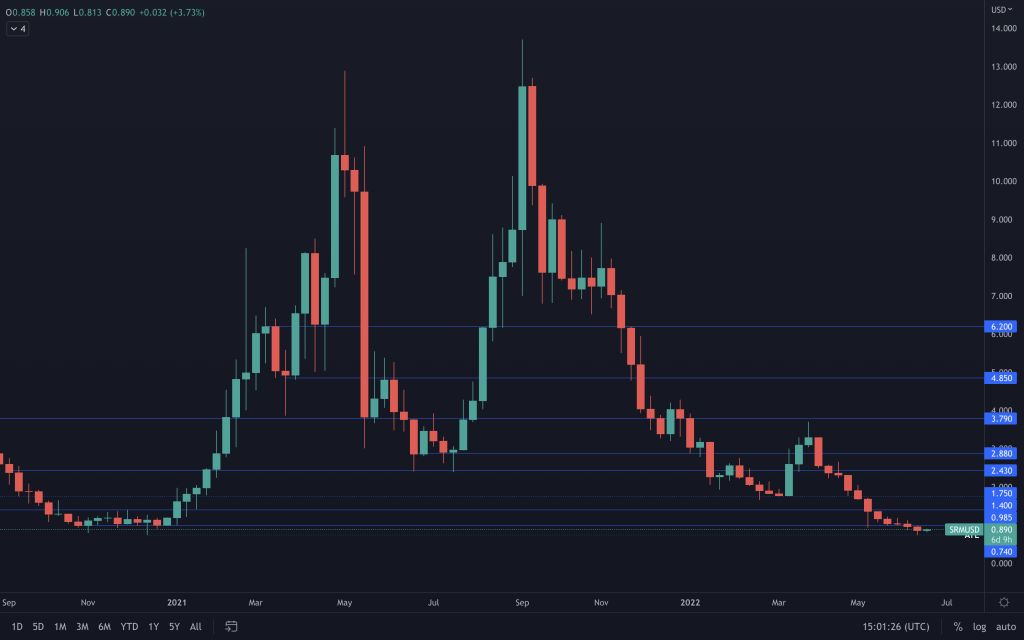
SRM continues to decline, but it has avoided falling into all-time low territory. With it now mid-range, we'll require a weekly closure above $1 to expect any further price appreciation, or a closure below $0.74 to see it continue down, where we'd look toward $0.50 next.
FTT
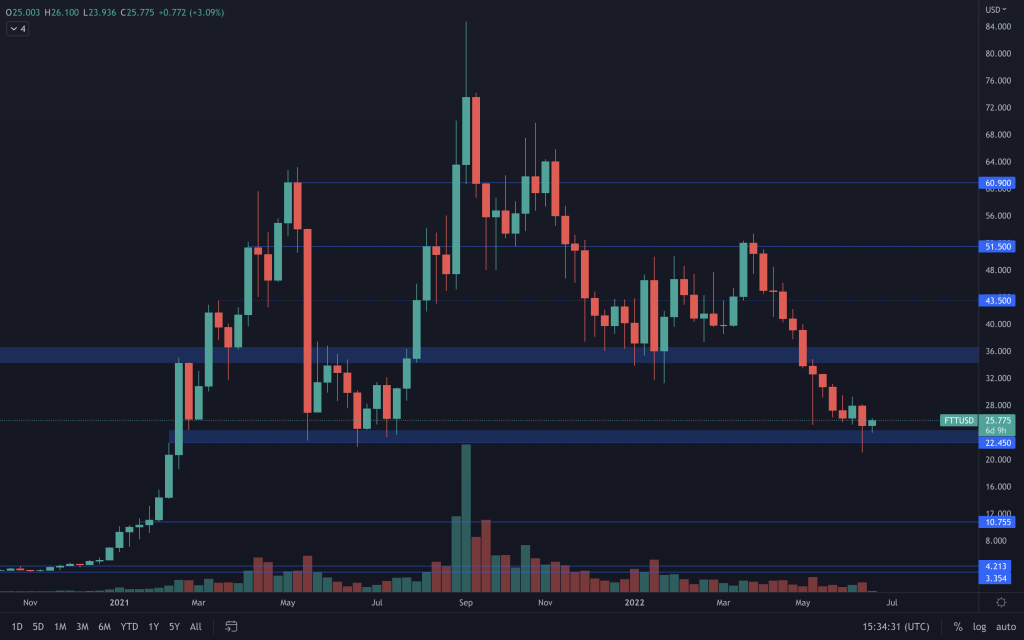
FTT is an interesting one. It's weekly FTT/BTC candle closed above a significant resistance that should see FTT outperforming Bitcoin over the upcoming week. So, if it looks like there's upcoming positive price action from Bitcoin, FTT would certainly be one to watch.
MINA
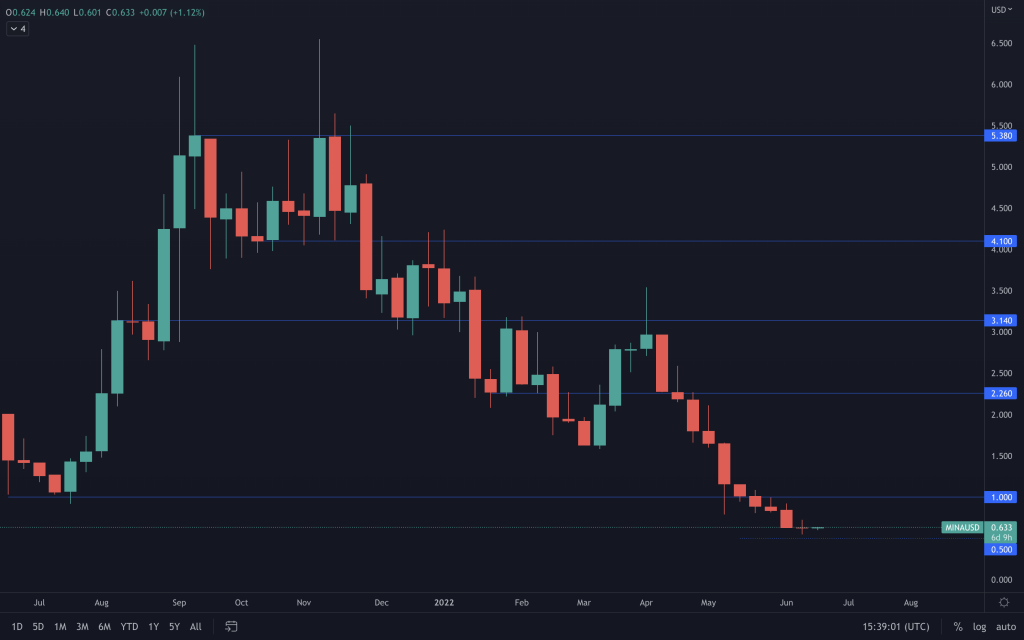
Another doji candle that slowed MINA's decline. But the daily timeframe has yet to show any positive price action. Should we see it, we'll be sure to mention it. But until MINA looks like it's forming a bottom, or closes back above $1, it continues to look bearish with the psychological $0.50 level yet to be met.
dYdX
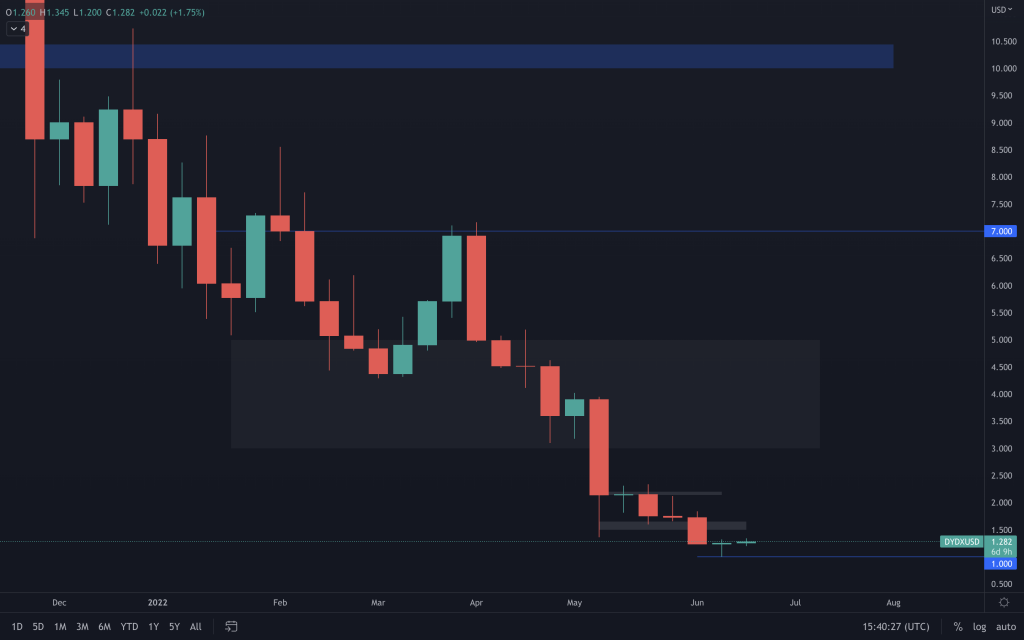
dYdX closed the week strong with a tap and go from $1, rising 25% from its bottom to close the week as a dragonfly doji. If yesterday's candle is anything to go by, we should see dYdX pushing up towards $1.50. But, for all assets, we have to remain cautious with it being the first trading day of the week for american stocks tomorrow. Any bearish sentiment coming across will very likely have a negative impact on the crypto market too.
Summary
For some months now, we have been commenting that even though prices were low, many of the on-chain metrics suggested there may be more room for prices to decline further. When you overlap this with the macro data/situation, it looked increasingly likely that we would go lower. We have now begun to see many metrics we were actively assessing reach the targeted levels we had been commenting on. Whilst the macro remains negative (continued aggressive monetary tightening policy), prices will likely continue to struggle. However, once the macro begins to ease, it may be worth considering a dollar-cost-averaging approach now that many on-chain indicators are at the targeted low levels we were looking for.
Recommended from Cryptonary


