Save 23% ($351) & Get a Free 1-1 Call with our Team ⏰ : 0d 2h 59m 44s
Market Analysis
Weekly Technicals Pro - Volume 73
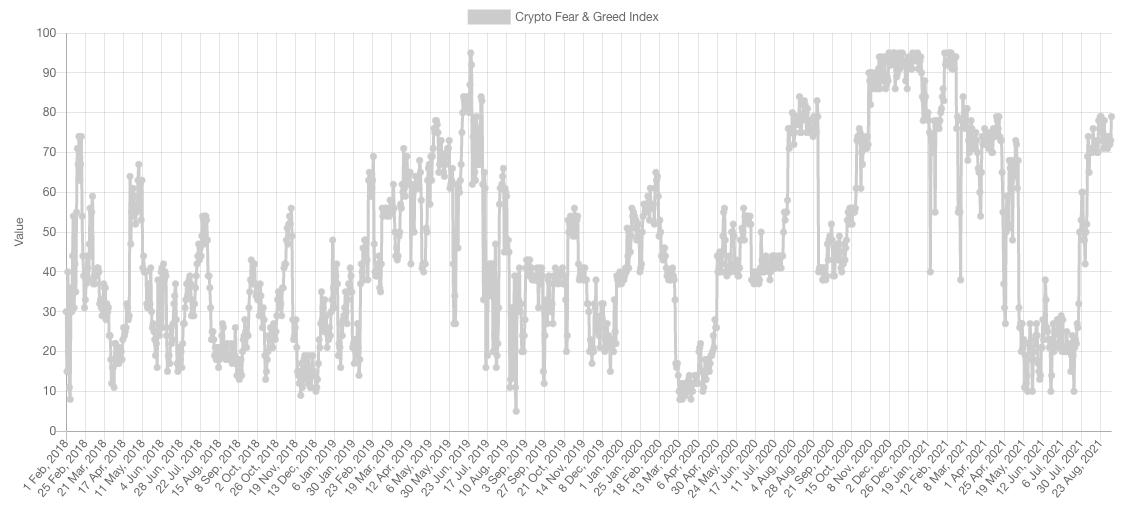
The sentiment is at Extreme Greed but not near the extremities where it's a clearer signal - as we saw in April/May 2021. Nonetheless, as we've previously explained, sentiment is often misunderstood just like the RSI. When either of these indicators reach extremities, what it does is accentuate/accelerate momentum towards that side of the market - with a caution alert that the market is overheating.

Market Sentiment
Market Indexes
Total Market Cap
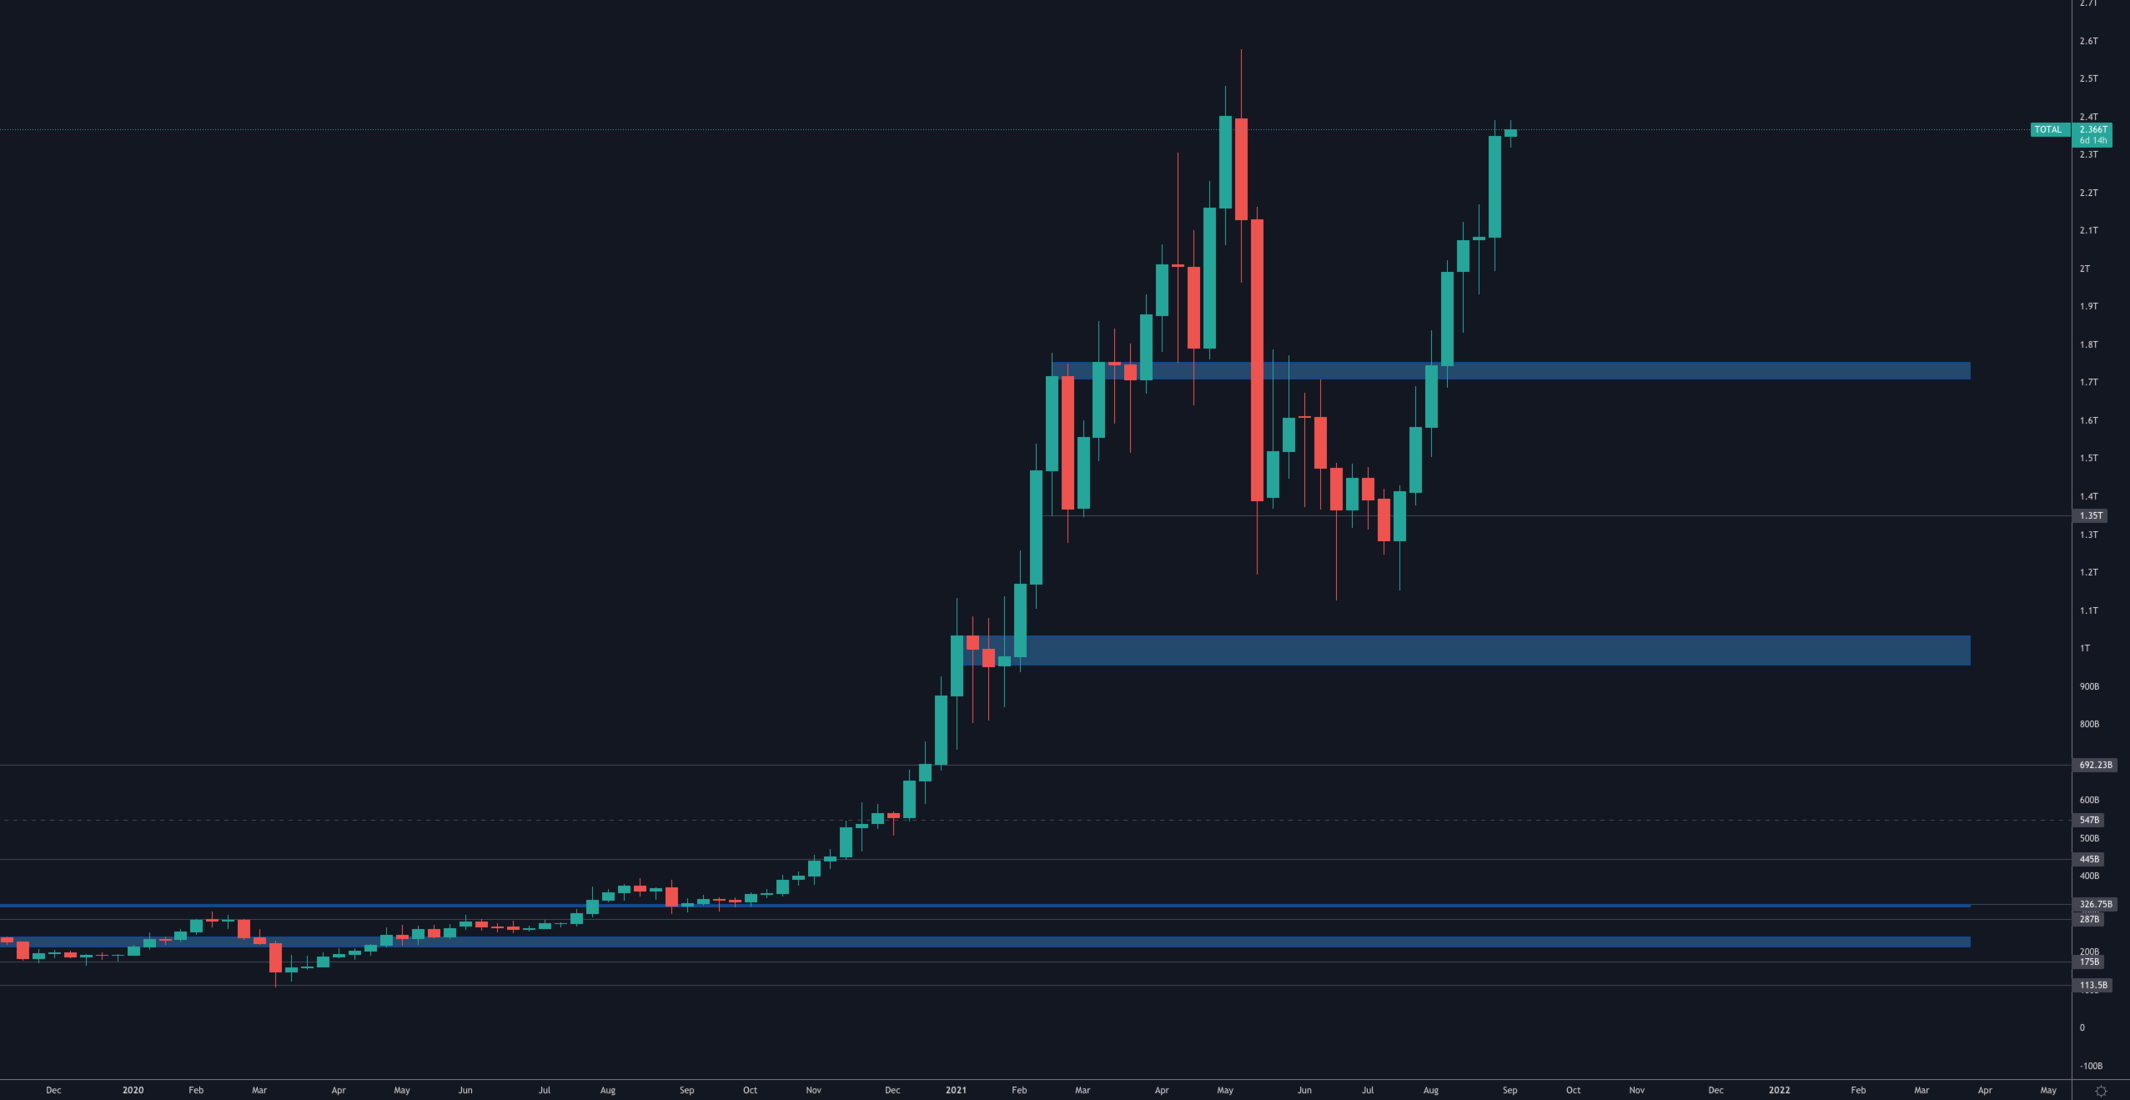
The Total MCap reclaimed $1.7T and then rallied towards $2.5T exactly as expected. For now, $2.5T represents a level of resistance - until it is broken out of. If a breakout occurs then further price discovery is on the cards for this index.
Altcoins' Market Cap
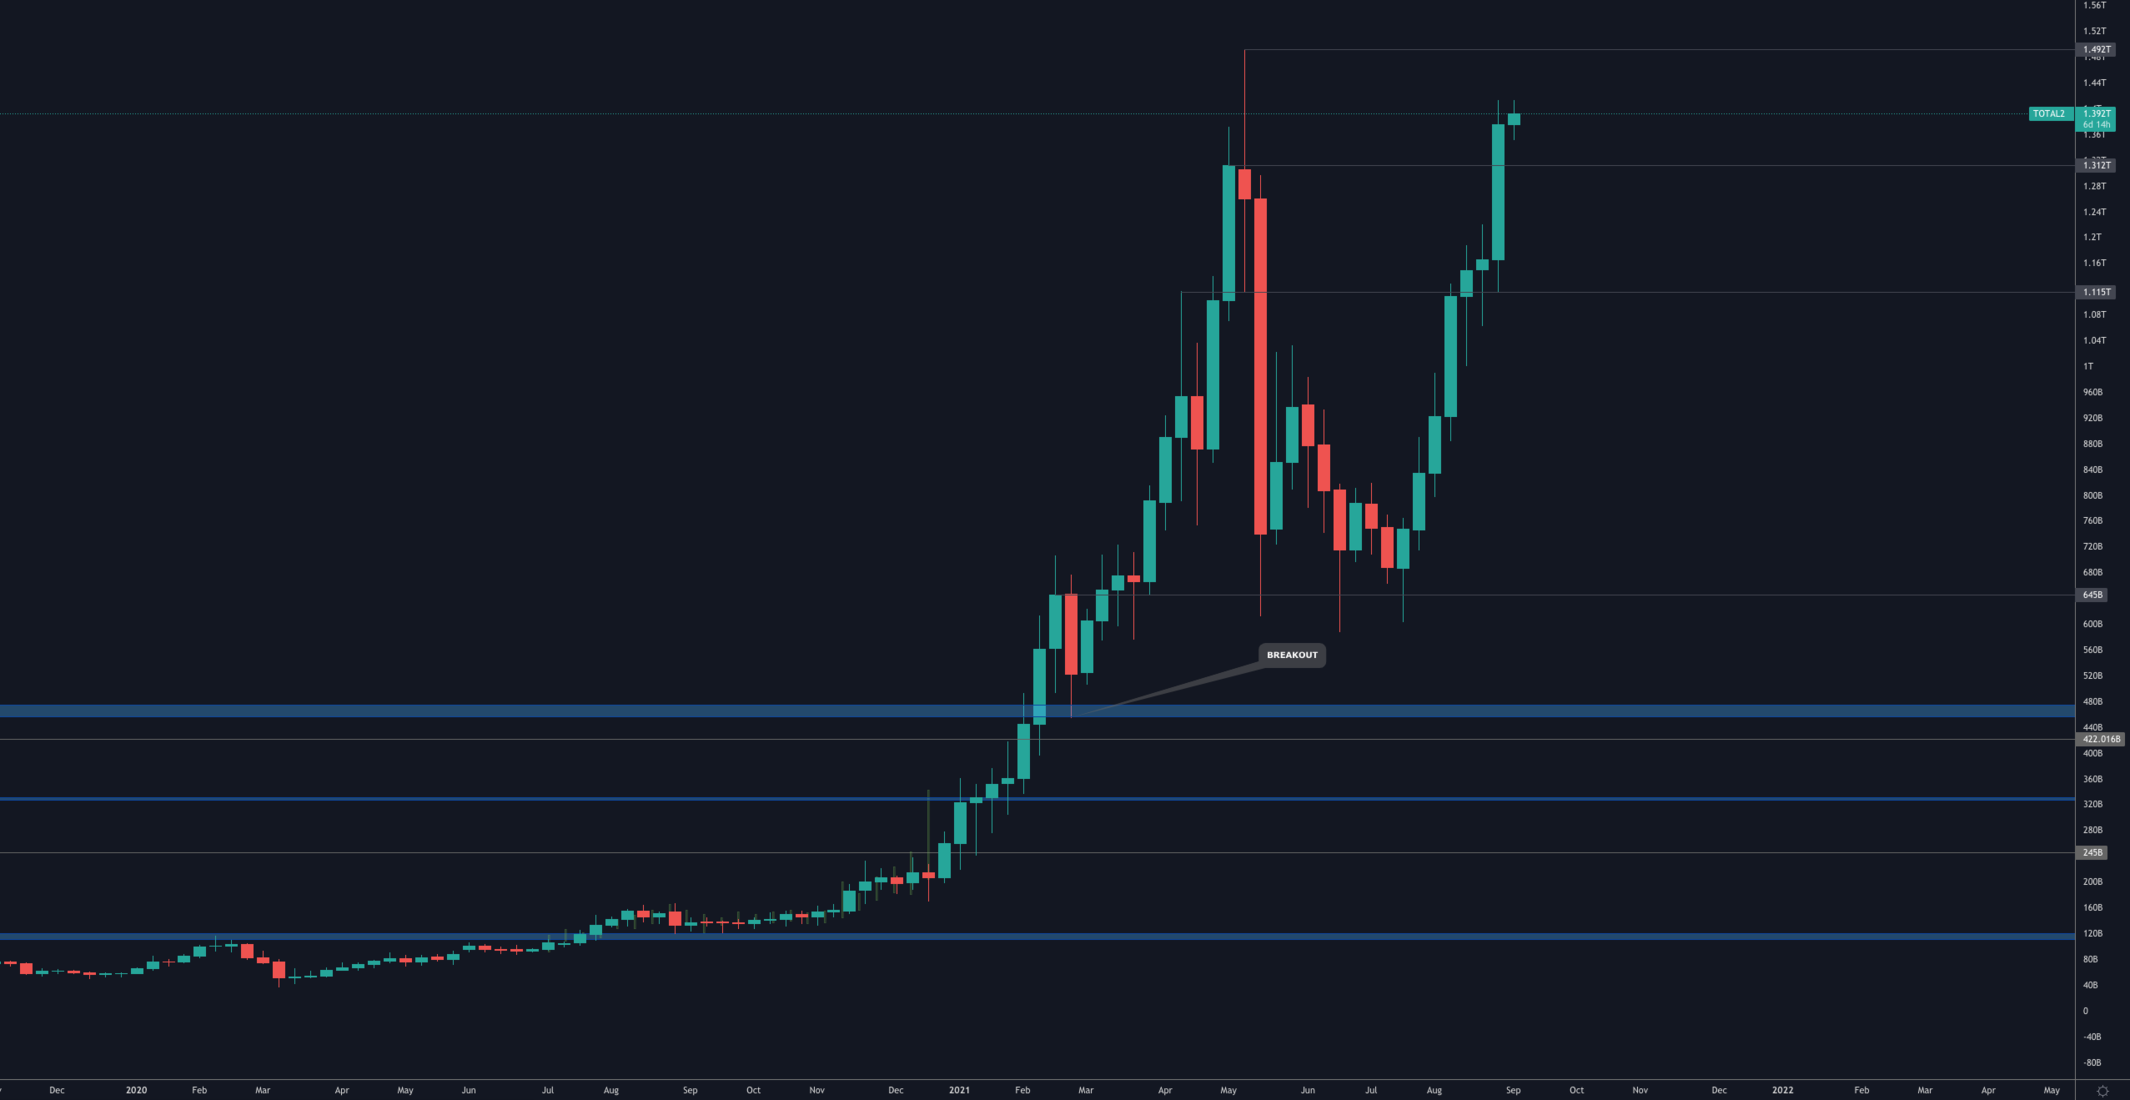
The Alts MCap registered a new candle closure high on the weekly timeframe which now turns $1.31T into support.
Bitcoin
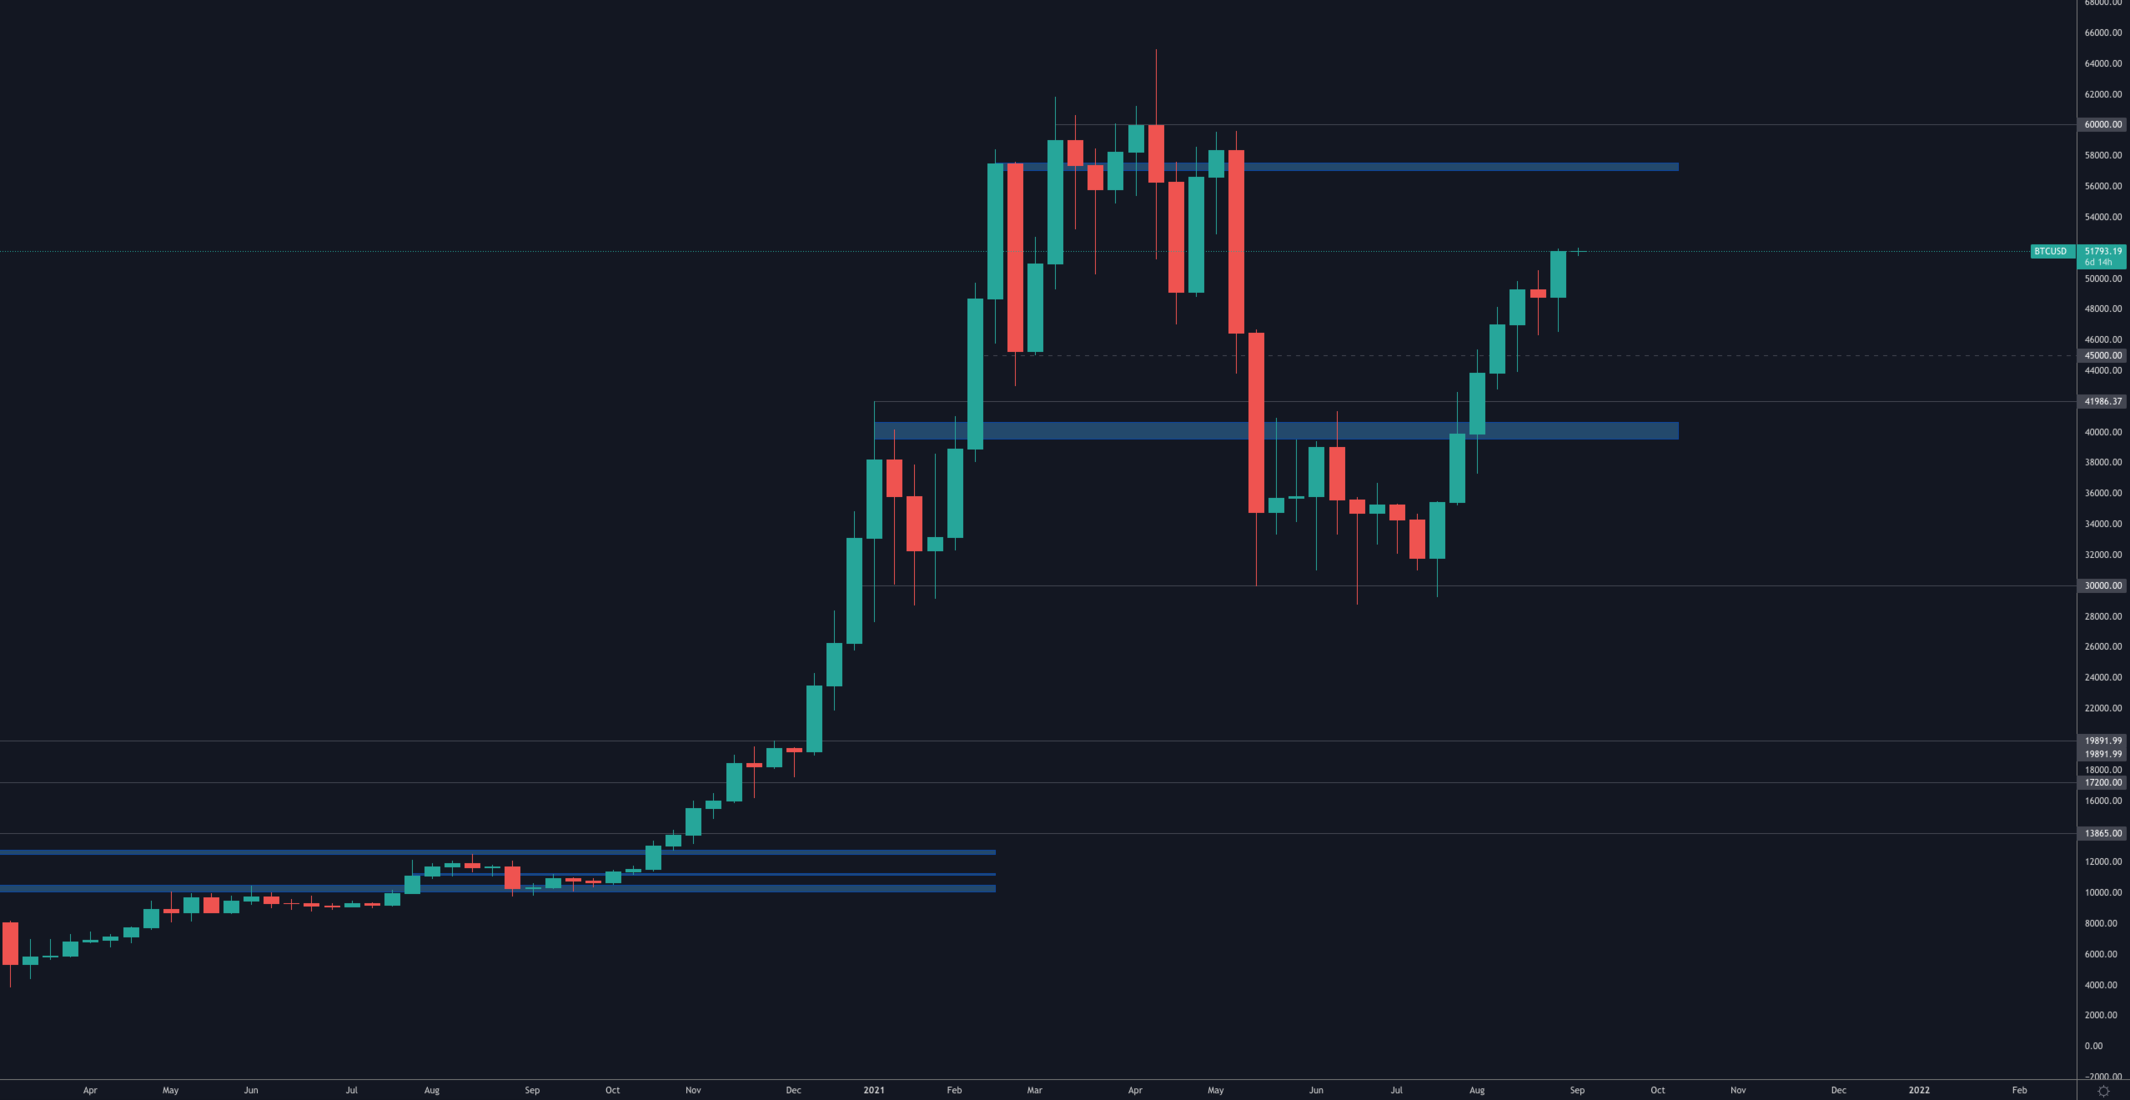
Bitcoin rallied into the weekly candle closure and created a new intermediate high while simultaneously turning $50,000 into support and maintained a target of $57,000.
Ether
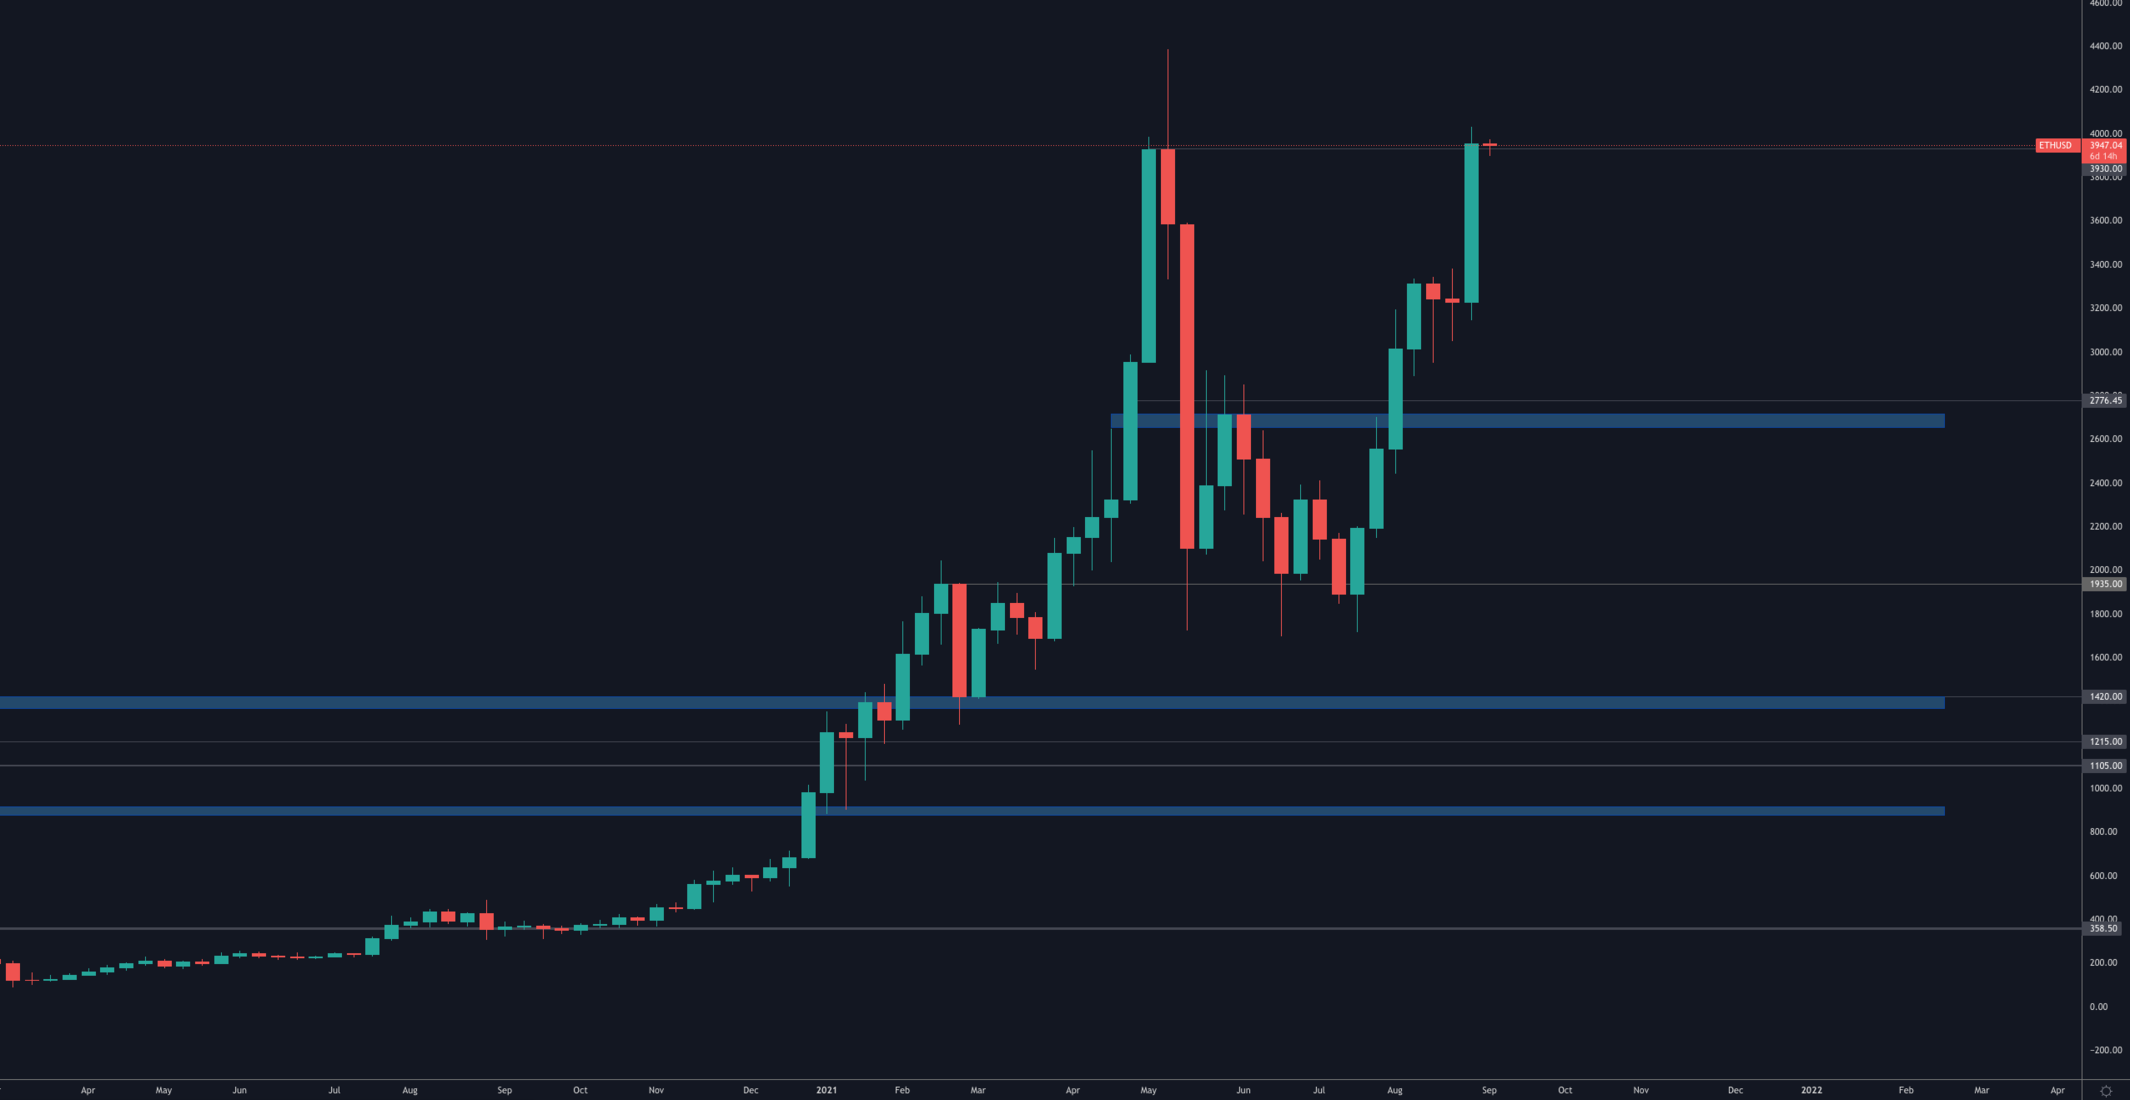
ETH registered a subtle but valid new weekly candle closure high which turned $3,930 into support on this timeframe and has a target of price discovery (i.e. round psychological numbers).
DOT
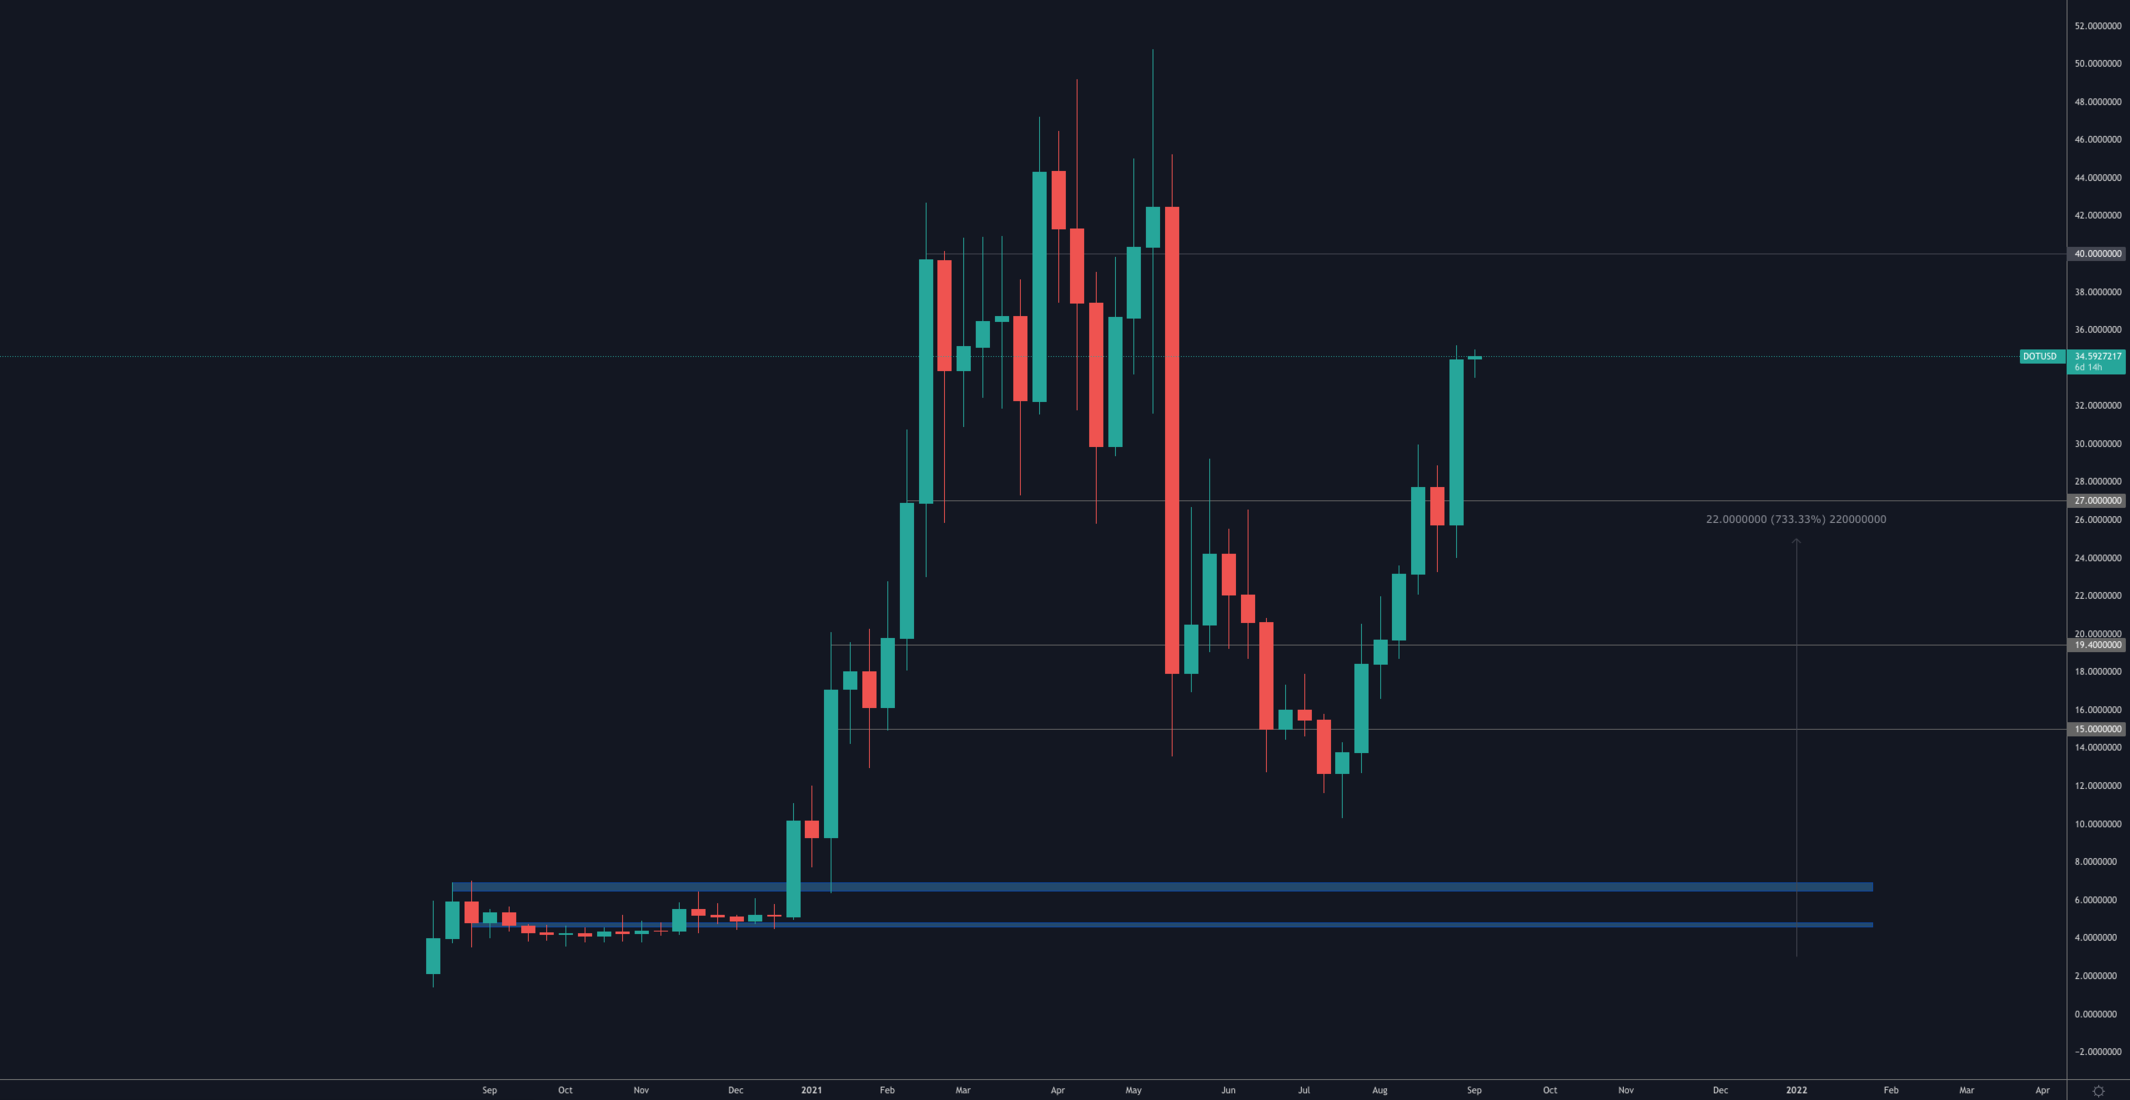
Still en route for $40 and has support at $27.
SNX
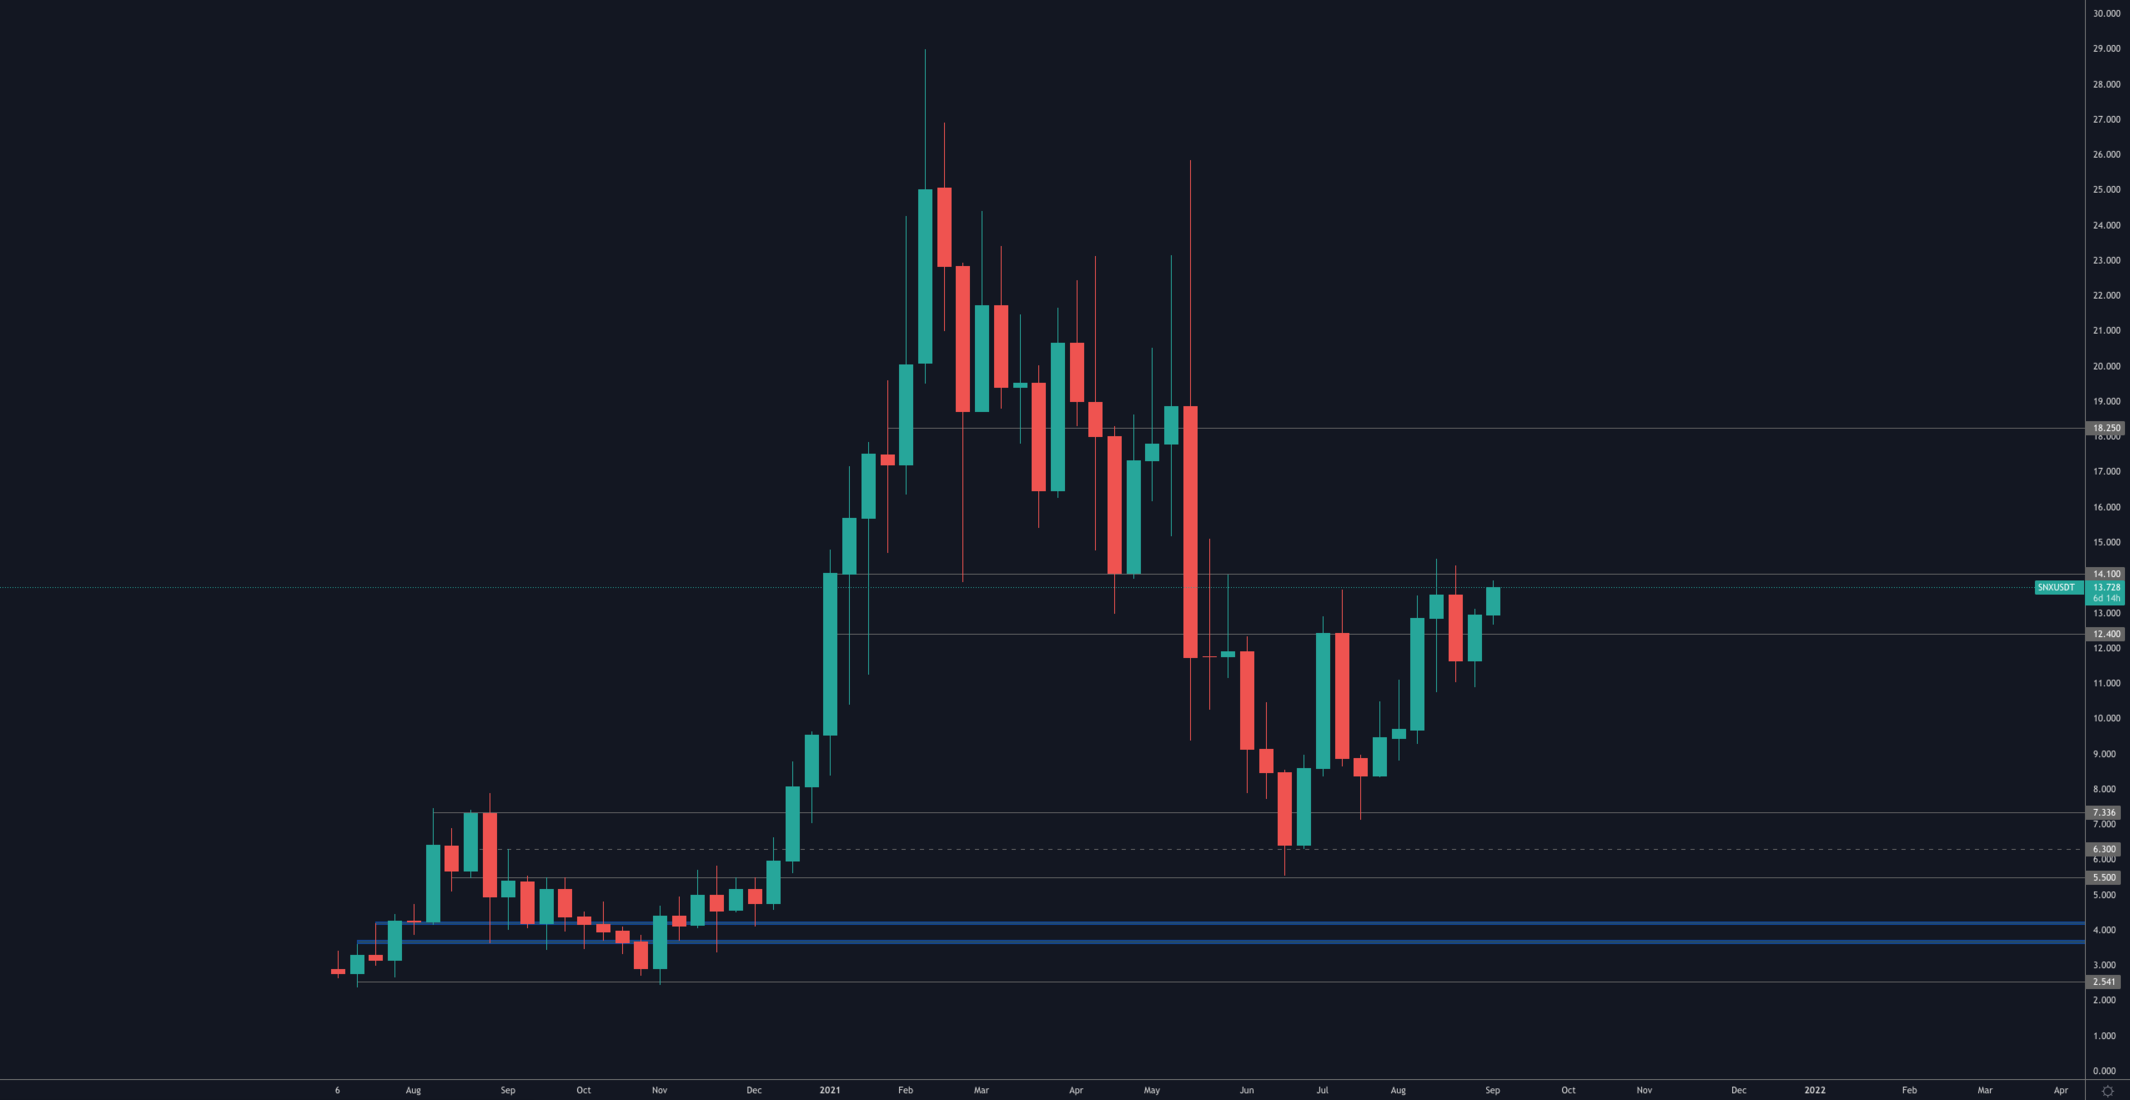
Consolidating price action that is registering higher lows on the weekly timeframe which communicates a likely impulse to the upside in the coming weeks - as long as that market structure doesn't break with the creation of a lower low under $11.50 on the weekly timeframe.
RUNE
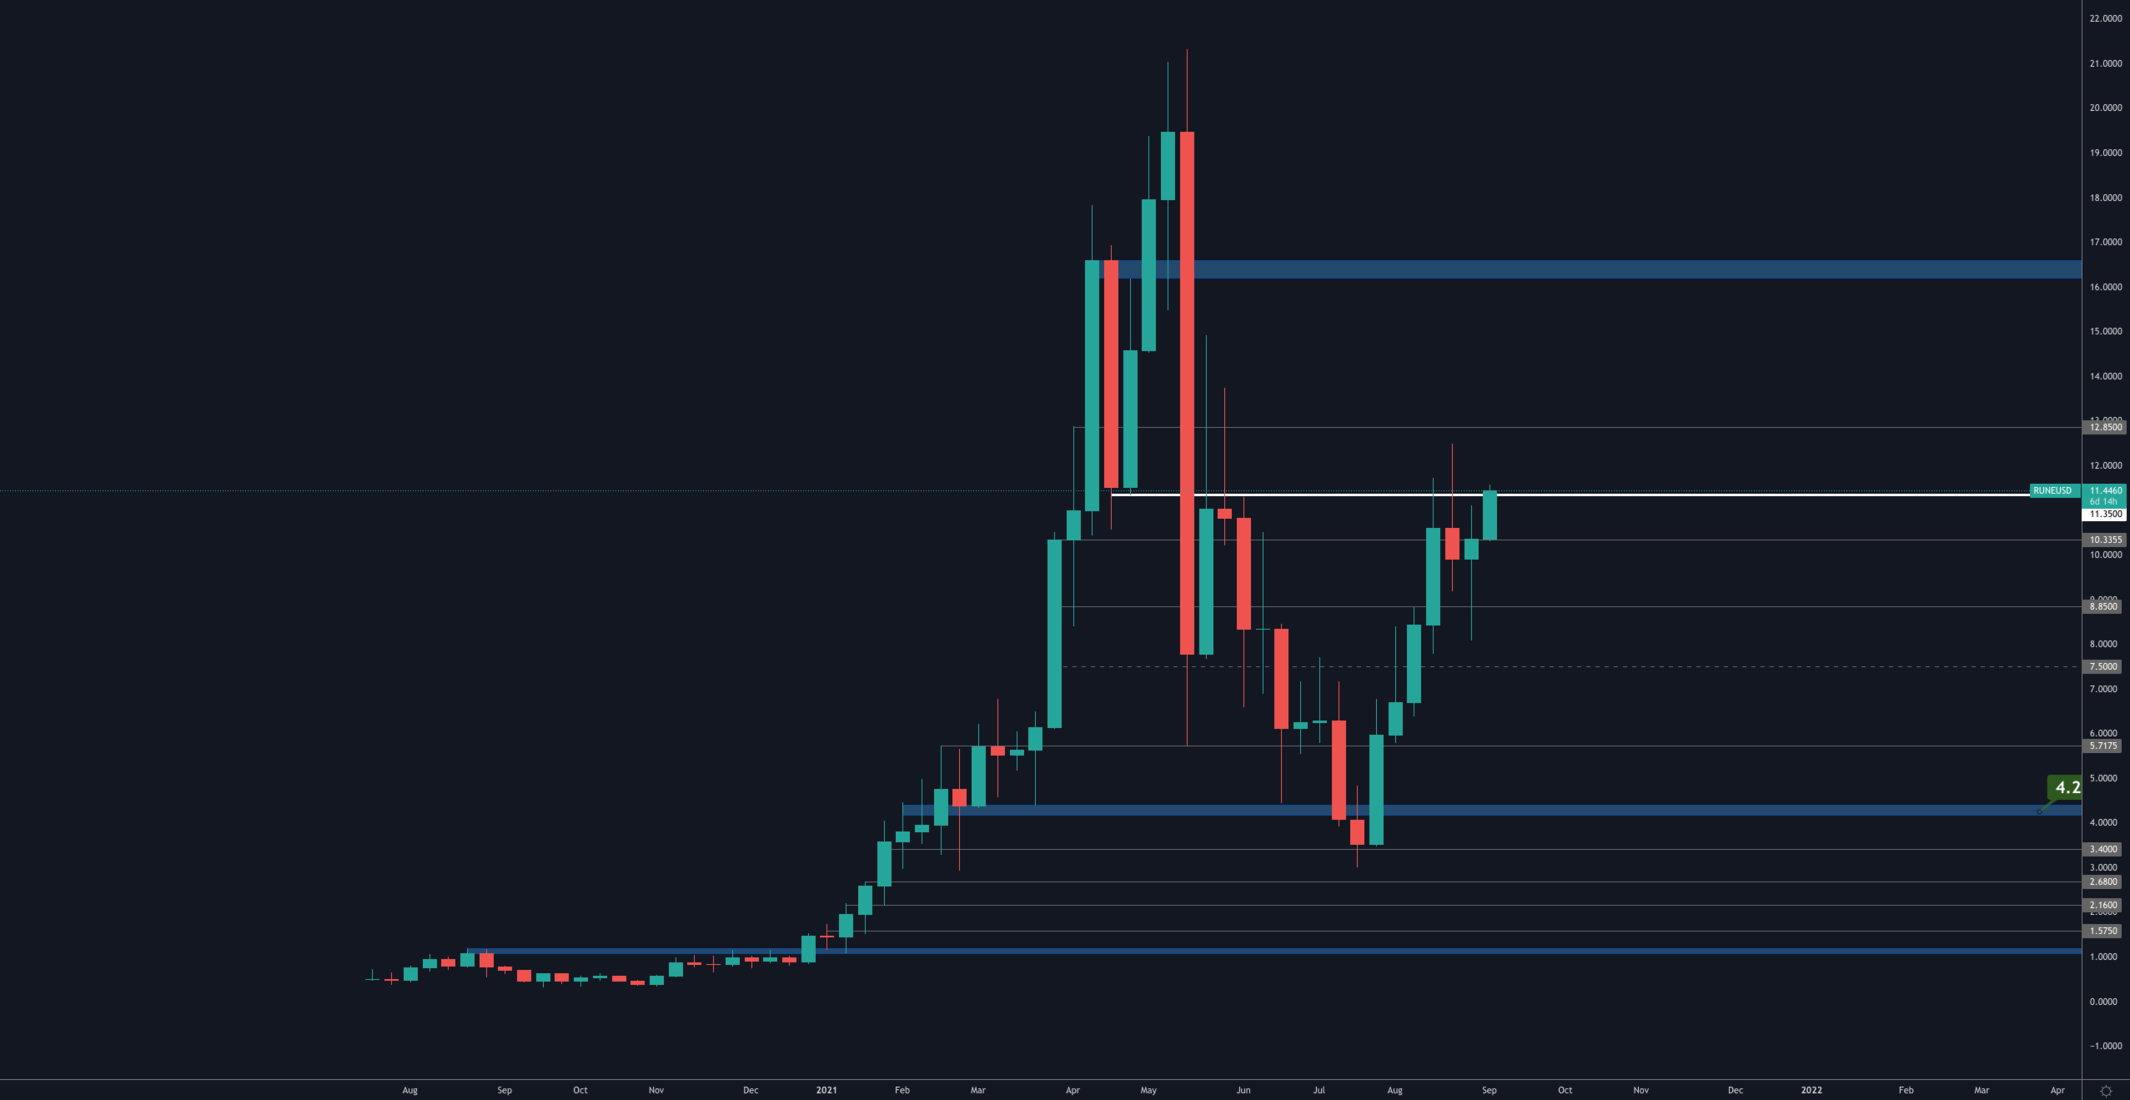
Same story, no changes, RUNE remains in a bearish market structure on the weekly timeframe until a reclaim of $11.50 occurs on that timeframe.
SOL
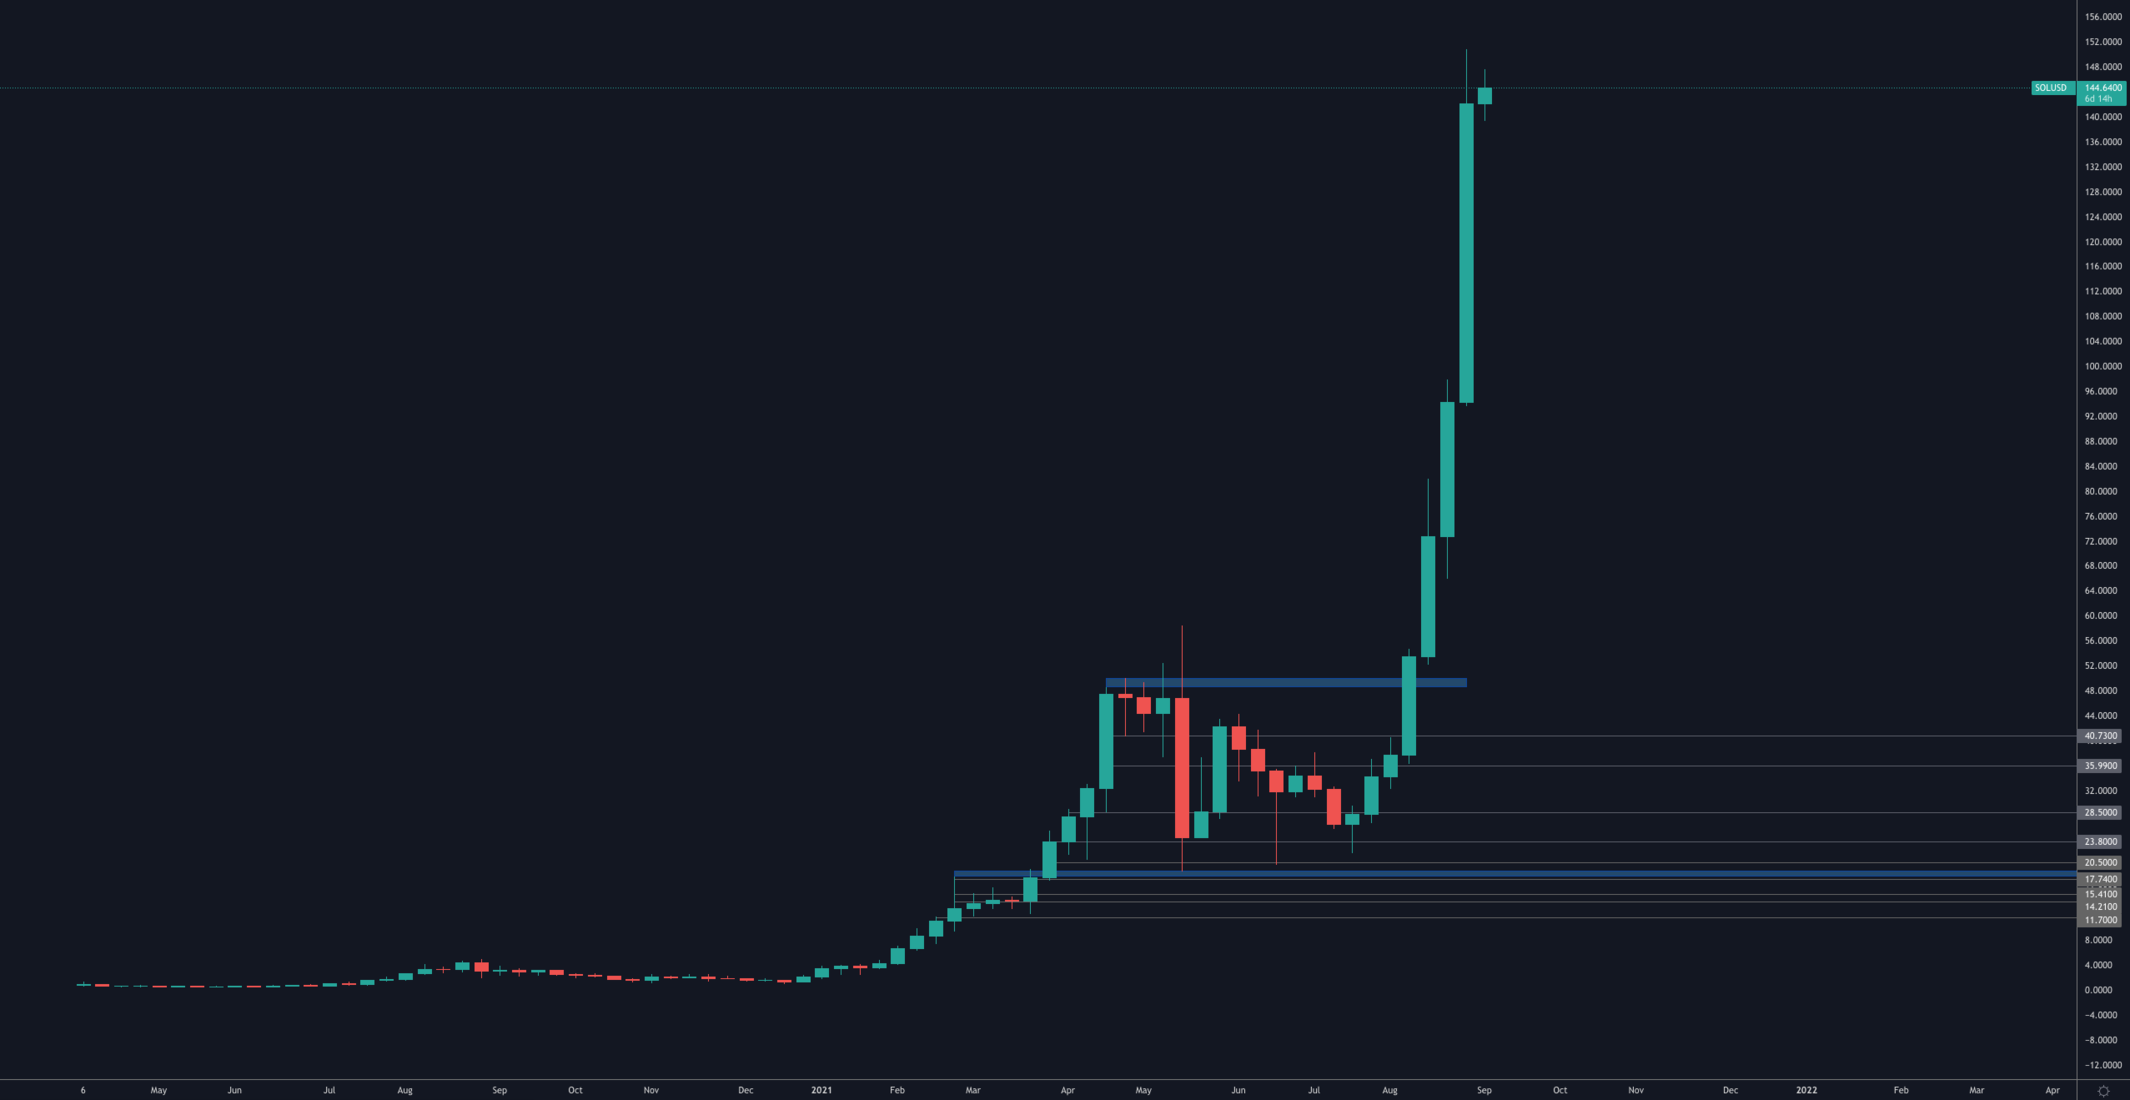
The weekly chart is literal up only, we'd be lying if we said a vertical green chart can be analysed in price discovery (on the weekly) before a consolidation occurred. What we can say is that the momentum has not yet shown weakness.
SRM
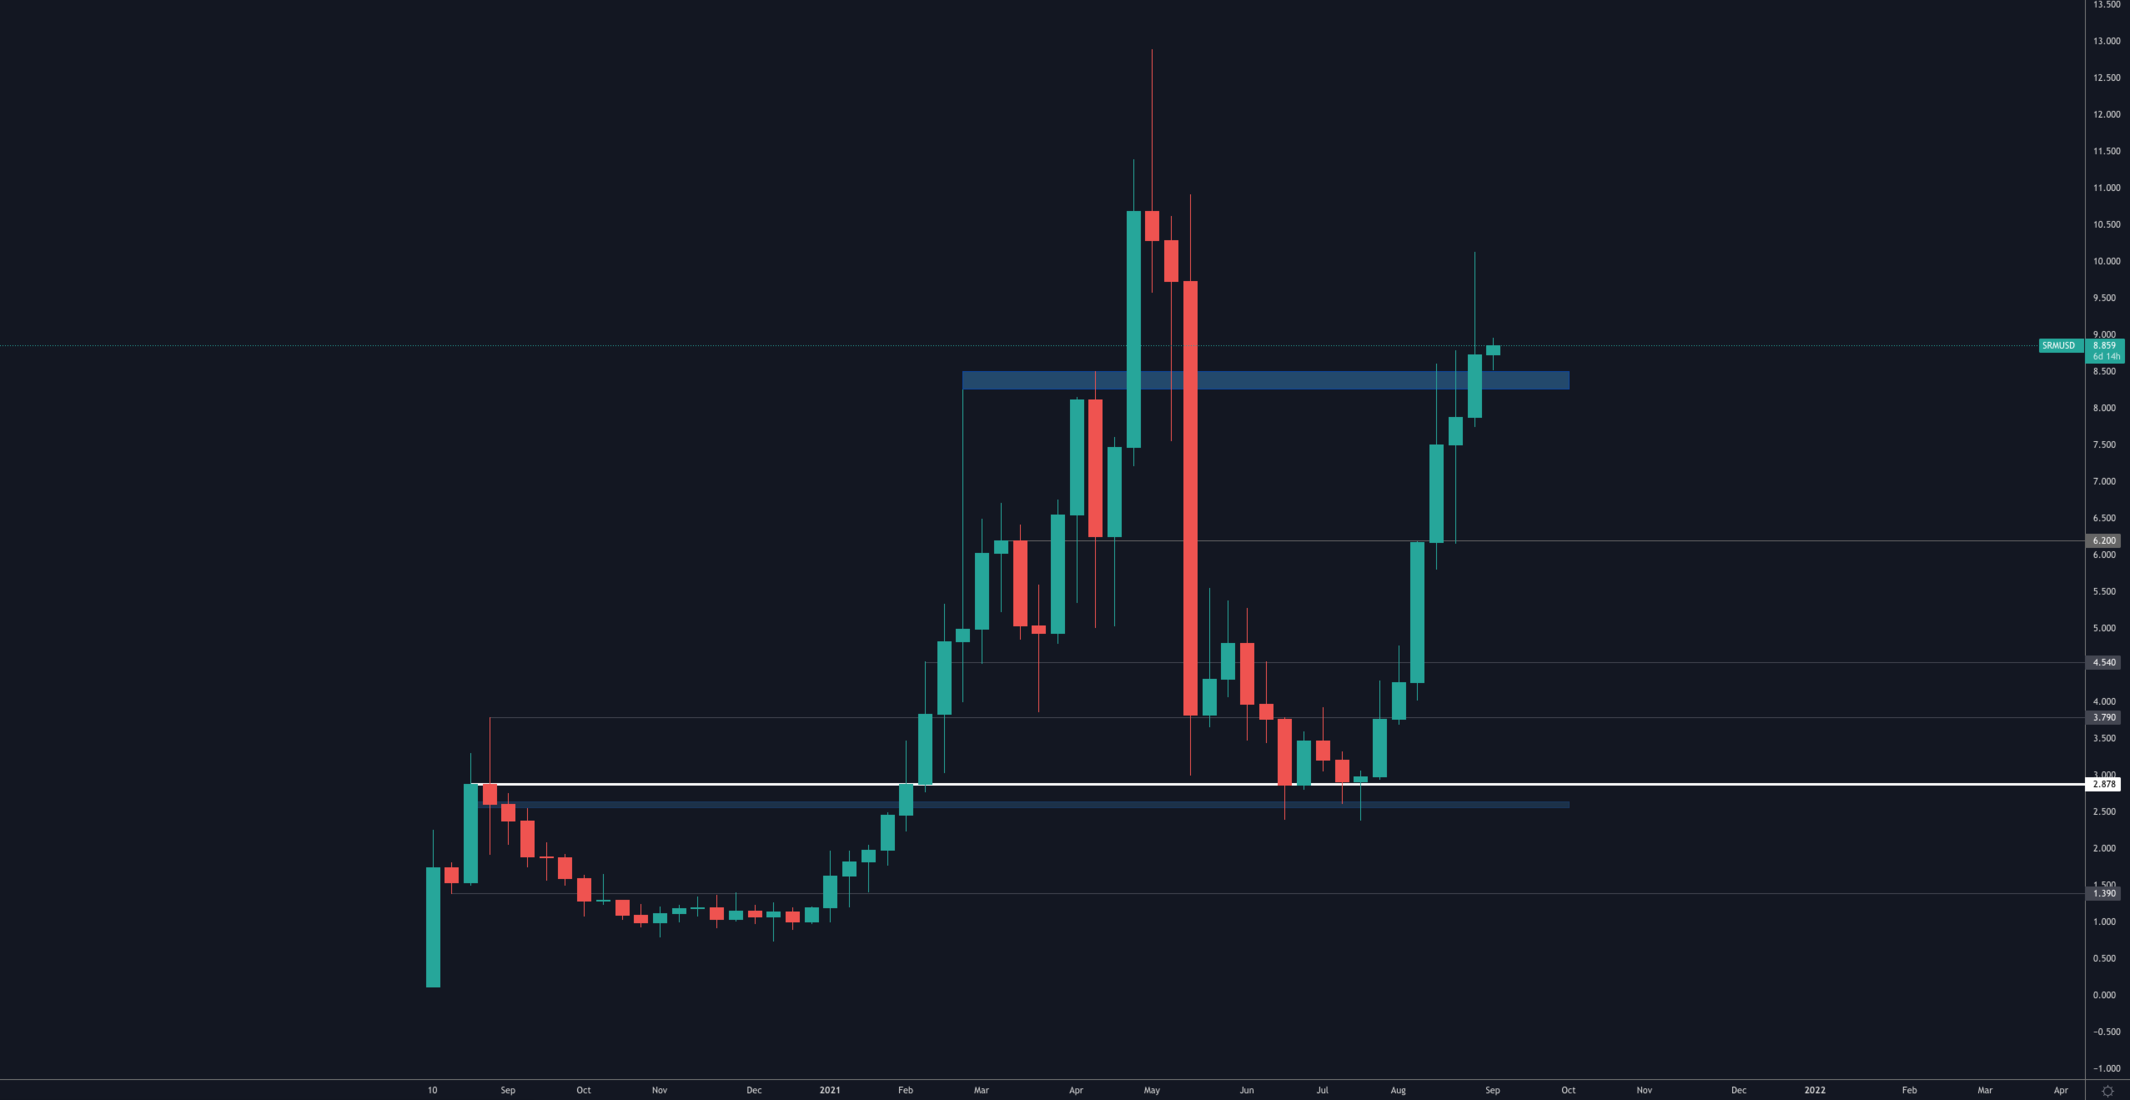
Reclaim of $8.50 which maintains the same target of $13 as long as the former holds.
FTT
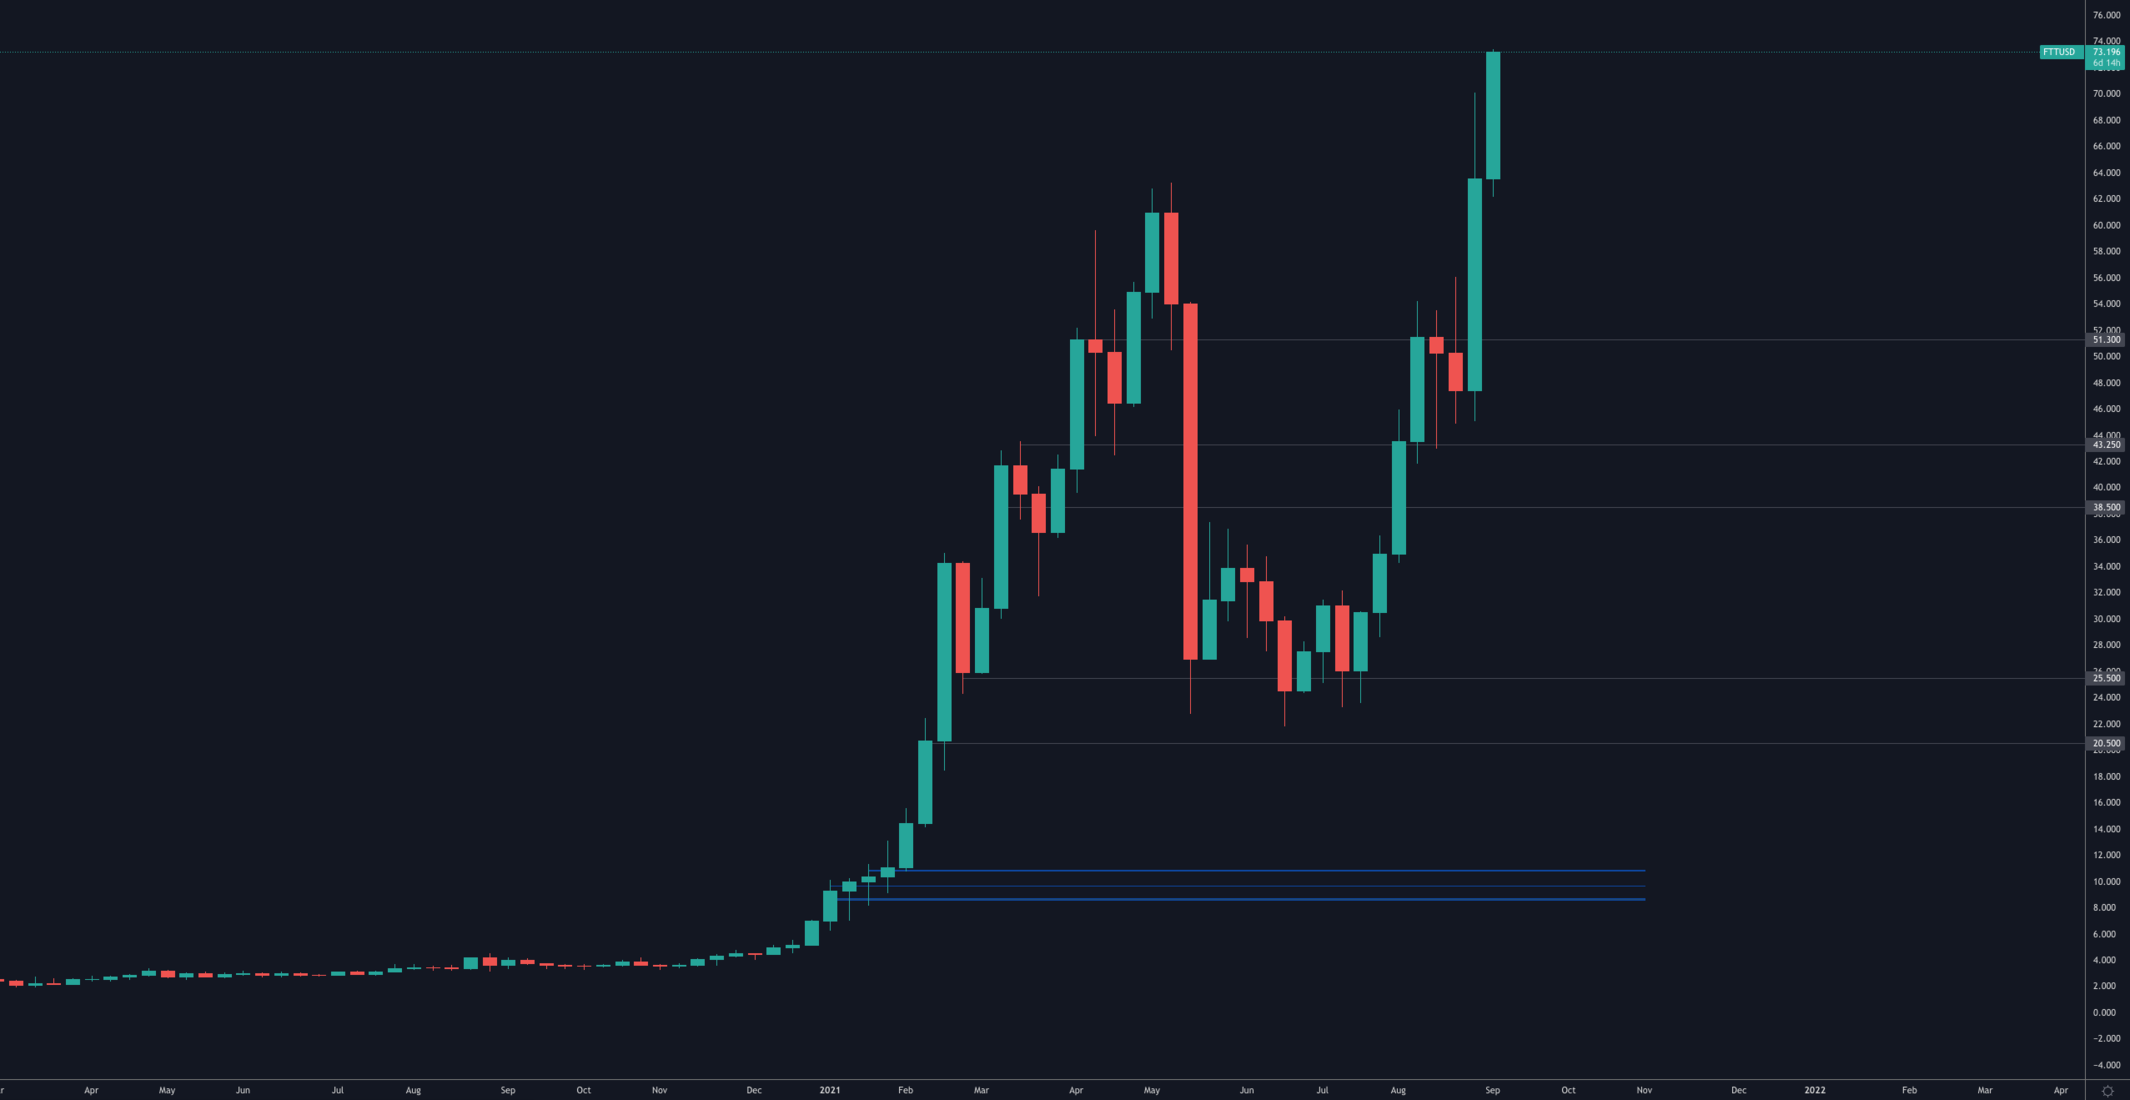
Rally into price discovery where targets are round psychological numbers.
MINA
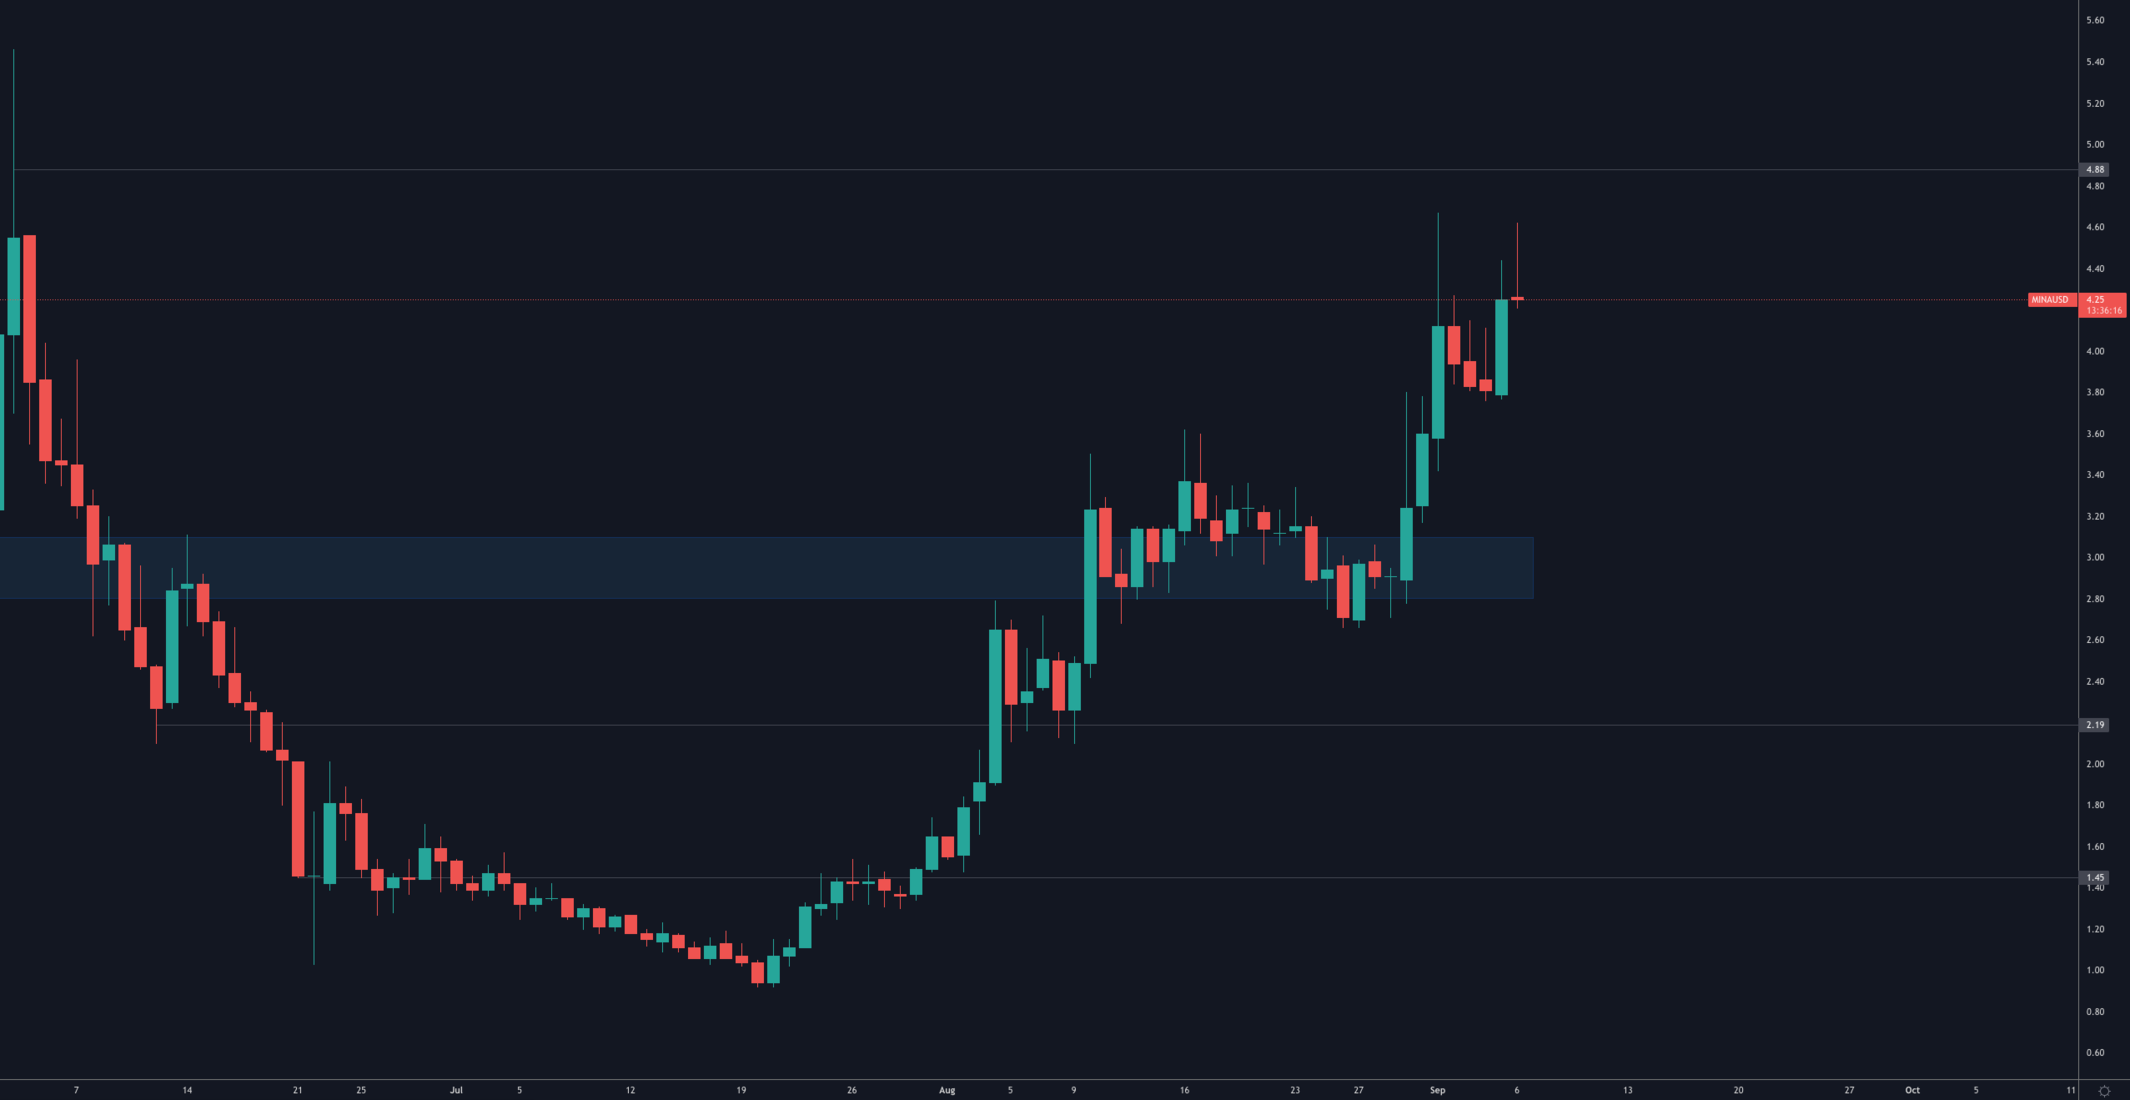
Minimal weekly data hence why we must analyse the daily. Price action is setting higher highs and higher lows - denomination of a bullish market structure - with resistance at ~$5 and support at $3.10.
Recommended from Cryptonary


PRO
Market Direction
11 min read
Mar 24, 2026

PRO
Market Updates
8 min read
Mar 23, 2026
PRO
Market Direction
13 min read
Mar 20, 2026
