Save 23% ($351) & Get a Free 1-1 Call with our Team ⏰ : 0d 2h 59m 44s
dogwifhat (WIF) price prediction
DogWifHat price prediction is driven by its unique meme theme and growing community, with the coin reaching an all-time high of $4.7343. With its price subject to viral trends and market sentiment, staying informed on its forecast is key for any investor.
We at Cryptonary provide you with the most accurate price prediction for all sorts of coins, including Dogwifhat. You can also request an on-demand WIF price prediction by joining our Discord Community.
Our Price Prediction Model
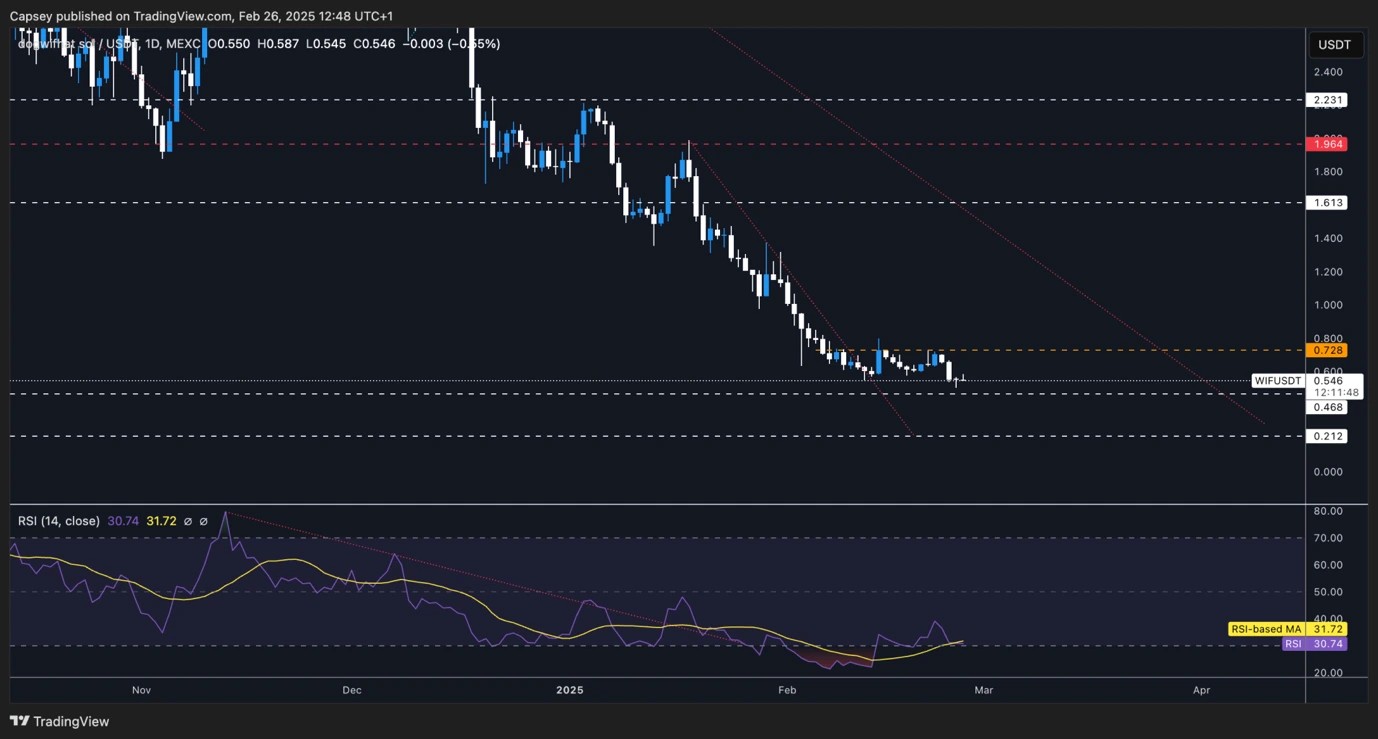


WIF consolidates between $2.84-$2.97
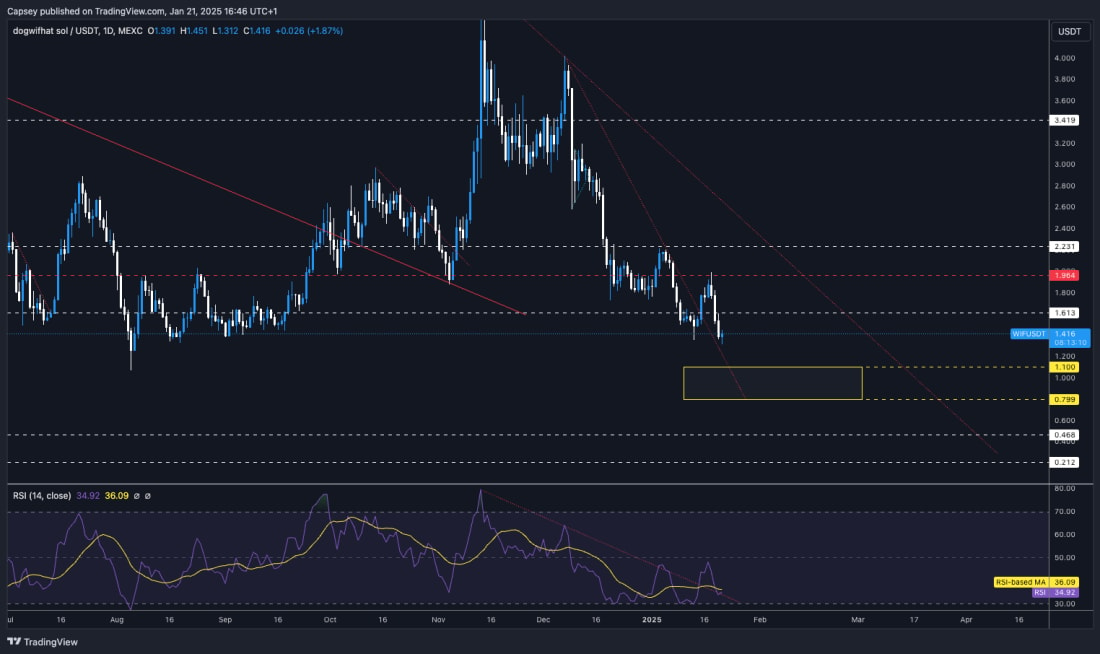
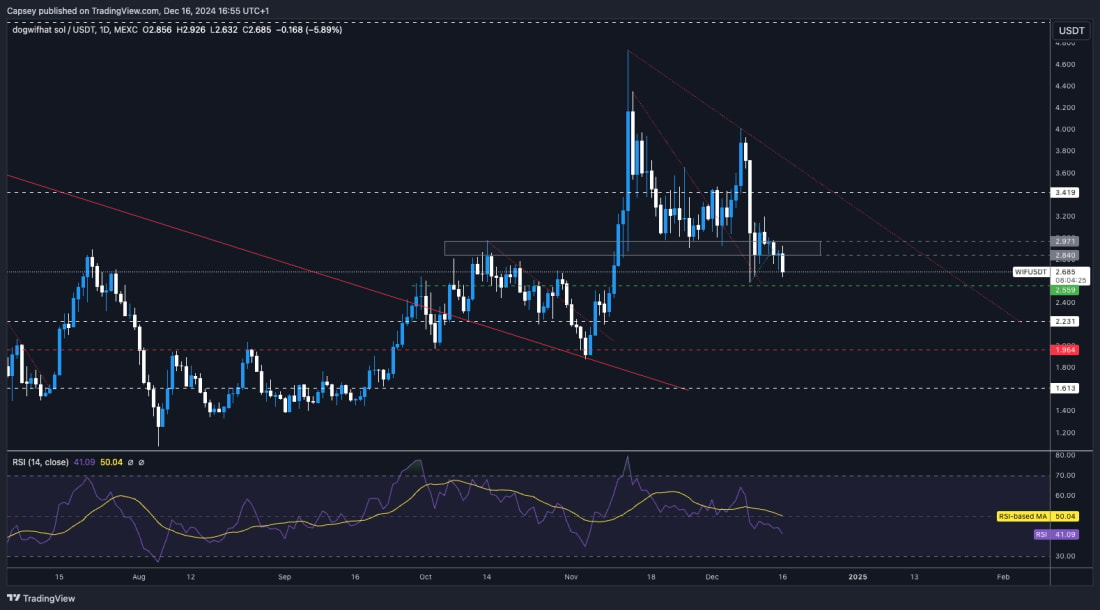
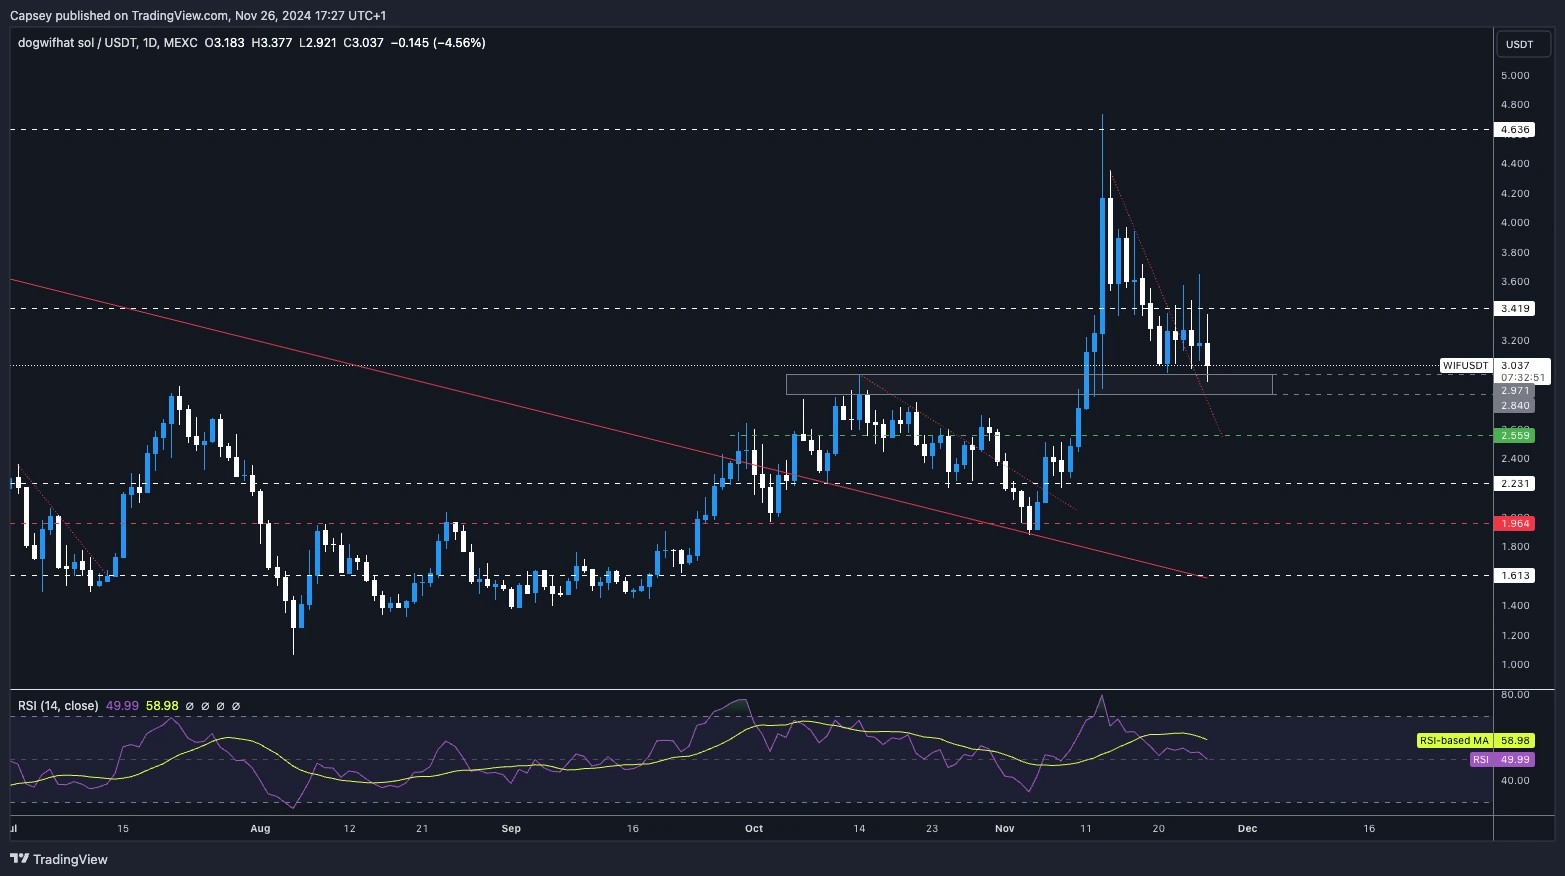
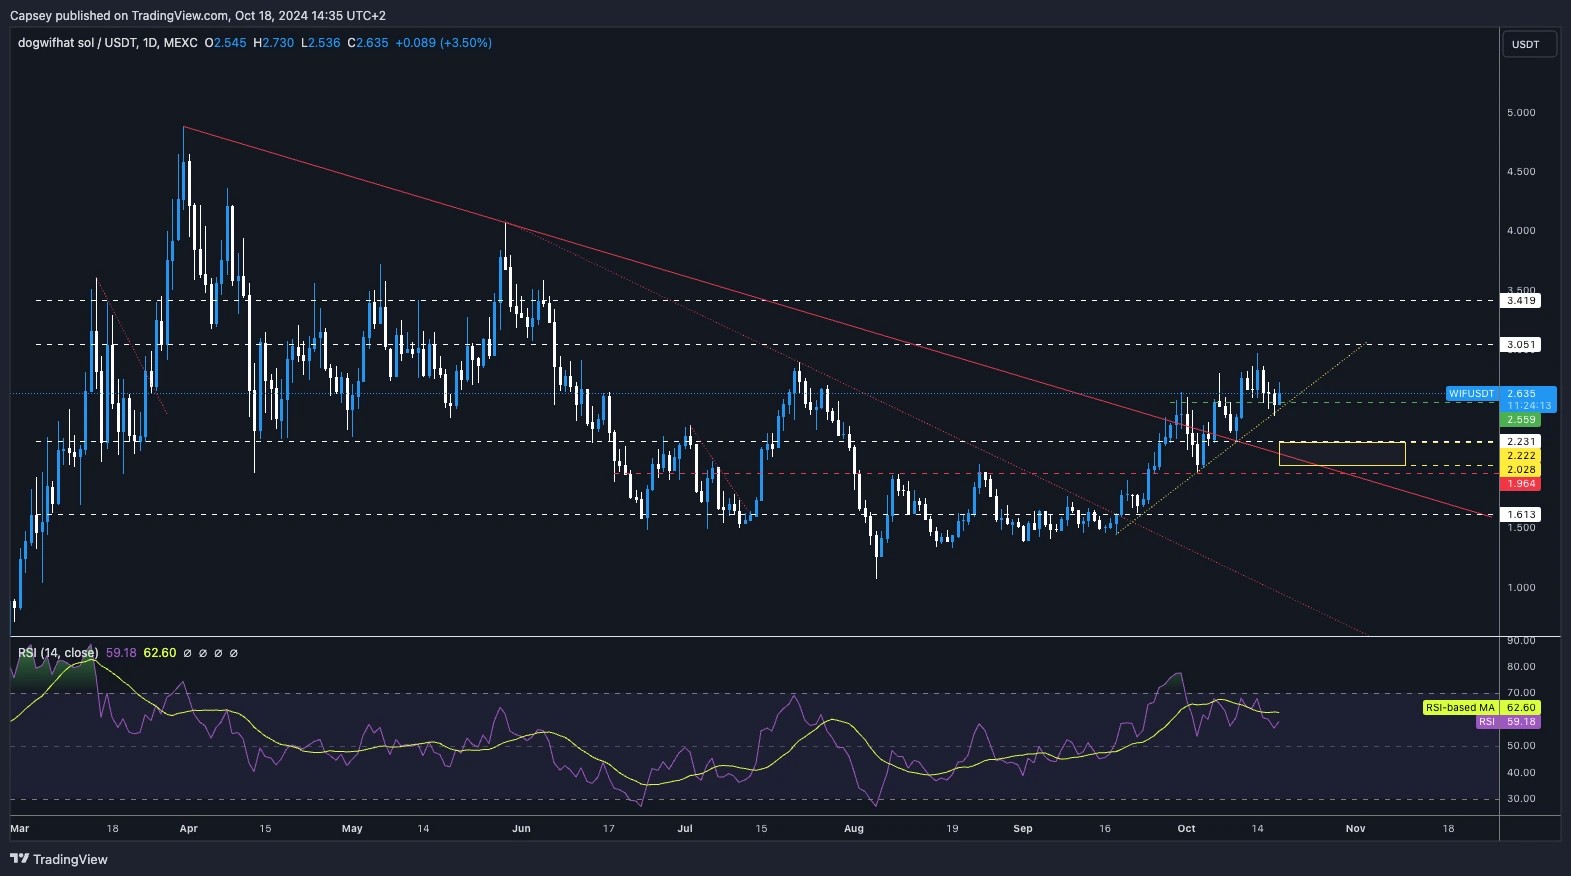
11 December 2024WIF consolidates between $2.84-$2.97 after bouncing from $2.55 support. A pennant pattern forms, with $3.40 as the key resistance and $10 as a long-term target. Let’s explore what’s next for WIF.
Disclaimer: This is not financial or investment advice. You are responsible for any capital-related decisions you make, and only you are accountable for the results.
- Following the leverage flush out, WIF fell down to a major horizontal support of $2.55 and bounced from there.
- Price is now battling at the grey support between $2.84 to $2.97 and forming a pennant pattern. The bias of this breakout might be to the downside, but we'd expect the $2.80's to be swiftly bought up if the price revisits there. Although we're not super confident that the pennant will break down, we wouldn't be surprised if the positive market momentum can take the price higher.
- The main level to the upside for the price to overcome is $3.40. This may take more time to achieve, though.
- The RSI is back to middle territory, having tried to break out to the upside on the move to $4.00.
- Next Support: $2.80
- Next Resistance: $3.40
- Direction: Neutral
- Upside Target: $3.40 (then $4.00)
- Downside Target: $2.80
Cryptonary's take
We remain phenomenally positive on WIF, and whilst it might take more time (days/to a week) to establish a new range, potentially between $3.00 and $3.40, we do expect a major breakout in the coming weeks.In the medium and long term, we still expect WIF to break down to new all-time highs and test the $10 area, maybe in Q1 2025. We remain holding spot positions, and we're not looking to sell, so we may consider adding between $2.55 and $2.80 if the price revisits there.
$3.40 key resistance for WIF
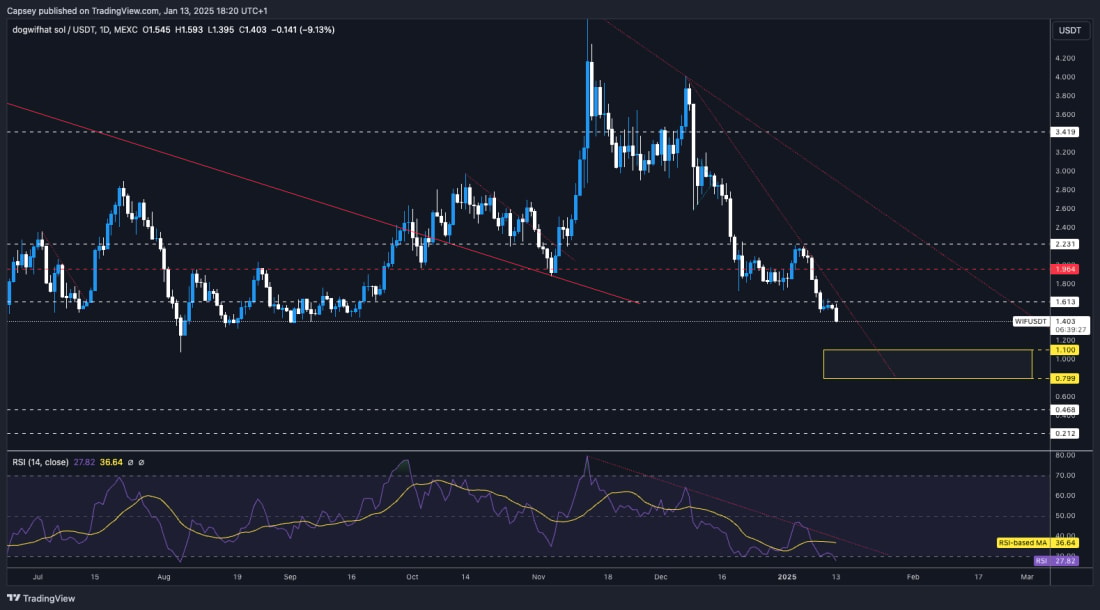
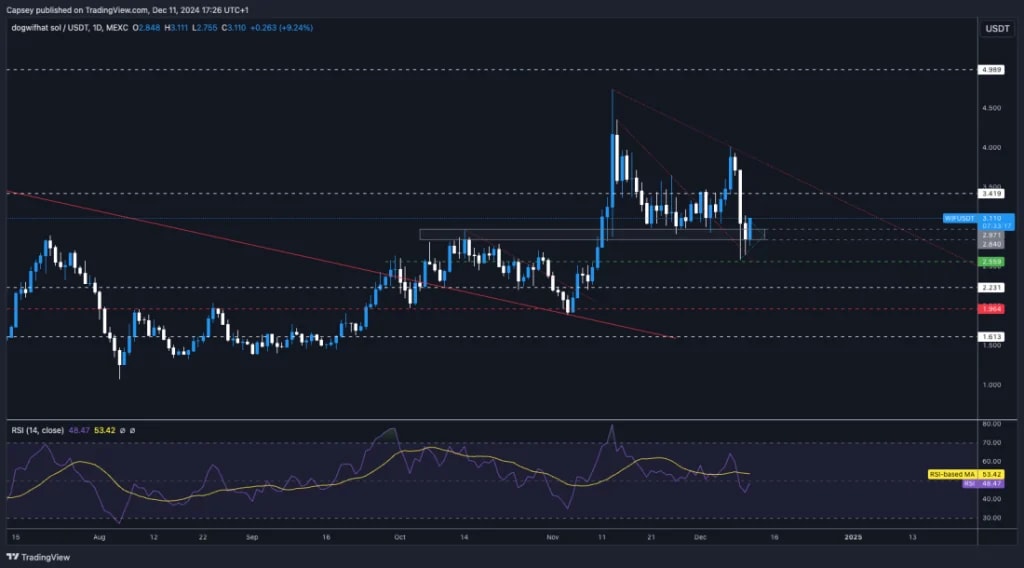
06 December 2024Dogwifhat ($WIF) remains range-bound, holding key support at $2.97 while battling $3.40 resistance. Bulls aim for $4.00, awaiting a clean breakout to spark momentum.
- WIF has attempted a break out of its downtrend line. However, the price continues to remain compressed between its major horizontal support and resistance.
- The support remains in the grey box, between $2.84 and $2.97.
- The main resistance is $3.40. We're looking for a price to make a clean break out of that level.
- Price has attempted to break out today; however, so far, we've seen a rejection. If today's candle closes like this, it would be a somewhat ugly candle. However, it is close to $3.40, and we might be off to the races.
- The RSI has been compressed for a few weeks now, and it has settled in the middle territory of printing 53. This leaves room for the price to move in either direction.
- Next Support: $3.00
- Next Resistance: $3.40
- Direction: Neutral/Bullish
- Upside Target: $3.40 (then $4.00)
- Downside Target: $2.84 - $2.97
Cryptonary's take
WIF has been compressed for a while, and whilst it remains range-bound, we just watch it. However, we are looking for a breakout or a breakdown of the key levels. We are expecting that the breakout will come to an upside. The key level we're looking for is $3.40. A positive and clean close above that level, and WIF probably moves swiftly onward towards $4.00.For now, we remain in Spot, and we're just patiently waiting and watching WIF here. Not looking to take any action.
WIF to $4.30 soon?
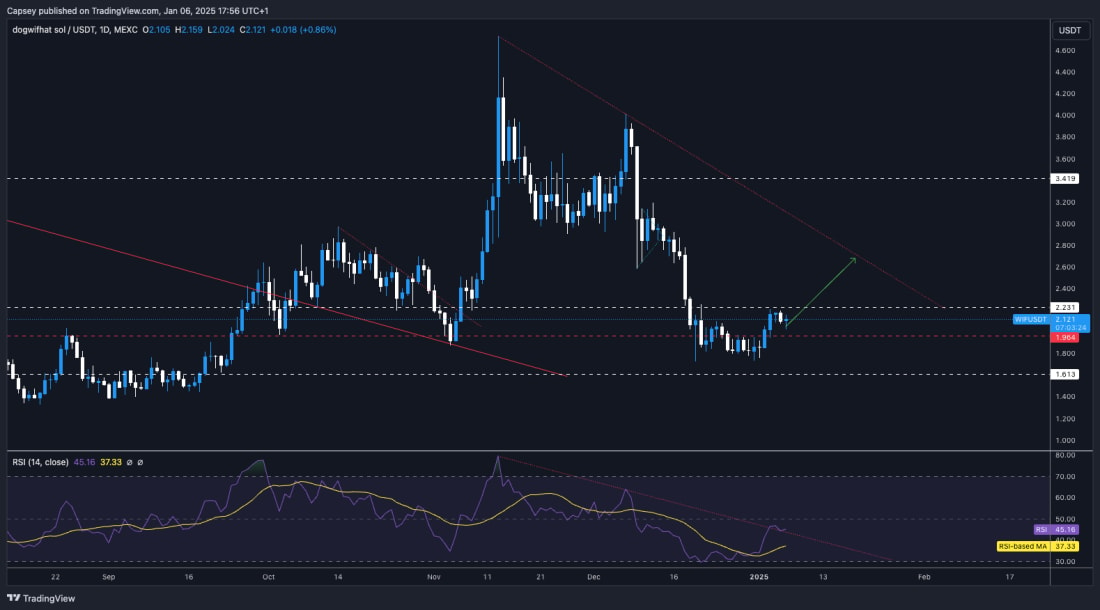
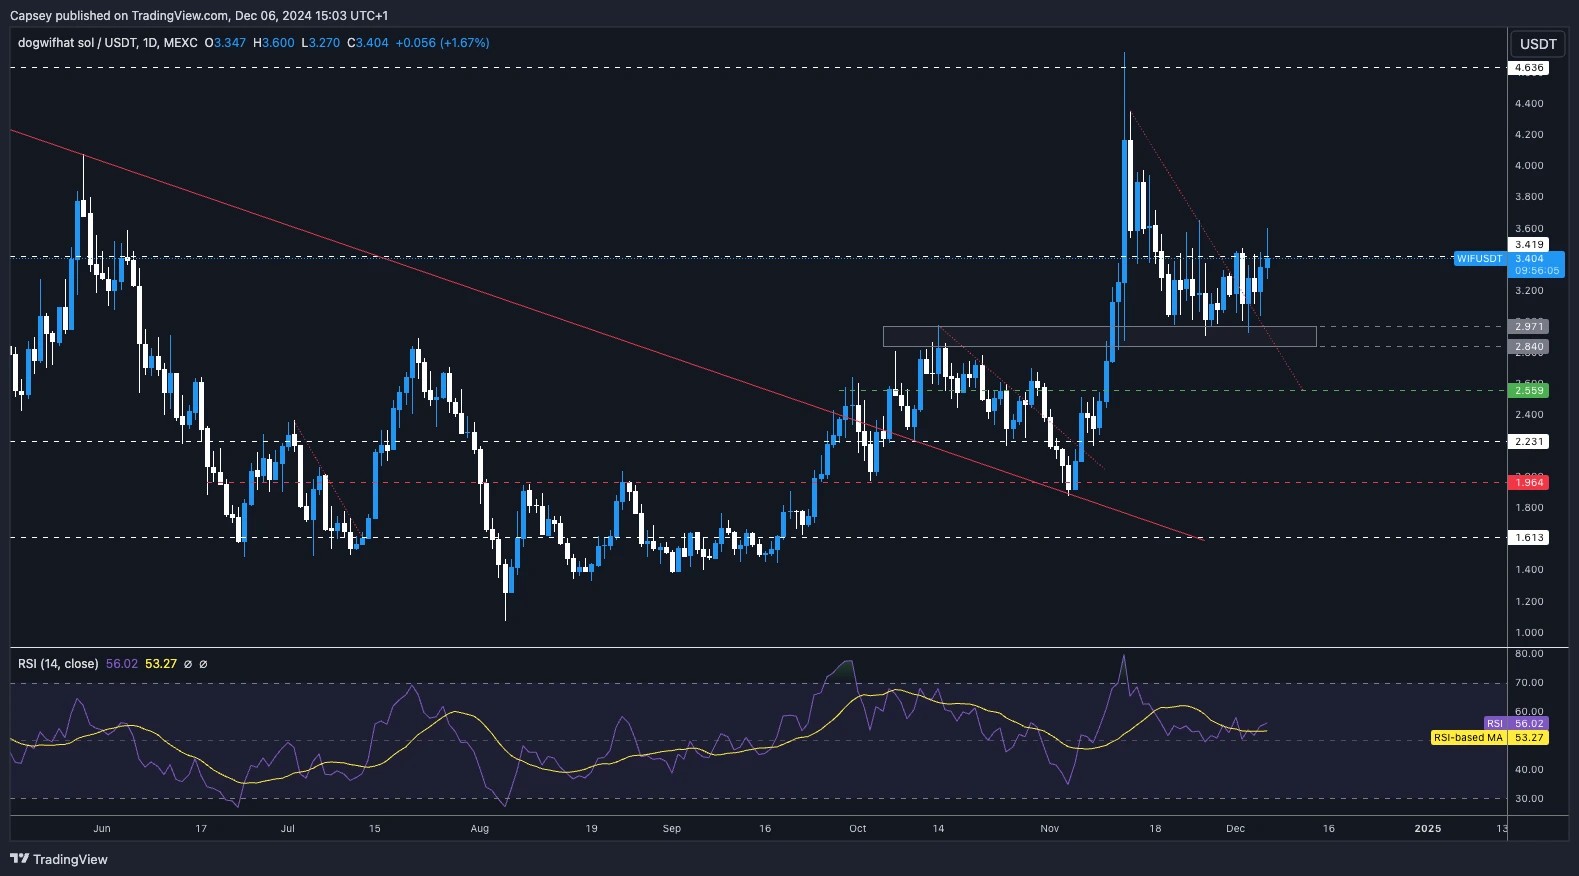
04 December 2024As crypto markets stabilize, Dogwifhat ($WIF) is showing promising potential with tight ranges and bullish technical setups. Could a breakout above $3.40 ignite explosive action? Let’s explore key trends.
Disclaimer: This is not financial or investment advice. You are responsible for any capital-related decisions you make, and only you are accountable for the results.
- WIF has remained range-bound for a few weeks now between the support, grey box ($2.84 and $2.97) and the resistance of $3.40.
- Between $2.55 and $2.97, there are large supports, and we expect WIF to be aggressively bid below $3.00.
- A break above $3.40 would be the signal to us that WIF is breaking out, and from there, a swift move up to $4.30 is possible.
- With price being range bound and subdued for a number of weeks, this has allowed the RSI to meaningfully reset, and now it sits in the middle territory and nowhere near overbought.

- Next Support: $3.00
- Next Resistance: $3.40
- Direction: Neutral
- Upside Target: $3.40 (then $4.00)
- Downside Target: $3.00
Cryptonary's take
We fully expect that once WIF breaks out to the upside, we will see more explosive action. That key level, we believe, is a clean break of $3.40. For now on WIF, we'll continue to just monitor the levels. We're not expecting any major breakdown, but if we were to see a move below $3.00, we expect bidders to come in. So, essentially, in the short-term, this is a waiting game whilst we expect price to just continue to be range-bound.$3.40 resistance key for WIF
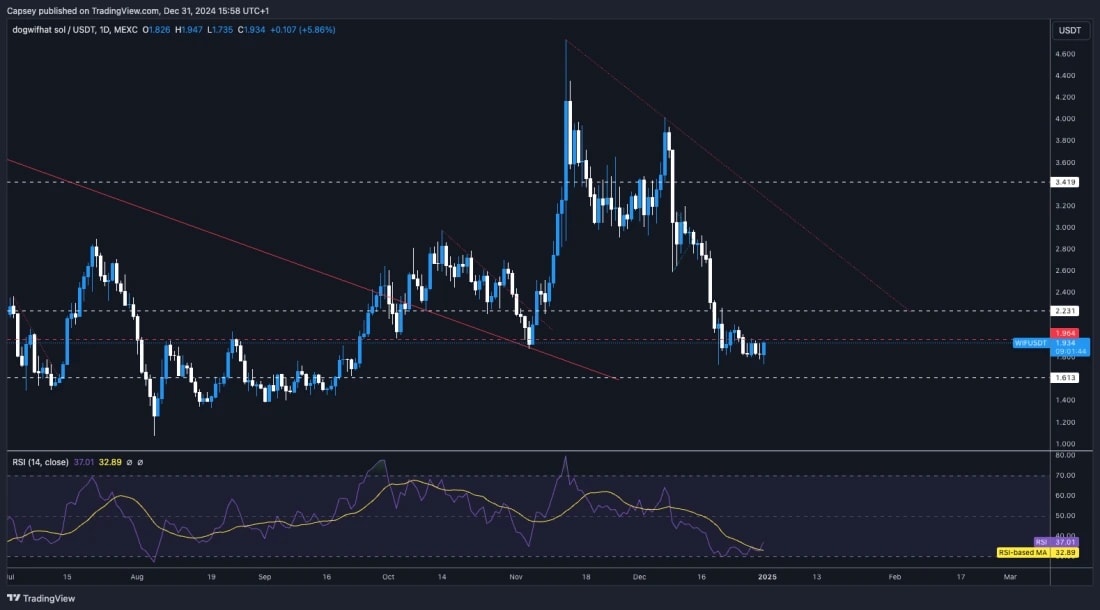
29 November 2024Dogwifhat ($WIF) consolidates near $3.00 with resistance at $3.40. RSI reset suggests upside potential, mirroring broader crypto trends in range-bound markets.
Disclaimer: This is not financial or investment advice. You are responsible for any capital-related decisions you make, and only you are accountable for the results.
- WIF has seemed to find its support in the grey box between $2.84 and 2.97.
- The key level for WIF to reclaim back above is the $3.40 level.
- If WIF were to fall below $2.90, there would be a lot of support stacked down to $2.60, so we'd expect a lot of buying pressure to come into WIF sub $3.00. However, we're not expecting WIF to drop much below $3.00.
- This pullback in price has seen the RSI substantially reset, and it is now back in the middle territory at 53.
- If WIF can break out of its downtrend line, that might help fuel a move up to $3.40 and then potentially reclaim that level.
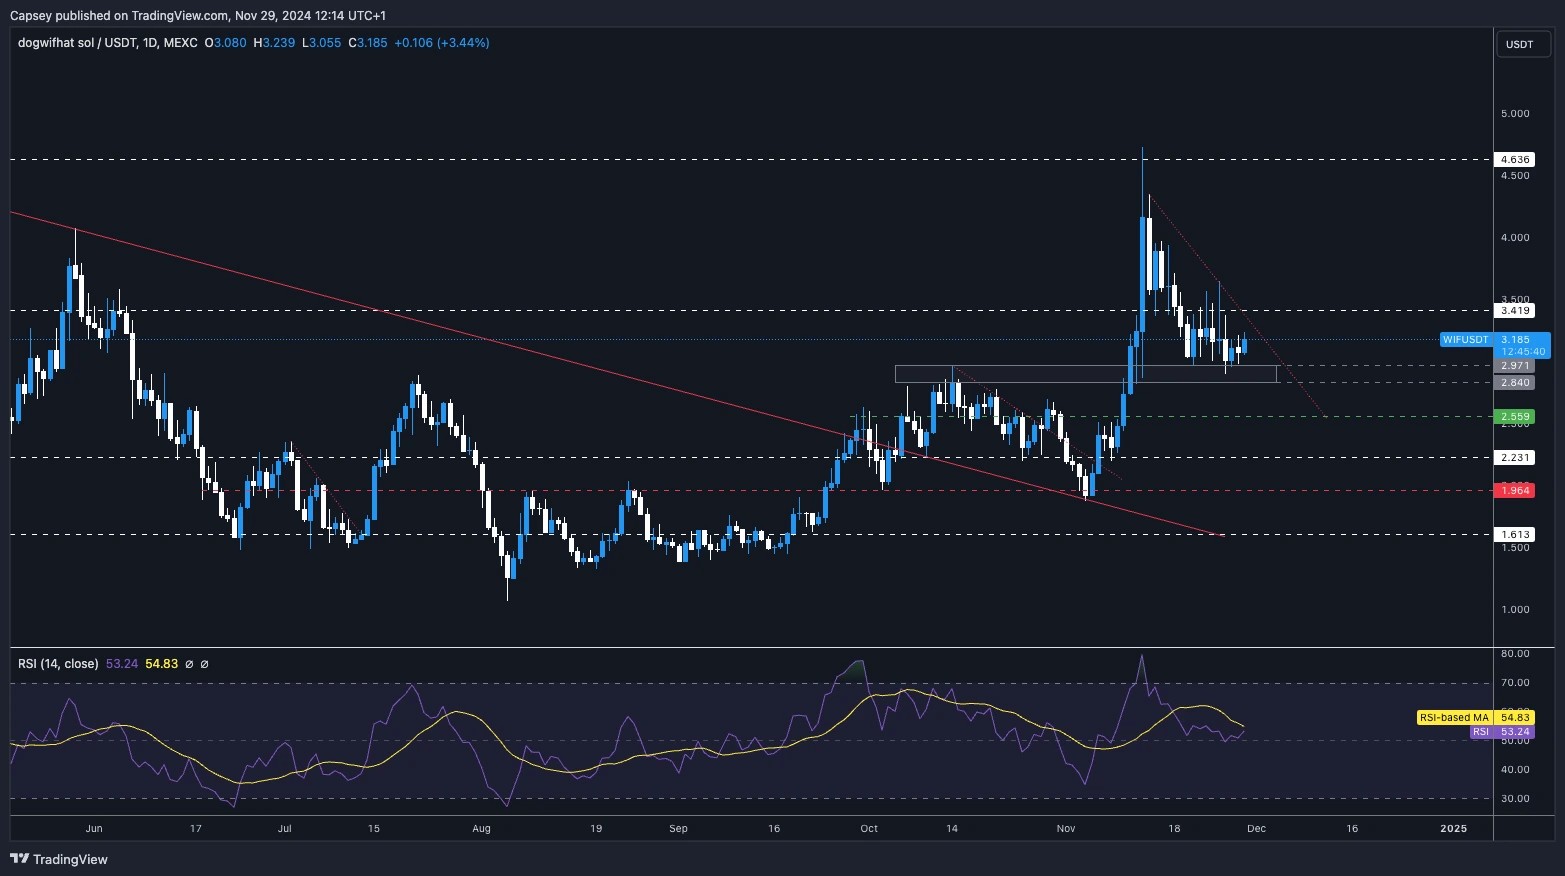
- Next Support: $3.00
- Next Resistance: $3.40
- Direction: Neutral
- Upside Target: $3.40 (then $4.00)
- Downside Target: $2.85
Cryptonary's take
We expect WIF to be range bound between $3.00 and $3.40 for some more days. It's possible that WIF is forming a bottoming pattern here, similar to what DOGE did at the $0.10 area.This might mean that more time is needed at these price levels, but if/when a breakout happens, it might be strong to the upside.
WIF retests $2.84-$2.97 grey zone
26 November 2024
WIF retests key support at $2.85, consolidating after its pullback, while BTC, ETH, and SOL stabilize at critical levels. Could this mark the next breakout? Let’s dive into the latest insights and projections.
Disclaimer: This is not financial or investment advice. You are responsible for any capital-related decisions you make, and only you are accountable for the results.
- In our last update, we called that WIF might pull back and retest the grey box between $2.84 and $2.97. We have now had that retest.
- WIF was rejected at the horizontal resistance of $3.40 a number of times and couldn't seem to surpass it, so that's the next major market for WIF to clear above.
- If WIF loses the grey box, then the next area is $2.55. However, we expect the grey box to hold for WIF.
- On the move down in price, the RSI reset substantially, having been majorly overbought.
- Next Support: $2.85
- Next Resistance: $3.40
- Direction: Neutral
- Upside Target: $3.40 (then $4.00)
- Downside Target: $2.85
Cryptonary's take
WIF is now listed on major Exchanges, which is a huge plus for this coin. We expect this to be the major winner of this cycle, with it being the number 1 SOL meme. The grey box is and was the area for those to accumulate who may be underweight WIF. We expect there to be more chop over the coming days, but we think WIF has done the majority of its pullback here.Overall, we're extremely optimistic about the outlook for WIF, so we're not looking to sell Spot holdings anytime soon.
Dogwifhat tests $3 support, Eyes recovery
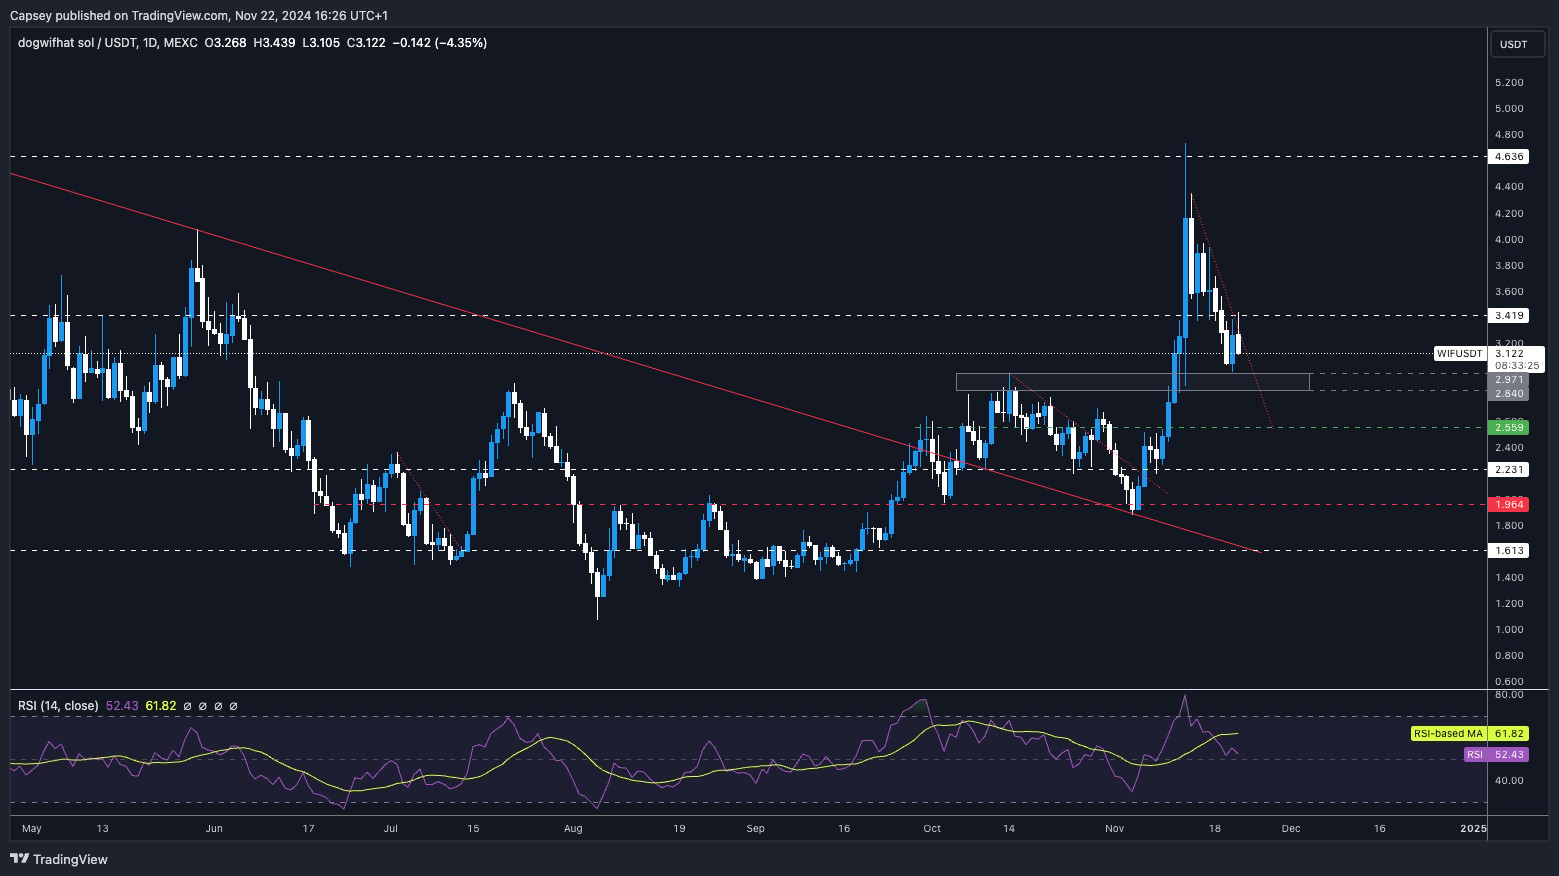
22 November 2024WIF approaches critical support at a price near $2.84 as retail activity remains low. Will $3.00 hold for a breakout above $3.40? Let’s analyze the setup.
Disclaimer: This is not financial or investment advice. You are responsible for any capital-related decisions you make, and only you are accountable for the results.
- WIF has pulled back substantially from the major horizontal resistance at $4.60, and it has nearly eroded all of its Coinbase listing gains.
- We initially thought that the $3.40 horizontal level would act as support, but unfortunately, the price broke below.
- We have now identified a support area between $2.84 and $2.97. We expect that this area will be a major support, and we'd be very surprised if the price broke beneath it.
- To the upside, the horizontal level of $3.40 will likely now act as short-term resistance.
- The RSI has reset substantially, and it is now back in the middle territory.
Don’t miss the latest dogwifhat (WIF) price prediction—explore our insights to stay ahead in the crypto market.
- Next Support: $2.84 - $2.97
- Next Resistance: $3.40
- Direction: Neutral
- Upside Target: $3.40 (then $4.00)
- Downside Target: $2.84 - $2.97
Cryptonary's take
We were surprised to see WIF break below $3.40, but now, the closer it gets to $3.00, the more undervalued it looks, particularly as SOL has broken out of its range and reached new highs. If WIF were to visit the Grey box between $2.84 and $2.97, we'd be buyers of this range. Other than that, we continue to hold WIF Spot positions, and really, we're expecting WIF to range here for now. This is until retail comes back and begins dipping into new cycle meme coins. That's when we'd expect the breakout to the upside.$4.80 resistance in WIF’s path
19 November 2024- Price rejected the major horizontal resistance at $4.80 and has since pulled back and retested the horizontal support of $3.40 a number of times.
- The price is in a local downtrend, and it's now squeezing against the downtrend line while holding the horizontal support of $3.40. A breakout would see the price revisit $4.00.
- If the price does break down, $3.00 is likely to be the major support.
- The RSI was very overextended and in overbought territory upon the move up to $4.80. It has now reset back to middle territory at 61. This is positive, and WIF has now had some consolidation, which was needed following the move higher.
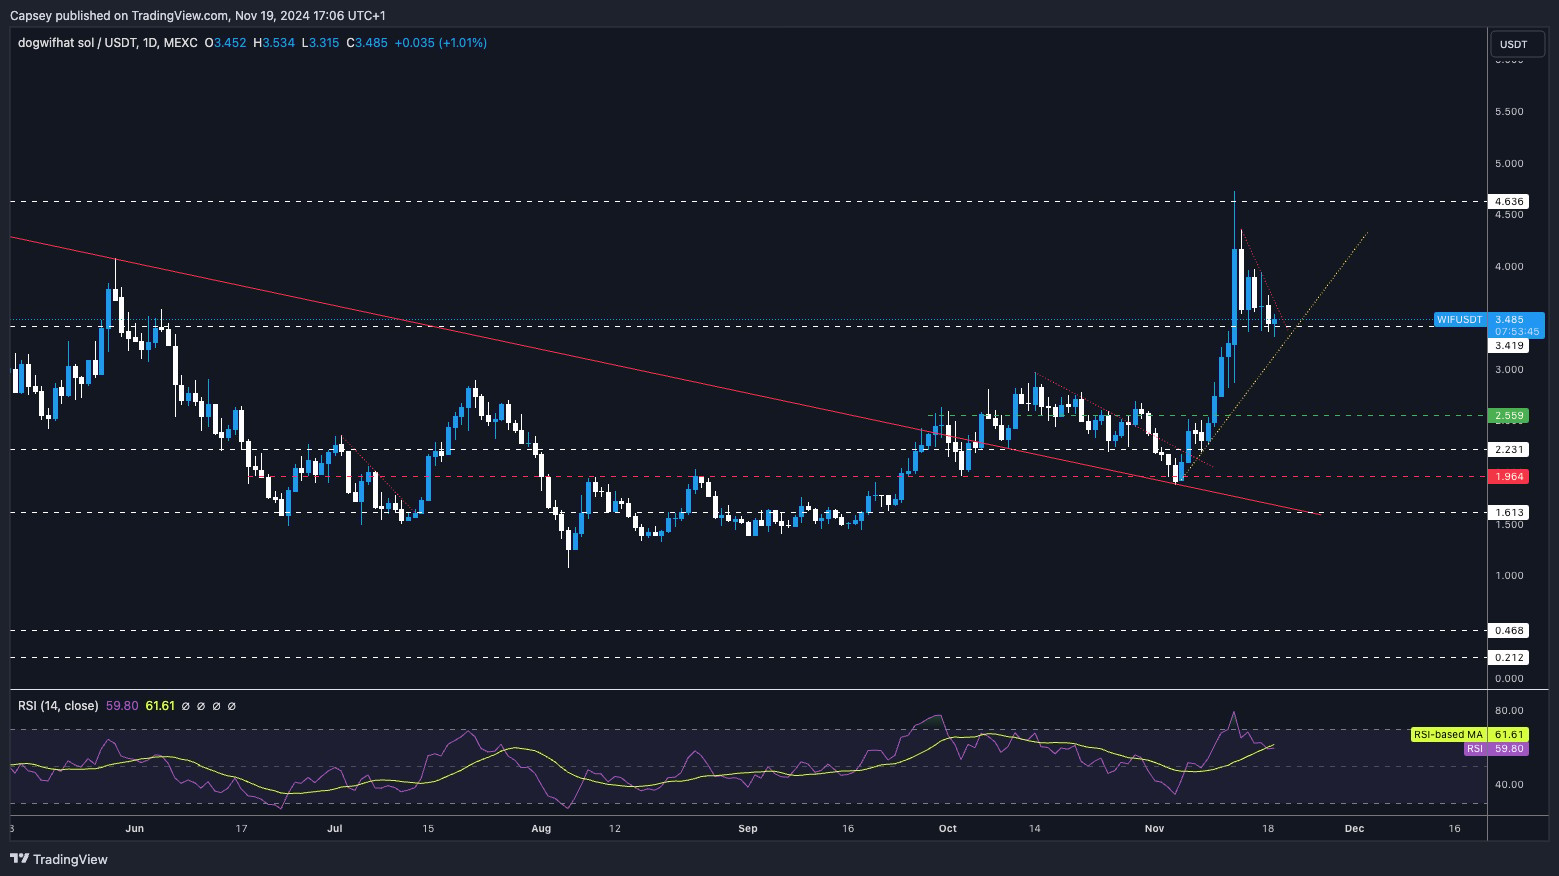
- Next Support: $3.40
- Next Resistance: $4.00
- Direction: Bullish
- Upside Target: $4.00
- Downside Target: $3.00
Cryptonary's take
WIF has pulled back and consolidated nicely after it's a major move higher. WIF has now found support at $3.40, and it's squeezing into its downtrend. This might be where WIF can get its breakout to the upside, and we see a more sustained move higher. Breakout targets would be $4.00 and then $4.80. We're looking to continue holding all Spot bags and not looking to sell anytime soon.WIF targets $4.80 resistance soon
15 November 2024WIF stabilizes near $3.40 support after a massive price move. Resistance at $4.80 looms, with RSI resetting. A breakout could lead to more upside soon.
Disclaimer: This is not financial or investment advice. You are responsible for any capital-related decisions you make, and only you are accountable for the results.
- It was a wicked move, all in all. And the price is much higher than a few weeks back, even with this pullback we're seeing currently.
- WIF was rejected at the candle body tops of its all-time high, and it has since pulled back to the horizontal support level of $3.40. Price is managing to hold this area as support for now.
- Below $3.40, there is another support at $3.05. We expect the $3.05 to $3.40 range to hold as support. We wouldn't be surprised if $3.40 itself acted as support before we see more upside.
- On the large move up, the RSI became tremendously overbought. However, that has since reset somewhat, but the RSI's moving average is still slightly lower, so it's possible there's slightly more room to pull back for price.
- On the upside, the resistance and the goal for the price to surpass are all-time highs.
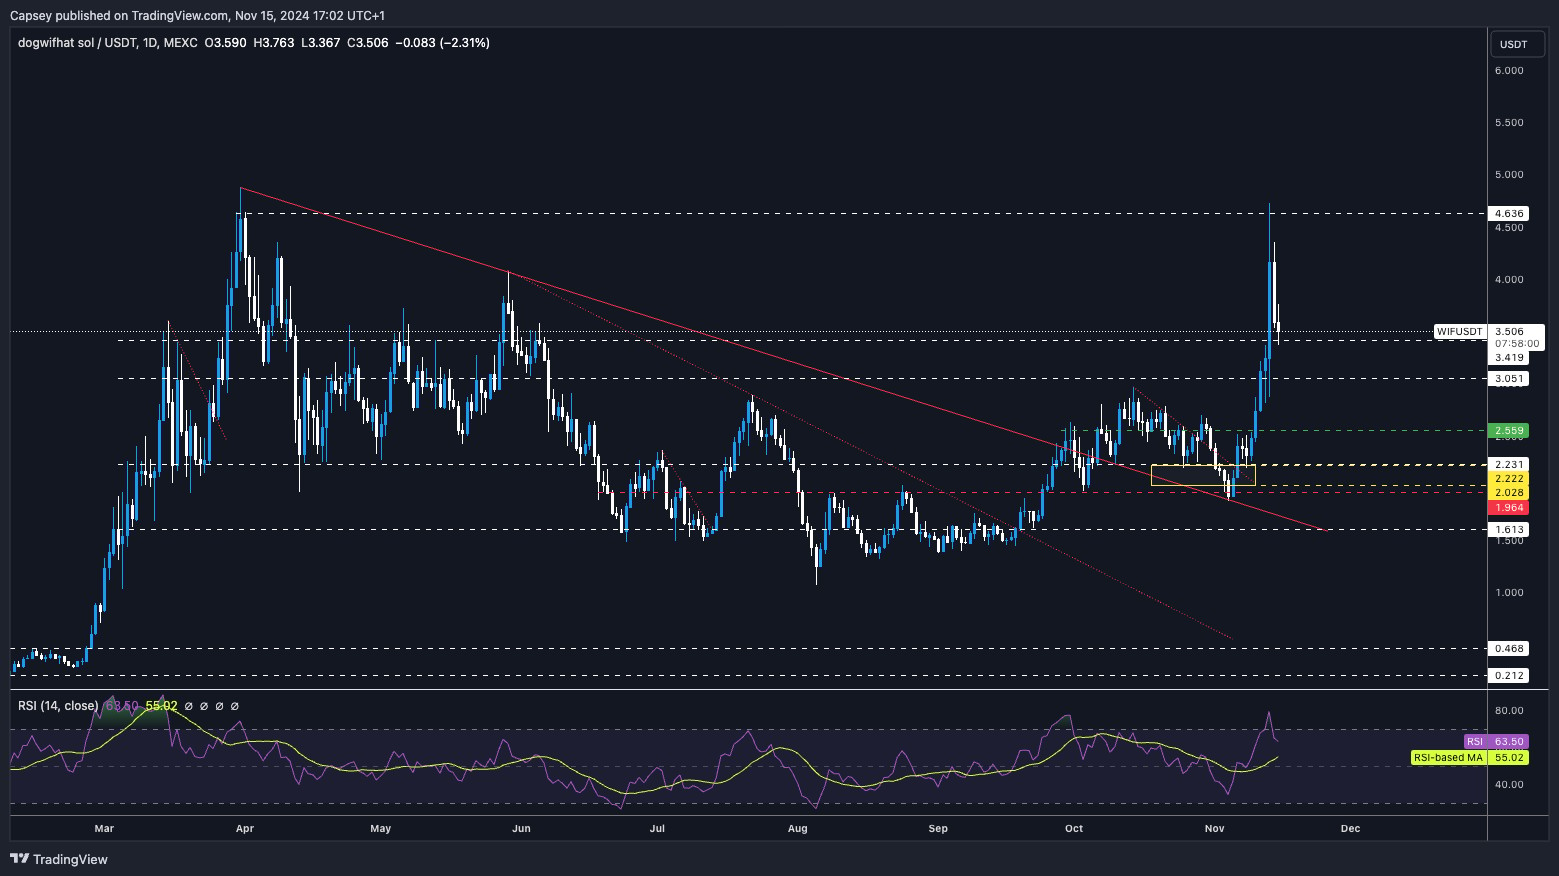
- Next Support: $3.40
- Next Resistance: $4.80
- Direction: Neutral
- Upside Target: $4.80
- Downside Target: $3.05
Cryptonary's take
Coinbase listing WIF is likely a sign that they see the market moving in a positive direction and retail likely coming back, and they want to capture the fees off of people who are trading it. After a massive move-up like we've seen, it's normal for the price to pull back.Price remains well above the levels we've seen it trading at in the last few months. We're expecting a period of consolidation for the price (maybe a week), and we expect this between $3.40 and $4.00. Beyond that, we expect the break out to be to the upside. We're holding Spot WIF positions, and we're expecting fireworks in the coming months. No plans to sell anytime soon.
The memecoin supercycle is rewriting the rules, offering opportunities that could redefine your investment strategy. Discover why this moment is a game-changer for crypto enthusiasts.
WIF eyes $3.40, $4.00 next
12 November 2024- A really nice move from WIF and getting back well into the $3's.
- To the downside now, we'd like to see the $2.70 to $2.80 area hold as support. A pullback to here and a price to consolidate between here and $3.20 would also reset the RSI.
- To the upside, the target is $3.40 and then $4.00 (psychological level).
- It's possible that if there is a flush out, WIF will revisit $2.55. If it did, we'd see this as a gift and add it again to our WIF bags.
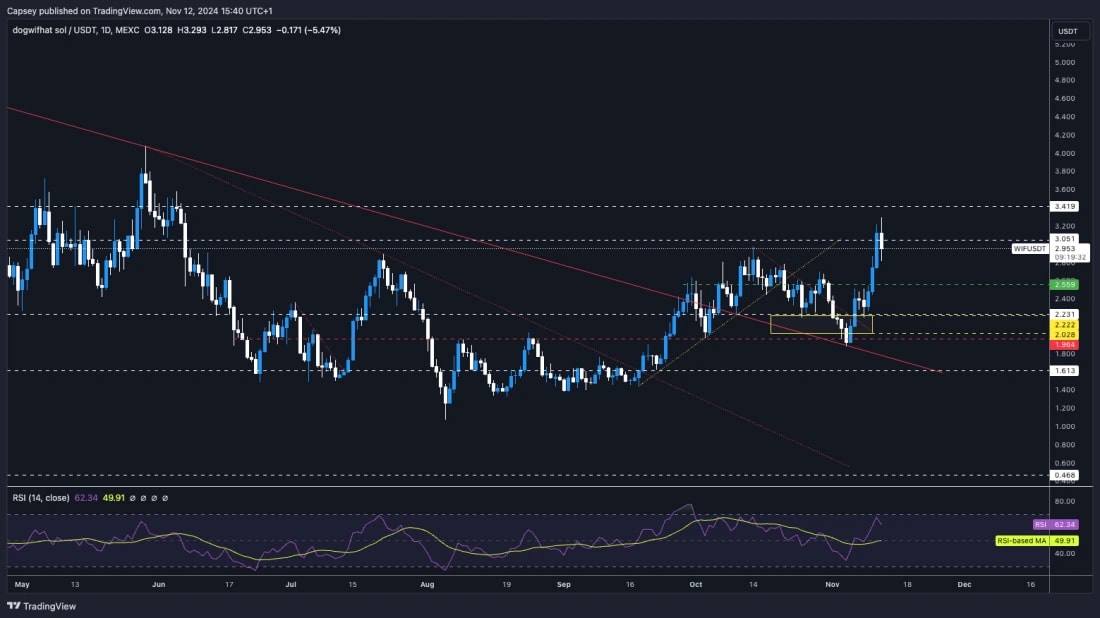
- Next Support: $2.70
- Next Resistance: $3.40
- Direction: Bullish
- Upside Target: $3.40 (and then $4.00)
- Downside Target: $2.55 to $2.70
Cryptonary's take
It's possible that WIF has a brief spell of consolidating between $2.70 and $3.20 over the coming days as we expect the majors to do the same. However, this might be front run and we see Meme's break out upon a period where Bitcoin calms down. If price revisits anywhere close to $2.50, we'd be adding more size.We've seen DOGE rocket higher, and put on about $30b in MCap over the last fortnight - WIF is currently sub $3b MCap, for some perspective. This has personally made myself (Tom) revise my WIF targets much higher. We expect that when retail comes back, the new coins will get major attention, and therefore upside. Patience with WIF. Likely we're at $5 and then $10, sooner than you think.
WIF consolidates between $2.20 and $2.55
07 November 2024WIF’s RSI shows room for growth, supporting a breakout toward $3.05. Meanwhile, BTC, ETH, and SOL each hold key positions. Discover what’s next.
- WIF managed to find support just below our Yellow buy box ($2.00 to $2.20) at the main horizontal support level of $1.96.
- Price has bounced from the main horizontal support and is now broken back above the local downtrend line.
- Price was initially rejected at the next horizontal resistance at $2.50 and $2.55.
- The price is now consolidating between $2.20 and $2.55. The lower end of this range is likely still a good buy, considering the environment it looks like we'll be moving into.
- The RSI on WIF is in the middle territory, so it is still nowhere near overbought, and it is coming off of nearly oversold levels. The RSI won't be a headwind for further price upside here positive.
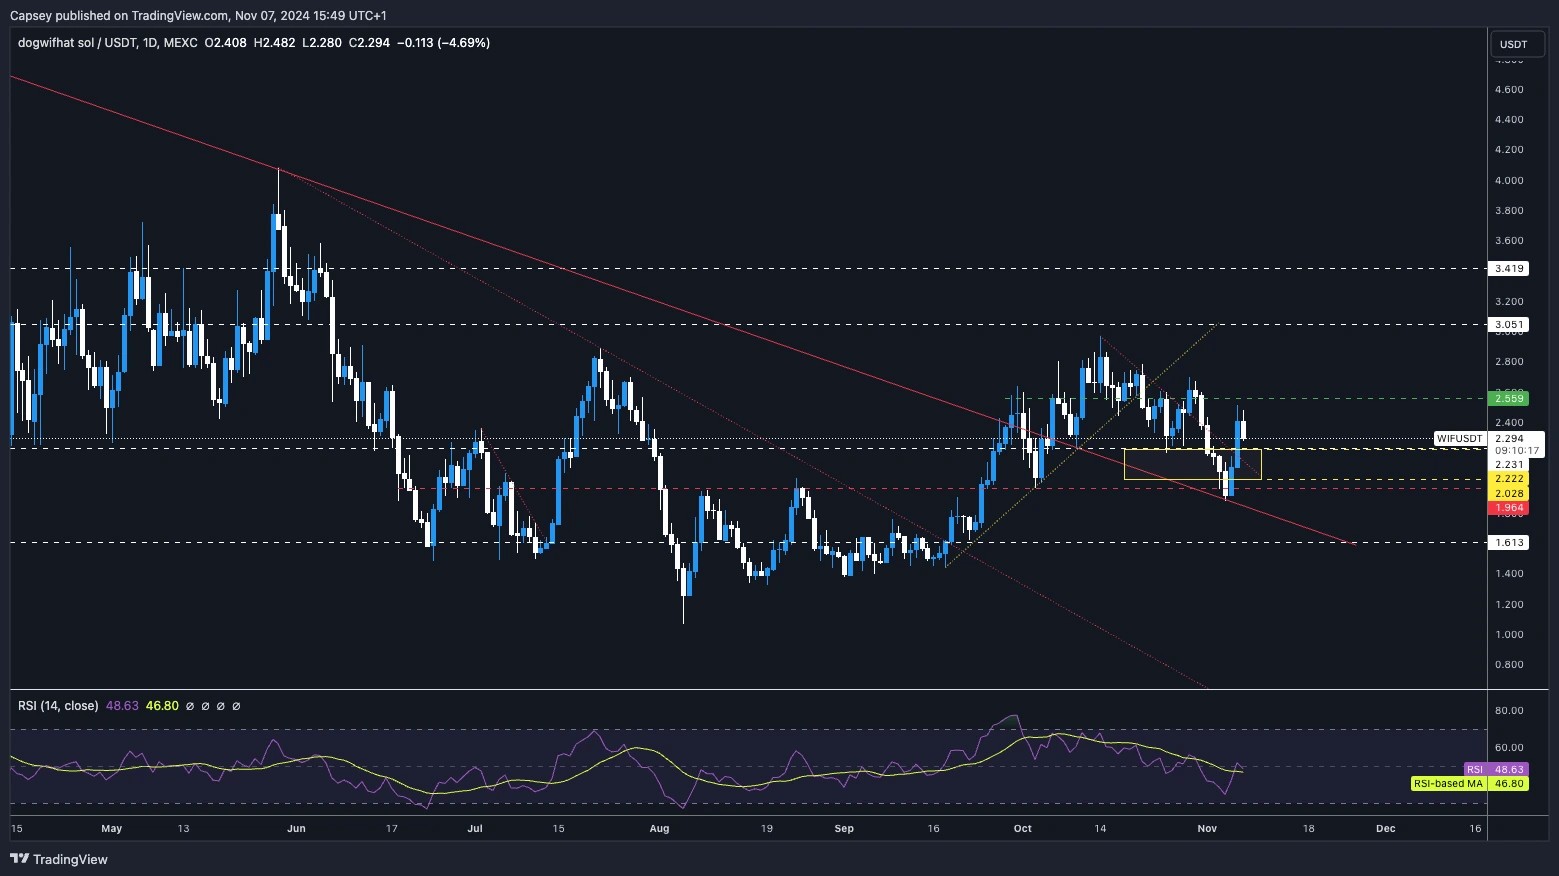
- Next Support: $2.20
- Next Resistance: $2.55
- Direction: Bullish
- Upside Target: $2.55 (to $3.05 upon breakout)
- Downside Target: $2.20
Cryptonary's take
We'll just start with this straight out of the gate. Out of all the major meme's, WIF currently looks the most attractive price wise. Whilst we're still expecting some range-bound price action between $2.20 and $2.55, we expect $3.05 to be quickly achieved upon a breakout of $2.55. We would be buyers of the bottom end of this range at $2.20.WIF hovering near buy zone amid election
04 November 2024WIF is hovering near $1.96 support, facing potential moves with the election outcome in sight. Could a favourable result spark a recovery to $2.20, or will it test lower levels? Explore WIF’s next moves.
- Following the rejection at $3.00, WIF has pulled all the way back to the Yellow buy box and it is even testing the lower horizontal support now at $1.96.
- On this pullback over the last few weeks, the RSI has reset substantially and now it's just above oversold territory, with many of the smaller timeframes either in or close to overbought territory.
- On the downside, we wouldn't be surprised if $2.00 is the local low, especially if Trump wins. However, if there is a Harris win, it's possible there's a reaction lower and the $1.70 area is tested. But we'd expect this to be bought up.
- To the upside, the key levels to reclaim are $2.20 and then $2.55.
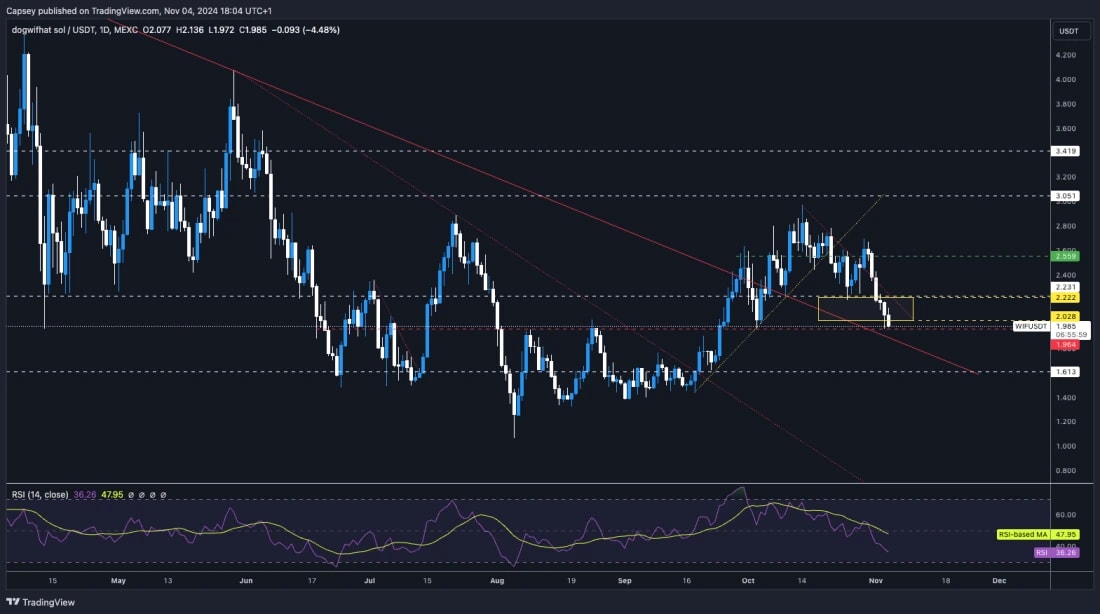
- Next Support: $1.96
- Next Resistance: $2.20
- Direction: Neutral
- Upside Target: $2.55
- Downside Target: $1.70
Cryptonary's take
Looking at the barbell portfolio and in terms of price, WIF looks the most attractive for a buy here. If we get a Trump win tomorrow/Wednesday, sub $2.00 will look super attractive. Ultimately, this week will come down to whether Trump or Harris wins. Personally (Tom), I added some WIF yesterday and today at the $2.00 level, although I still have cash on the side to buy up the major dip on a Harris win if that's what we get.Dogwifhat eyes $2.55 target
28 October 2024WIF eyes $2.20 support with a $2.55 upside target. Will Dogwifhat bounce back or test new lows? Here’s today’s WIF price prediction and analysis.
- WIF broke out of it's major downtrend line, and then pushed up to $3.00 before beginning a local downtrend, that has sent WIF back to the low $2.00's.
- There are a lot of supports between $2.00 and $2.20, which is also where we have our Yellow Buy Box. If WIF revisits this box, we'll add to our bags.
- On the downside, $2.00 to $2.20 is the major support zone we're looking for.
- To the upside, $2.55 is the key level to reclaim, with $3.00 being the level beyond that.
- This move down over the last fortnight has meaningfully reset the RSI which is positive to see.
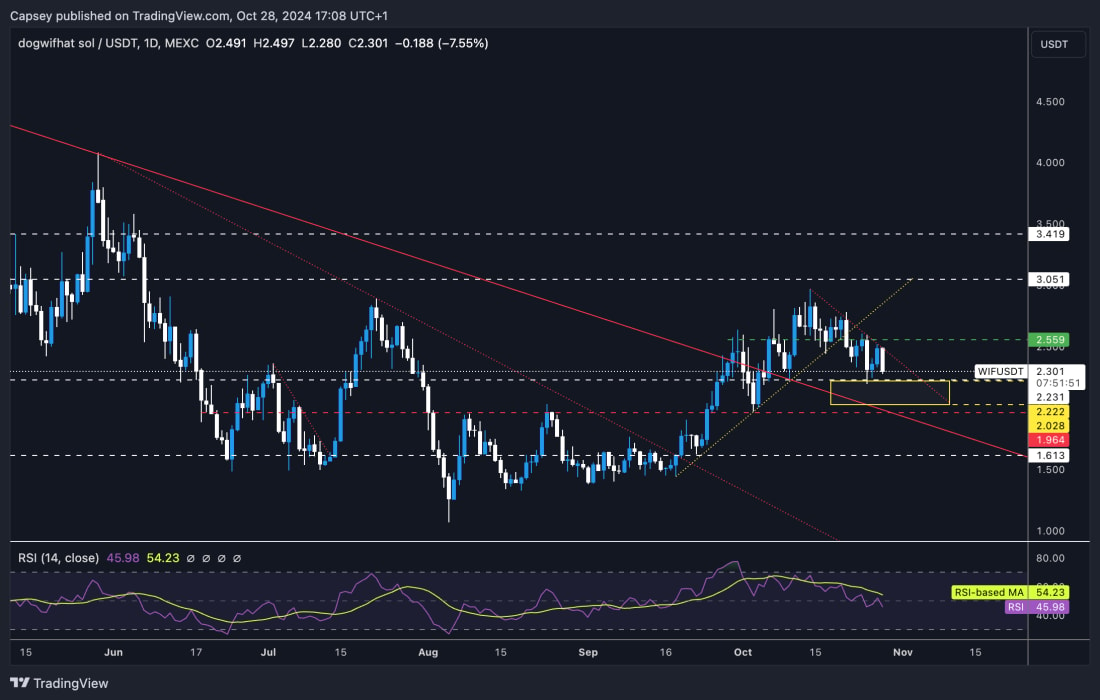
- Next Support: $2.00 - $2.20
- Next Resistance: $2.55
- Direction: Neutral
- Upside Target: $2.55, then $3.00
- Downside Target: $2.00 - $2.20
Cryptonary's take
Charting-wise, WIF still looks good here, even if it pulls back to $2.00 to $2.20; we'd just see this as a healthy retest. We do believe that in the coming week, WIF can more meaningfully fill the Yellow Buy Box. We'll be buyers in this area, as we'd expect that to potentially be a local bottom, especially if we get a Trump win next week.Can WIF rebound to $2.80 soon?
22 October 2024Dogwifhat pulls back below the uptrend line, targeting $2.20 support. Can WIF rally back to $2.80? Here’s today’s outlook and analysis.
- WIF put in two bearish divergences (higher highs in price, lower highs on the oscillator) which caused the pullback. We called for this, and we were watching this in the last few Market Directions.
- WIF has now broken below its local uptrend line, and its local support is at $2.55.
- If WIF continues with this slight pullback, the target zone could be the Yellow box between $2.00 and $2.20, although $2.20 is local support, so it's possible to price bounces from there (assuming it's retested).
- The RSI has now reset more meaningfully, which is positive.
- To the downside, we'd expect the $2.20 to $2.00 to act as a major support zone.
- On the upside, $2.80 is likely a local resistance, with $3.05 still being the major horizontal resistance.

- Next Support: $2.20
- Next Resistance: $2.80
- Direction: Bearish/Neutral
- Upside Target: $2.80
- Downside Target: $2.20
Cryptonary's take
The bearish divergences in overbought territory have ultimately played out and why we initially became wary when WIF approach $3.00. Price has now pulled back but it beneath the uptrend line and local support, suggesting we might see another leg lower.However, we expect the $2.00 to $2.20 area to act as a major zone of support. We'd be buyers of WIF in that zone - assuming it is retested.
For now, we hold Spot WIF, and we'd like to add between $2.00 and $2.20.
Can WIF surge beyond $3.05?
18 October 2024WIF nears the key $3.05 resistance level. Will Dogwifhat maintain support at $2.55, or will it fall back to $2.20? Discover today’s outlook.
- WIF has broken out of its main downtrend line and gradually pushed higher, testing just shy of $3.00 a few days ago.
- Price is holding a local uptrend line nicely, and the price has bounced off local support at $2.55.
- To the upside, the main resistance remains at $3.05.
- The strongest support range is between $2.00 and $2.20, which is where we've placed a Yellow box that we'd be aggressively bidding if the price reached those levels.
- The RSI has pulled back slightly, having pushed into overbought territory and printed bearish divergences. This pullback to mid-territory is healthy and good to see, even though we may see the pullback extend slightly further.
- Next Support: $2.55
- Next Resistance: $3.05
- Direction: Neutral/Bearish
- Upside Target: $3.05
- Downside Target: $2.20
Cryptonary's take
As of 4 days ago, WIF had doubled in the last month, so if we had a slight pull back or a small period of consolidation, we'd see that as very healthy and necessary for price to continue in a sustainable uptrend. If price were to pull back and retest close to $2.20, we'd be buyers at that price. If price were to fill the Yellow box, we'd be aggressive buyers there.It's possible that price bounces off this local support and moves up again, however we think it's more likely price breaks the local uptrend and retests the $2.20 area. In our view, this would be a fantastic long-term buying opportunity.
WIF tests $3.05 resistance with $3.40 in sight
14 October 2024WIF targets $3.05 resistance after strong gains. Will WIF push toward $3.40 or pull back to $2.20? Check today’s price prediction and analysis.
- As we expected and put in our last few updates, WIF looks really great and is continuing its grind higher than we expect to reach $3.05.
- $3.05 is a horizontal resistance, so it's possible to price short-term stalls out around there.
- Beyond $3.05, $3.40 is the next key level. If the price can get a clean break above $3.40, we'd expect the price to reach all-time highs relatively swiftly after.
- To the downside, $2.20 is the key level and the level we expect will be strong support for price, if price is to retest that low again.
- The RSI is close to being overbought in the daily timeframe, and it has put in multiple bearish divergences, so this might be the one sign suggesting some caution.
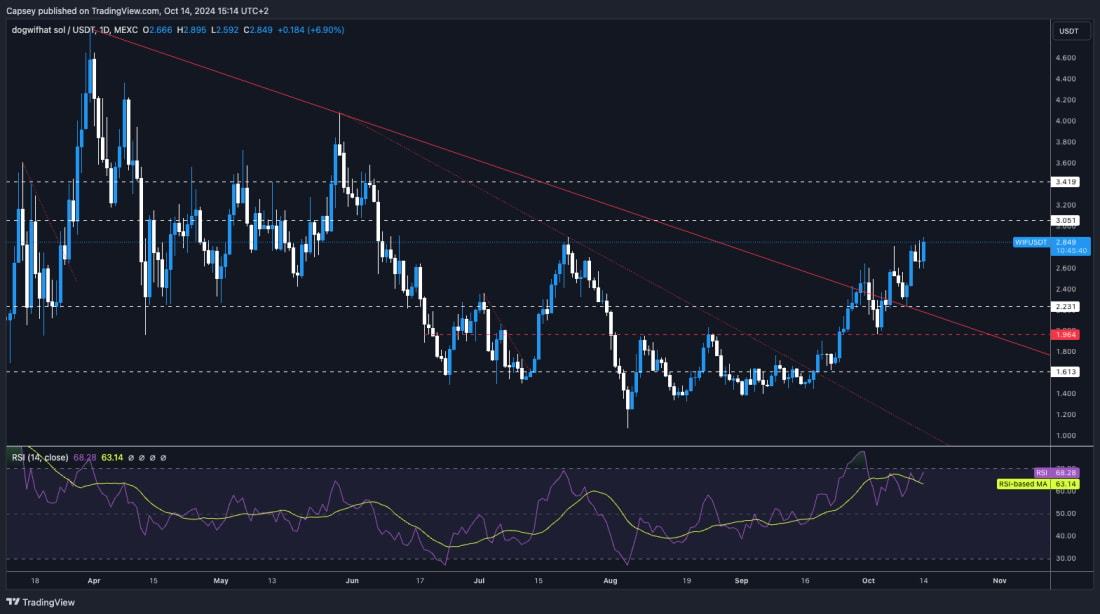
- Next Support: $2.20
- Next Resistance: $3.05
- Direction: Bullish
- Upside Target: $3.05 - $3.40
- Downside Target: $2.20
Cryptonary's take
So far, this is a really clean play from our calls on WIF over the last few weeks, with our $1.50- $1.80 Spot buys now being well in profit. The price has pushed higher, and we expect it to reach $3.05 in the coming week before cooling out slightly in the short term, but it will likely be just a consolidation rather than a major pullback. There are bearish divergences built up, which is something to be mindful of. However, we see this as being enough to stall the current momentum that WIF is seeing.Will dogwifhat (WIF) reach the $3.05 resistance?
11 Oct 2024WIF looks bullish after breaking its downtrend. Will it hit $3.05 resistance soon? Here’s today’s price prediction and market outlook
- WIF has broken out of the main downtrend line and is comfortably above what was previously a major resistance zone between $1.96 and $2.20.
- We had seen a bearish divergence (higher high in price and lower high on the oscillator) form in overbought territory, but that has reset somewhat now.
- To the downside, we'd expect $1.96 to $2.20 to act as a major support zone.
- To the upside, $3.05 is the next major horizontal resistance.
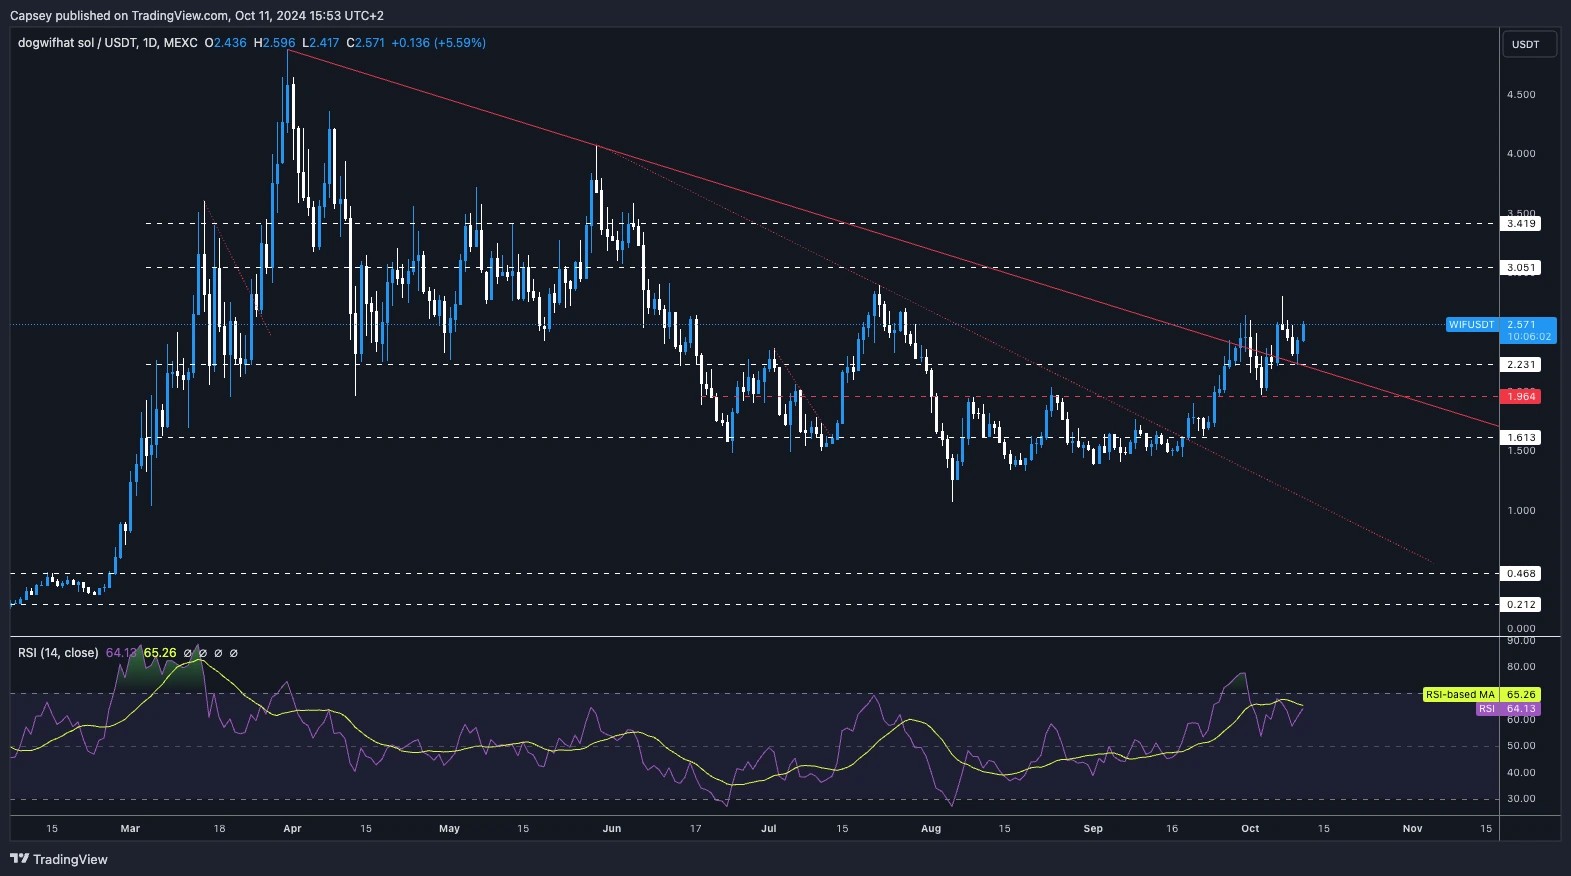
- Next Support: $2.20
- Next Resistance: $3.05
- Direction: Bullish
- Upside Target: $3.05
- Downside Target: $2.20
Cryptonary's take
WIF looks good to go higher here. If the wider market holds up well, we'd expect to see WIF at $3.05 sometime in the coming 7 days.Dogwifhat approaches key resistance amid bullish sentiment
7 October 2024WIF holds strong support at $2.20 with eyes on $3.05 resistance. Can Dogwifhat break out of its consolidation range?
- WIF is one we call perfectly. We expected a pullback to the $1.96 to $2.20 zone (check prior Market Direction). WIF pulled back to $196 and bounced perfectly from that level.
- The price has broken out of the main downtrend line, and it's back above $2.20, and it is now resetting the prior highs at $2.60.
- Beyond the current price, $3.05 is the more significant horizontal resistance.
- On the downside, we'd expect $1.96 to $2.20 to continue to be a strong support zone, but the likelihood is that $2.20 would be enough support on its own.
- On the Daily, the RSI is close to overbought territory, and it has put in a bearish divergence (higher high in price and lower high on the oscillator).

- Next few days prediction: Neutral ($2.20 to $2.70)
- Next 7 days prediction: Bullish
- Next 7 days price target: $3.05
Cryptonary's take
RSI aside, WIF looks very bullish. However, it may be the case that the bearish divergence needs to be reset, meaning that WIF may need a small period of consolidating in the mid-$2s. However, it's possible the chart and market structure overrides the bearish divergence on the RSI here. Therefore, we're constructive.We'd be looking to add WIF on any major pullbacks. Over the coming days, we may see some consolidation in the mid-$2s, with prices potentially breaking out beyond Thursday if we see positive Inflation data on Thursday.
WIF cleared $2.20, and is $3.05 next?
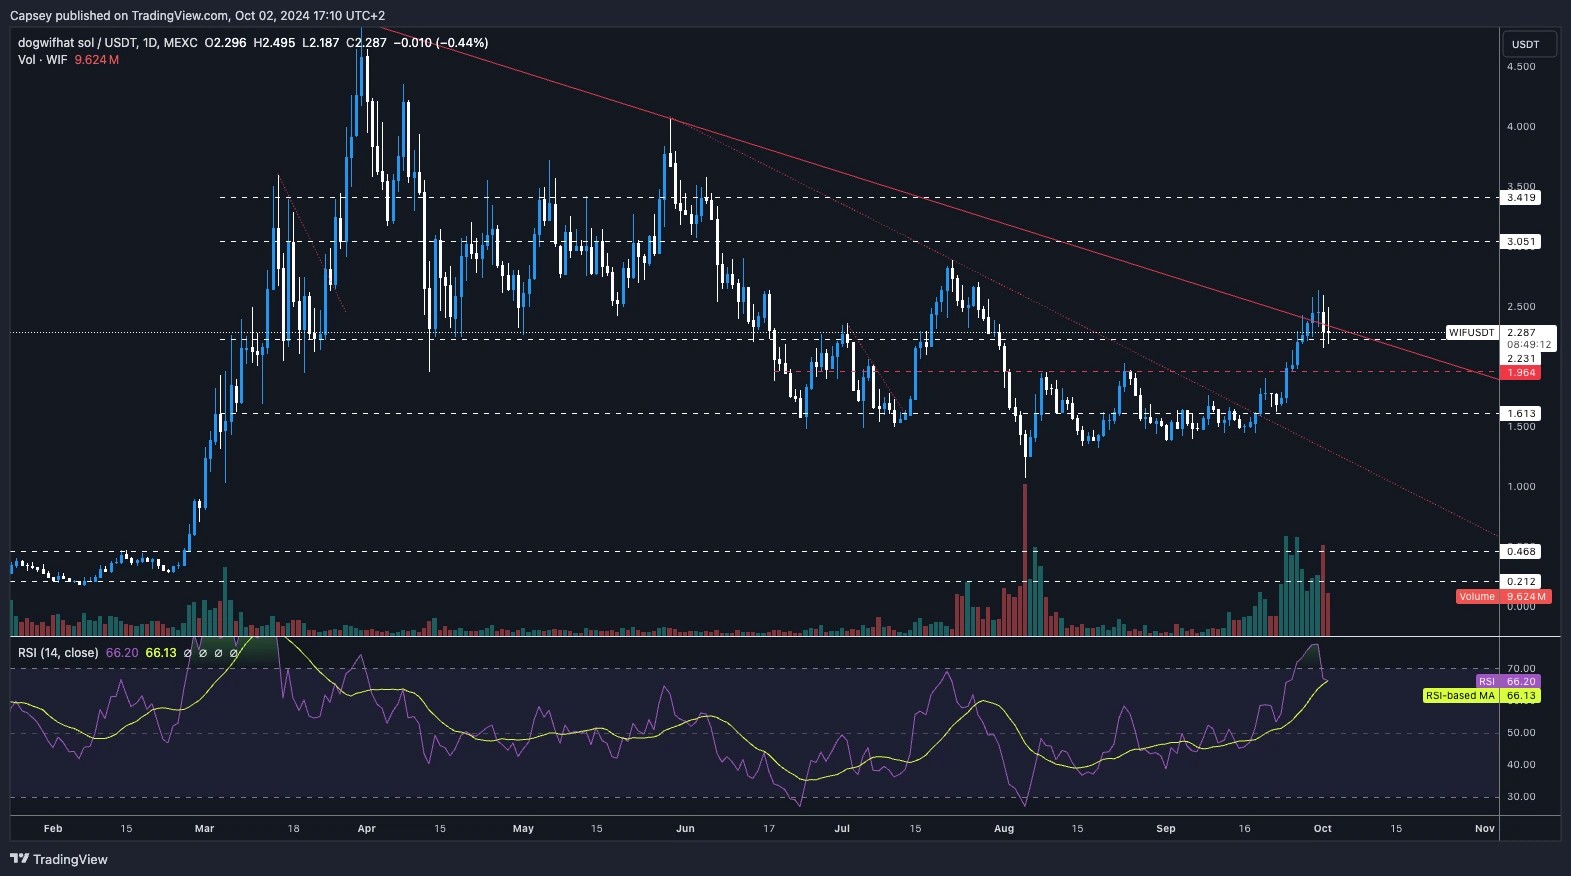
02 October 2024WIF cleared resistance at $2.20, nearing a breakout with $3.05 as the next target.
- WIF built a base at $ 1.60, and the price has moved up and cleared above the horizontal resistances of $1.96 and $2.20.
- The $2.20 horizontal resistance also has convergence with the main downtrend line, which price is attempting a higher timeframe breakout.
- The RSI was very overbought, and even though it has pulled back slightly, it still remains close to overbought territory. This is perhaps the only concern for this chart currently.
- If WIF can maintain a breakout of the downtrend line, the next target would be $3.05.
- To the downside, we'd expect the zone between $1.96 and $2.20 to be strong support and a zone where we expect large bidders.
Cryptonary's take
Overall, a great looking chart with the higher timeframe breakout. It's possible we see a slight pullback, and we would consider this a positive sign as it would likely reset the overbought RSI a tad more. But, we think this is a great setup here. If we weren't positioned, we'd be looking to bid WIF between $1.96 and $2.20 (assuming we're given the opportunity to do so) and potentially bid with some size.Watching WIF for a break toward $3.50
02 October 2024The breakout above $2.25 confirms bullish momentum, with focus now on consolidation, risk management, and potential upside.
Market context
The breakout we've been watching closely has officially materialized. WIF is now trading above the critical $2.25 level and has also reclaimed the key trendline that was acting as significant resistance. These two technical confirmations are highly encouraging, and they add to the growing bullish momentum we've identified.Disclaimer: This is not financial or investment advice. You are responsible for any capital-related decisions you make, and only you are accountable for the results.
The correlation between reclaiming this trendline and holding above the $2.25 key support is extremely important for our trade. Historically, this level has provided strong support and resistance, acting as a psychological anchor for both buyers and sellers.
Its current role as support suggests that we could see further upside from here if the level holds over the next few days. At this stage, we are looking for a solid hold of this level into the weekend or next week. If the price is maintained above $2.25 and consolidates, we will be (Me mal) looking to add to the position while also tightening my stop-loss to secure the initial risk on the first position.

Playbook
1. Key trendline reclaimsThe breakout above $2.25 and the trendline reclaims add significant bullish momentum to this trade. This is the first time we've broken out of the wedge convincingly, and we are now looking at a potential move towards the next key resistance levels. Action: Monitor how this level holds. A consolidation period above $2.25 will confirm strength and provide an opportunity to scale up.
2. Entry strategy
Current Position: We're already in a 2x leverage position that is currently in profit. Scaling In: If the price holds above $2.25 into next week, I may look to add another position, bringing my stop-loss up to cover the risk on the first entry. This will effectively reduce downside exposure while allowing me to ride further upside.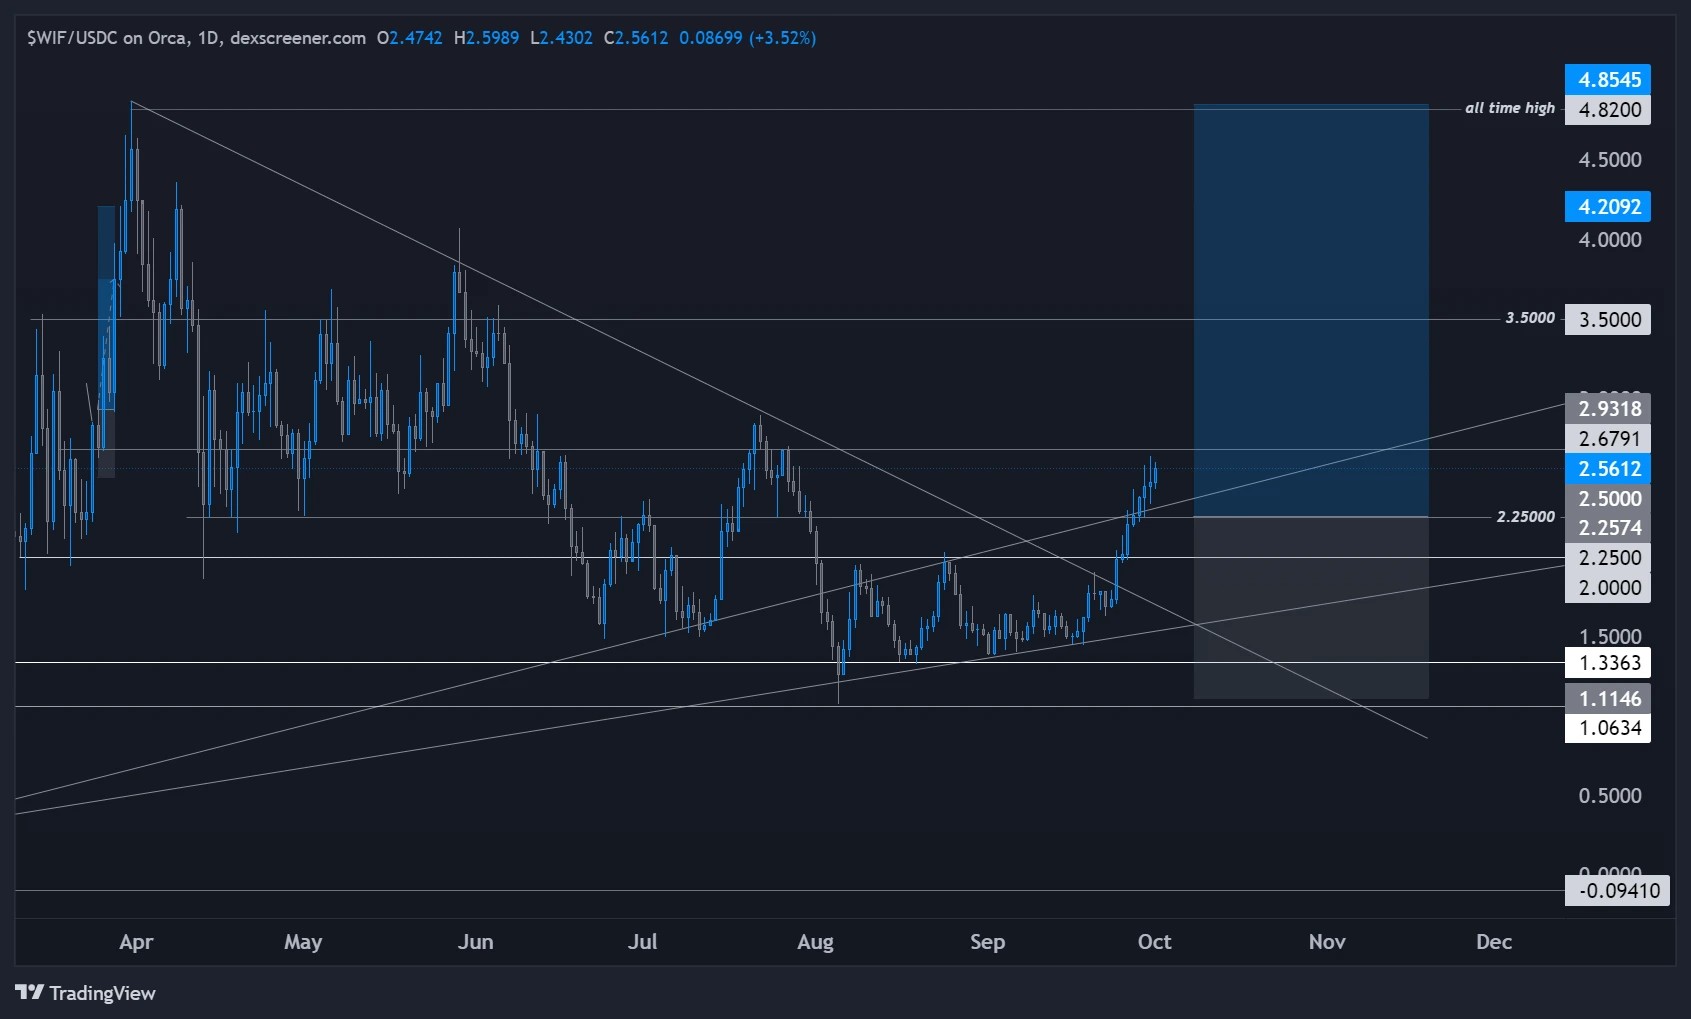
3. Next targets
Immediate Target: The next critical level to watch is $2.6791. A breakout above this level could open the door for a move toward the $3.50 and $4.20 levels. Longer Term: If volume returns to the market and the trend remains bullish, we could see a test of the all-time highs around $4.82.4. Risk management
Current Stop-Loss: My stop-loss is currently wide below $1, covering against a significant reversal. New Stop-Loss (Post-Add): If I add to this position, I'll be bringing my stop-loss up to around $2.00 or just under $2.25 to lock in some profit and reduce risk on the combined position.
Trade management
- Volume: As always, volume is key. While the breakout is promising, I'll be keeping an eye on whether the move is supported by increasing volume. This will confirm the strength of the breakout and the potential for a sustained uptrend.
- Liquidity zones: We're entering a range with relatively thin liquidity above $2.6791, meaning the price could move quickly if buying pressure increases.
- Waiting for confirmation: Patience is key right now. We've made the initial breakout, but it's critical to see whether the price holds above $2.25. We will be waiting for this confirmation before adding to the position.
Cryptonary's take
We're in a strong technical setup with a confirmed breakout, but now is the time to stay patient and observe how price reacts at these levels. We are not taking immediate action today, but if the price consolidates above $2.25, I'll be looking to add and adjust my stop-loss accordingly, as explained. I'll discuss this in the video update, and we will probably cover a bit in the live video. In the meantime, play the levels, manage risk, and don't rush into any impulsive actions. The market will give us more clarity soon.WIF tests major downtrend line
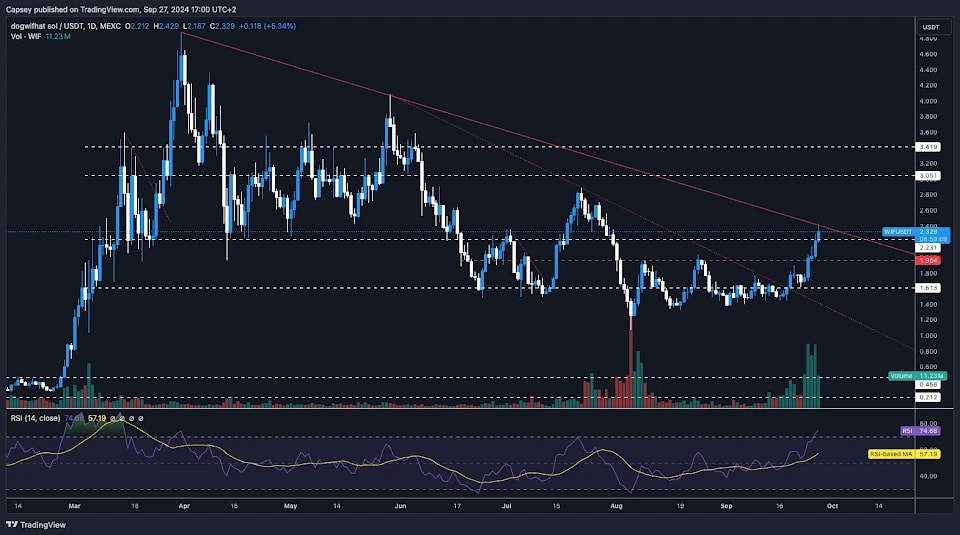
1 October 2024WIF has surged 41% in 4 days, approaching the downtrend line resistance. After a breakout, the next target is $3.05.
- It was a brilliant move from the lows, with the price now butting into the main downtrend line.
- The main downtrend line may act as resistance for price, especially considering that price is up 41% in 4 days.
- However, price has reclaimed back above the $2.20 horizontal level which is a positive sign. If price were to now pullback slightly from the downtrend line, we'd hope to see $2.20 act as support.
- If price were to see a more substantial pullback then we'd expect $1.96 to act as a more major support.
- If price can breakout of the major downtrend line, then we'd expect to see $3.05 be retested relatively swiftly after.
Disclaimer: This is not financial or investment advice. You are responsible for any capital-related decisions you make, and only you are accountable for the results.
Cryptonary's take
WIF has made a great move higher and in a relatively short space of time. Now, the price is butting up against the resistance of the downtrend line, which may act as a short-term resistance for the price. However, we do expect the price to break out from the downtrend in the coming weeks, and for the price to then test $3.05 following that.Can WIF break $3.05 soon?
27 September 2024- It was a brilliant move from the lows, with the price now butting into the main downtrend line.
- The main downtrend line may act as resistance for price, especially considering that price is up 41% in 4 days.
- However, price has reclaimed back above the $2.20 horizontal level which is a positive sign. If price were to now pullback slightly from the downtrend line, we'd hope to see $2.20 act as support.
- If price were to see a more substantial pullback then we'd expect $1.96 to act as a more major support.
- If price can breakout of the major downtrend line, then we'd expect to see $3.05 be retested relatively swiftly after.
Cryptonary's take
WIF has made a great move higher and in a relatively short space of time. Now, the price is butting up against the resistance of the downtrend line, which may act as a short-term resistance for the price. However, we do expect the price to break out from the downtrend in the coming weeks and for the price to then test $3.05 following that.Anticipating a bullish breakout from Wedge formation
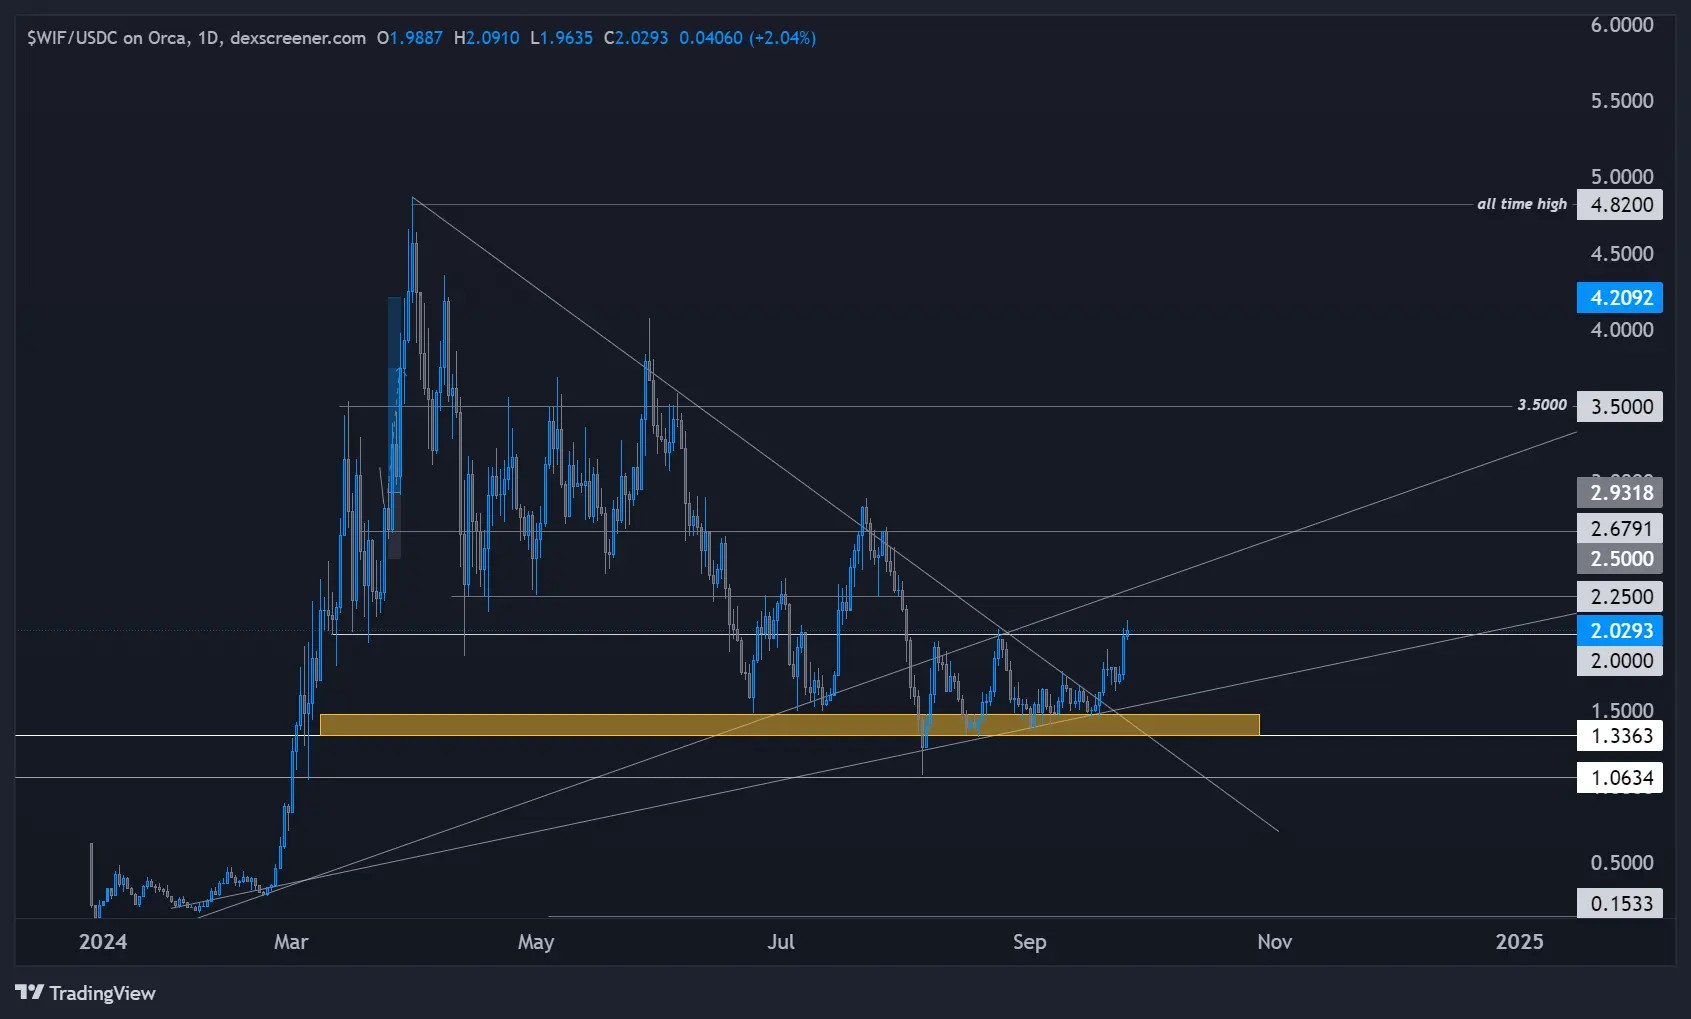
25 September 2024Market context
WIF is showing signs of slowing bearish momentum, forming a wedge pattern that could lead to a significant upside move. We’ve seen this type of wedge play out consistently in this cycle. It’s been a slow and steady grind, but the potential for a breakout is high.While I've entered a long position with 2x leverage into resistance (which I normally advise against), this is a calculated risk based on the slowing bearish momentum, wedge formation, and the wide stop in the form of liquidation levels below the $1 mark from my entry. I believe, given the current context, we have a higher chance of moving higher than dropping back down to my liquidation levels, hence the trade.
Playbook
- Wedge breakout: Keep a close eye on this wedge. If we break out of resistance with conviction, we could see a strong move higher.
- Entry strategy: I've entered early with 2x leverage. For those waiting, it's safer to wait for a confirmed breakout and retest before entering, especially if you have a tight stop loss and higher leverage allocated.
Risk management
This is a low-risk leverage trade with a stop loss below key levels, so exposure is limited. Once we see a breakout, I’ll adjust the stop loss to protect profits as usual.Cryptonary's take
There we have it—some volume is back in the market, and key assets are finally moving. Patience pays. Here, we utilize different sentiment tools and technical analysis to identify the current attraction and how we can hop on board potential upside moves, which have a high chance of coming soon. This period of consolidation has been eye-opening, showing where real strengths and weaknesses lie in the market this cycle. Now, it's time to put this new knowledge to work and start getting positioned for action.Always manage your risk effectively, follow the price action, and stay sharp over the next 10 days as we monitor these assets closely.
WIF technical analysis: Why waiting for the retest improves strategy
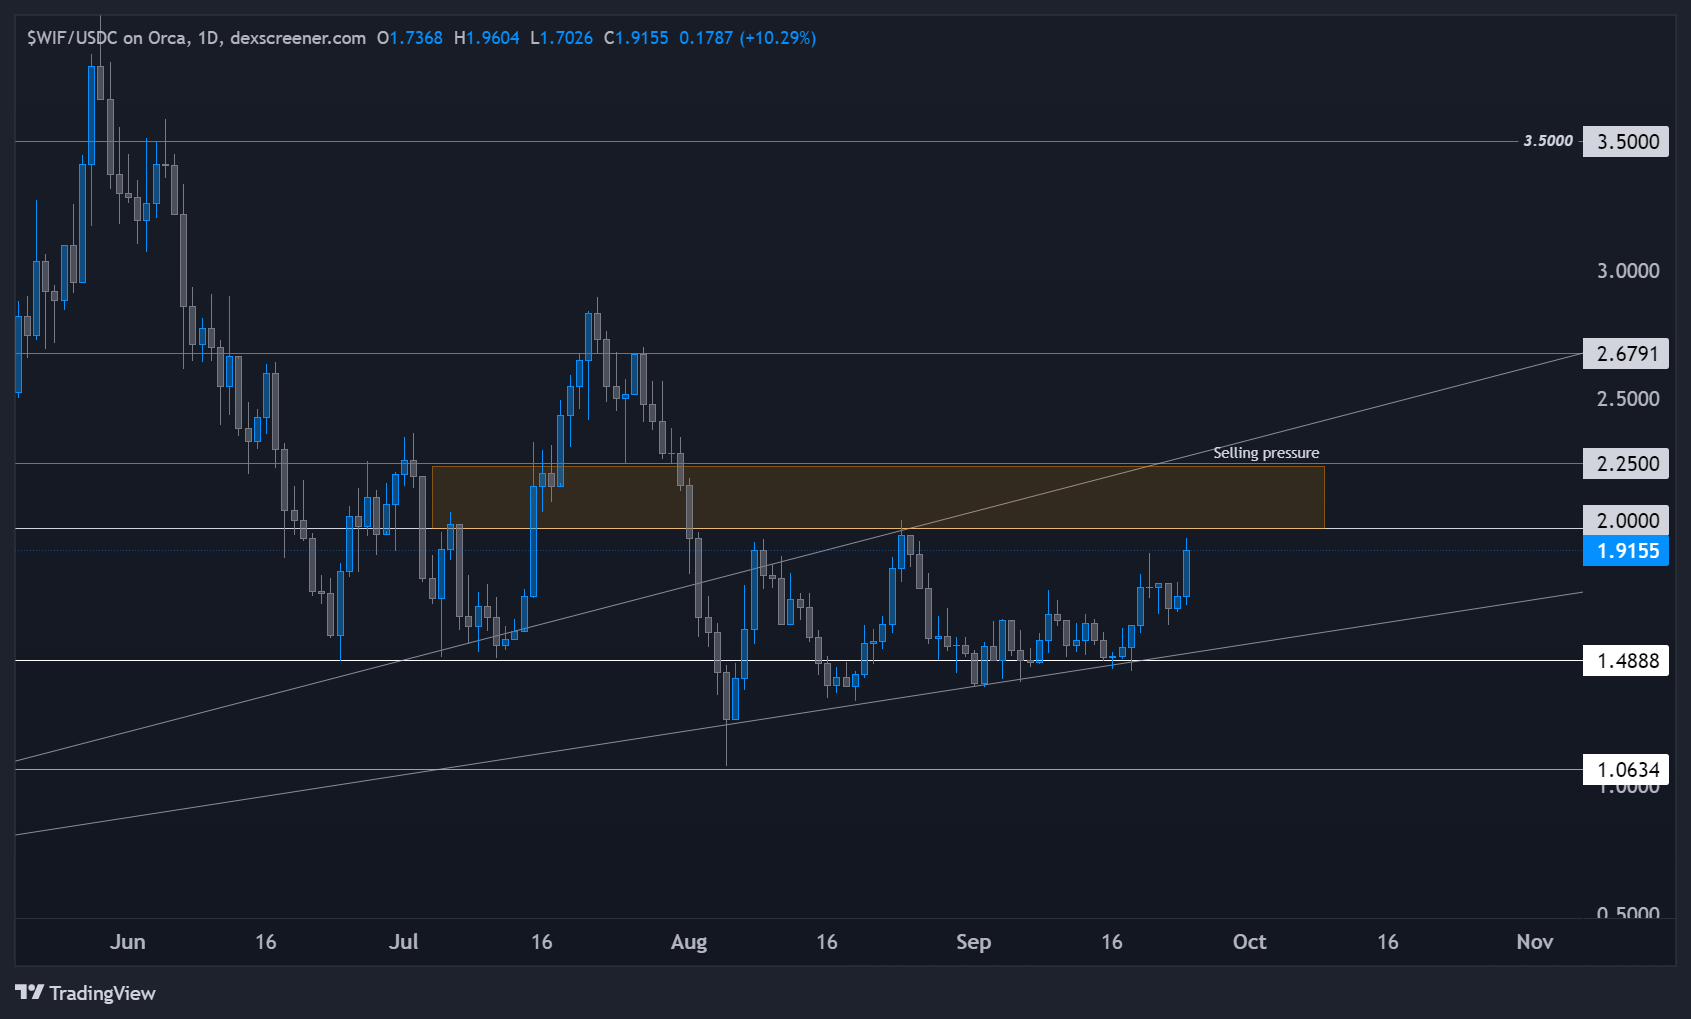
24 September 2024When we trade, understanding why resistance is formed is critical. Resistance levels are created because, at specific price points, sellers consistently step in. In your WIF trade, you've pinpointed a resistance around $2, which is where sellers have been actively entering the market.
Every time the price approaches that level, we see WIF rejected, causing a move lower. Now, why does this happen? When sellers either exit their positions or short the asset at that price, it makes it difficult for the market to break through. The key is recognizing that resistance means sellers are stronger than buyers at that level-until proven otherwise. That's why it's important to wait for a breakout.
Waiting for the breakout
What you've done is longed into resistance, which isn't necessarily wrong. In fact, some traders specialize in trading breakouts. But when you're buying right at a resistance level, it can be harder to manage risk. There's less clarity on where to place your stop-loss, and you're effectively betting that this time will be the one where resistance breaks. A more conservative approach is to wait for the breakout to happen and then enter on the retest of the former resistance, now acting as support.Why? Because once resistance breaks, it signals that the sellers at that level have been exhausted or overpowered by buyers. The price often retests the breakout level, and if it holds as support, it gives you much stronger confirmation that buyers are in control. At that point, your entry has better risk management since you can place your stop-loss just below the newly formed support.
Example of breakout and retest
If we look at WIF, there was a key level at $2.69 that served as resistance. We saw the price break through this level, and after the breakout, it came back to retest it. That retest gave confirmation that buyers had reclaimed control of the level, turning it into support. This is the kind of scenario where you have more confidence in entering a long position because you're now buying from a stronger level, knowing that buyers are stepping in to defend that price.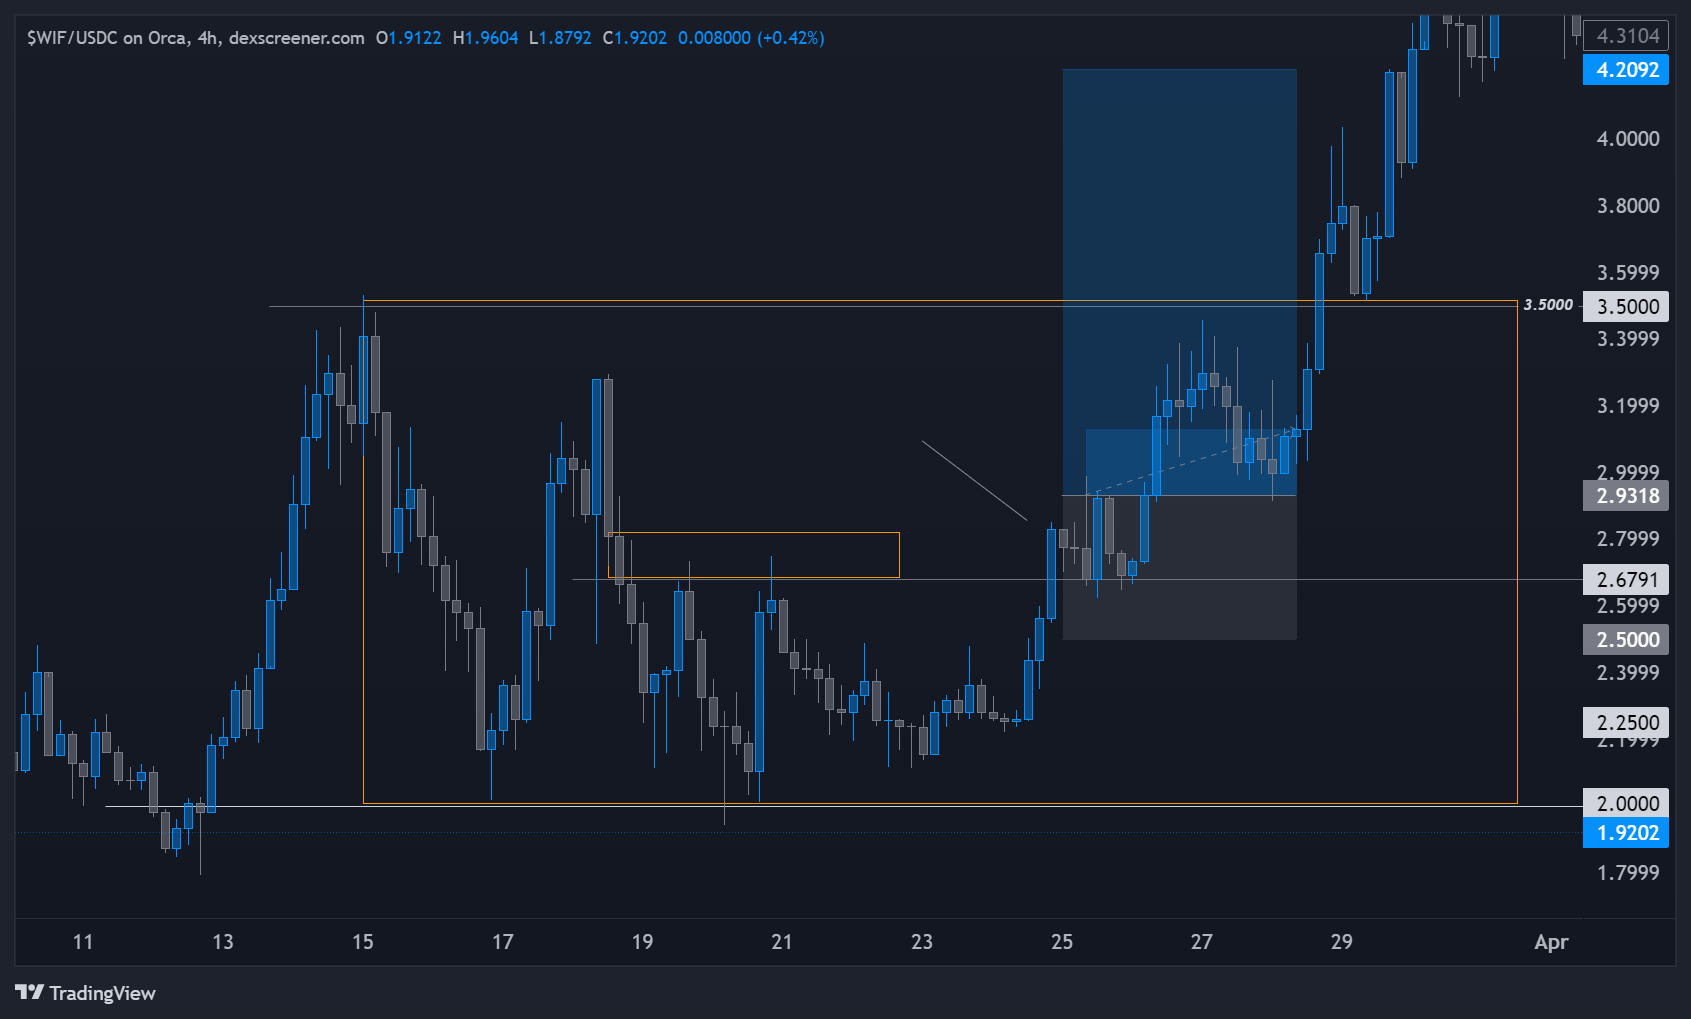
Cryptonary's take
Waiting for a resistance break and retest is a simple yet powerful strategy. It allows you to confidently enter trades, knowing that the previous sellers have been overcome. It also helps with risk management since you can place a stop-loss below the new support level. While breakouts can be tempting to trade right away, sometimes, a bit of patience can put the odds more in your favor. Just a little tip for future trades. You've identified the levels well, which could be another step to enhance your execution.Will WIF hit $2.20 soon?
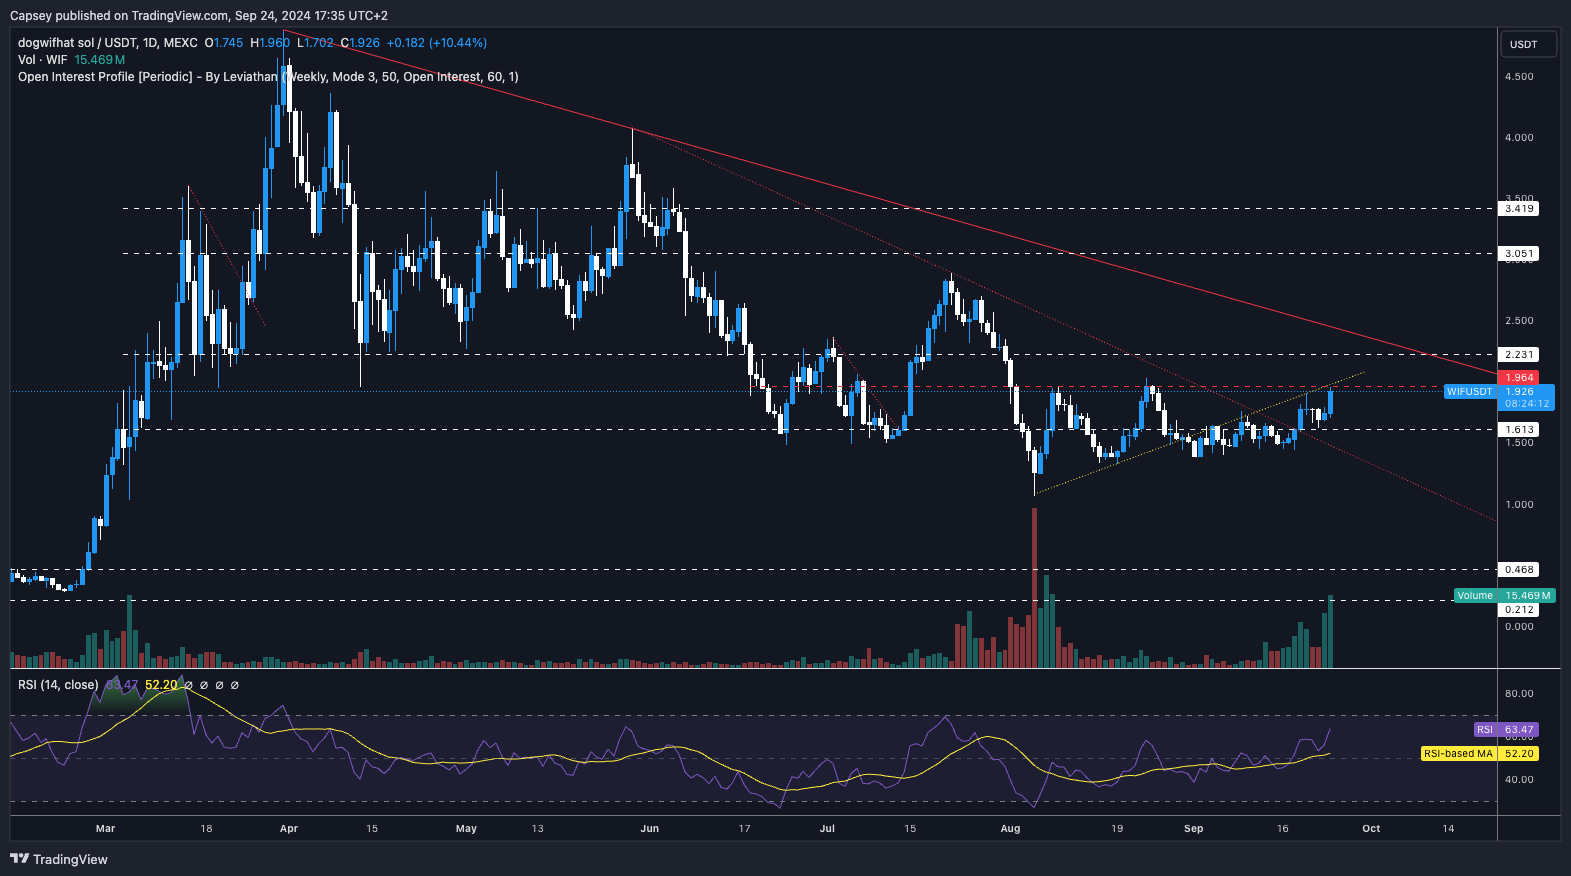
24 September 2024- Nice move from WIF overall to break out from the local downtrend line (red dotted line), reclaim above $1.60, and then begin the push higher to the local horizontal resistance of $1.96.
- $1.96 local resistance also converges with the underside of the local uptrend line (yellow dotted line). This area may, therefore, prove to be a short-term resistance area.
- Beyond $1.96, the main overhead horizontal resistance is at $2.20. If the price can comfortably break above this level, then there's little resistance (bar the main downtrend line) until $3.05.
- To the downside, we expect $1.60 to hold as support if the price pulls back as far as that.
- The RSI is pushing up towards overbought territory, but it's possible there's further upside to be had here in the short-term.
- What's also positive is that volumes have increased significantly. A significant move higher in price, backed by good volume, is a sign that the move higher is potentially more sustainable.
Cryptonary's take
A really positive move higher for price, which we felt was expected considering other SOL Meme's had been moving but WIF lagged. We've now seen it catch up somewhat. In the short-term, it's possible that $1.96 acts as a resistance, but we think in the coming week or two, WIF can retest $2.20, which will be the key testing area for the price.Can WIF surge past $1.96 resistance?
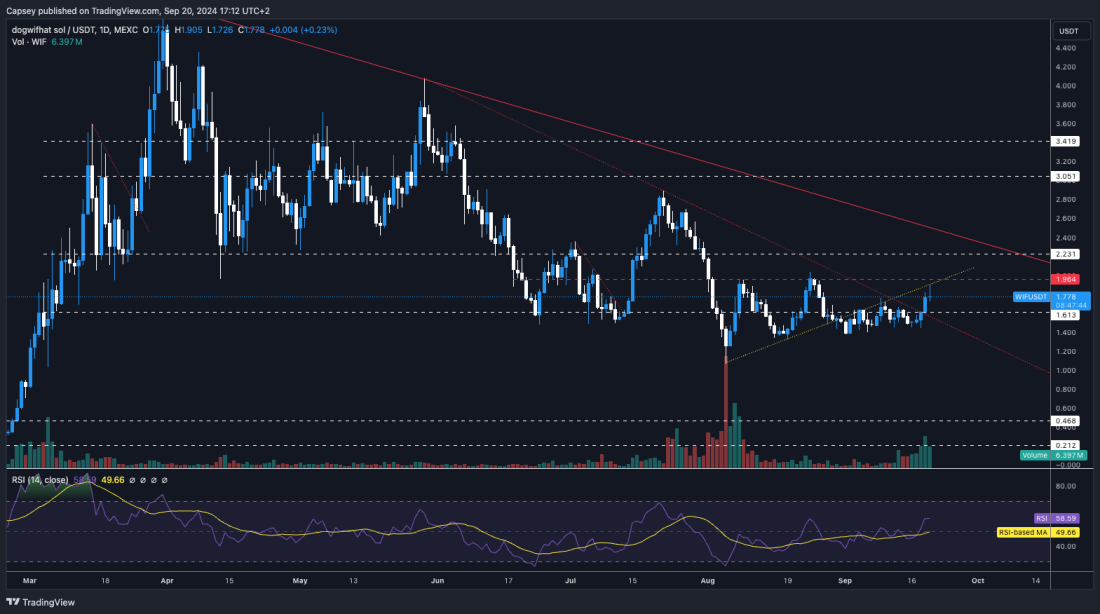
20 September 2024- WIF has broken above the horizontal level of $1.60, which was acting as a resistance for price.
- However, the price has now found new resistance at the underside of the local uptrend line (yellow line) and also the local horizontal resistance of $1.96.
- What's positive to see is an increase in volume and a breakout to the upside of the range rather than the downside.
- For the price to really clear higher, the price needs to reclaim the $1.96 level, and then ideally $2.20, as we see that as the last key local level before WIF can make a much larger move higher, potentially then progressing up to $3.05.
- On the downside, it's pivotal that the $1.50 to $1.60 area is held as a support zone.
Disclaimer: This is not financial or investment advice. You are responsible for any capital-related decisions you make, and only you are accountable for the results.
Cryptonary's take
In the short term, we think the rally for WIF might have stalled around here. But, we're hoping that WIF can now hold itself above $1.60 and establish itself in a new and higher range, which can then set up a major breakout in the weeks to come. In the immediate term, the level to reclaim is the $1.96 area. Above $2.20, we should see more explosive price action to the upside. Those are the key levels to watch for now.Will WIF hold $1.37 or break $1.96?
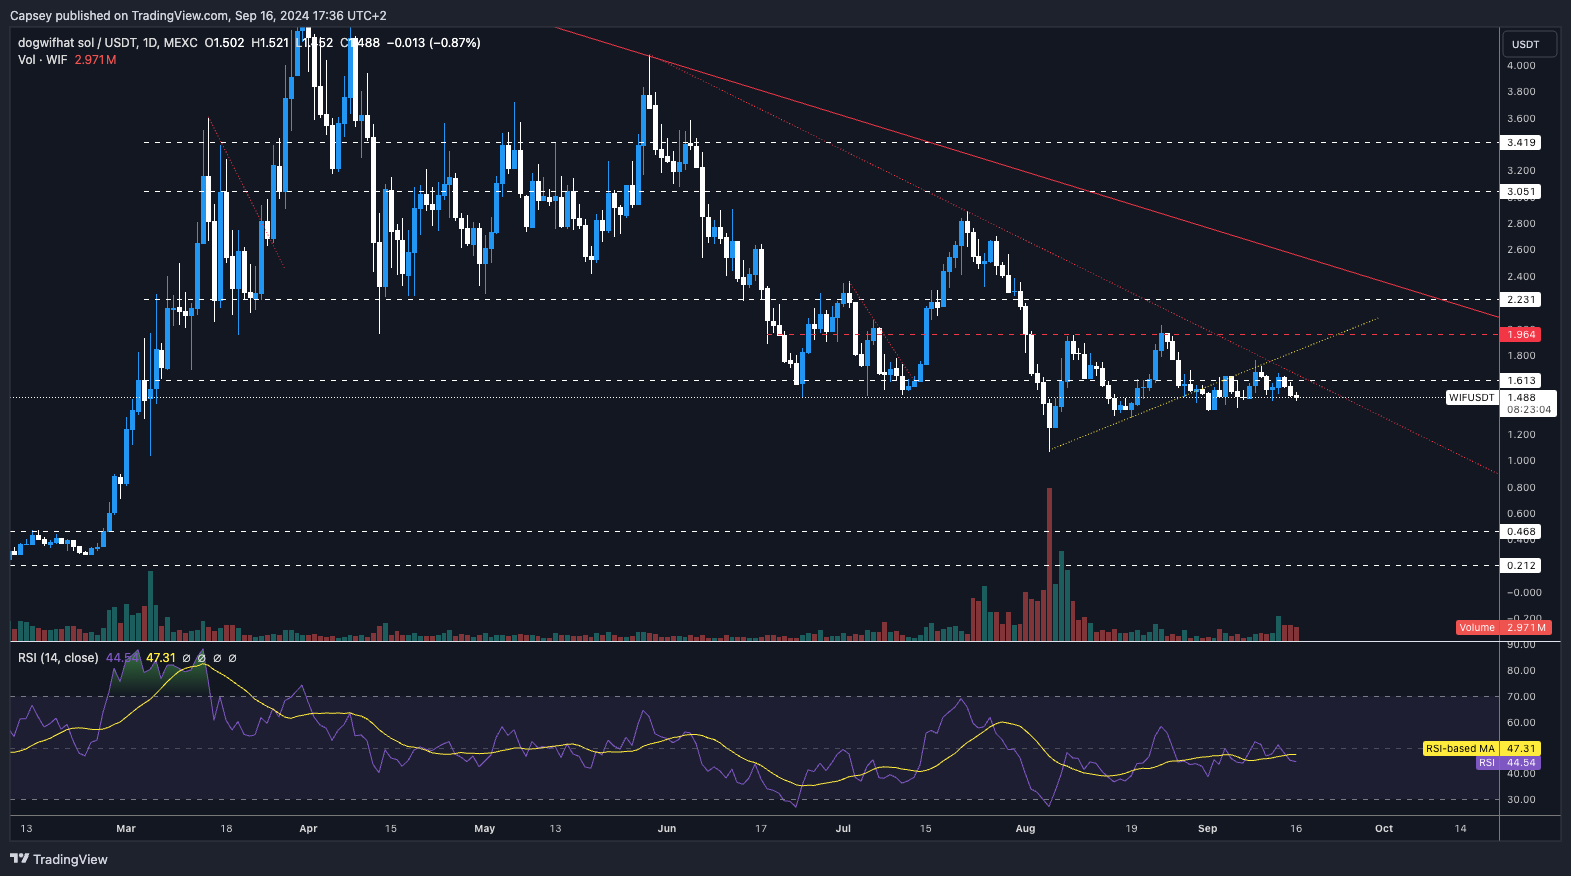
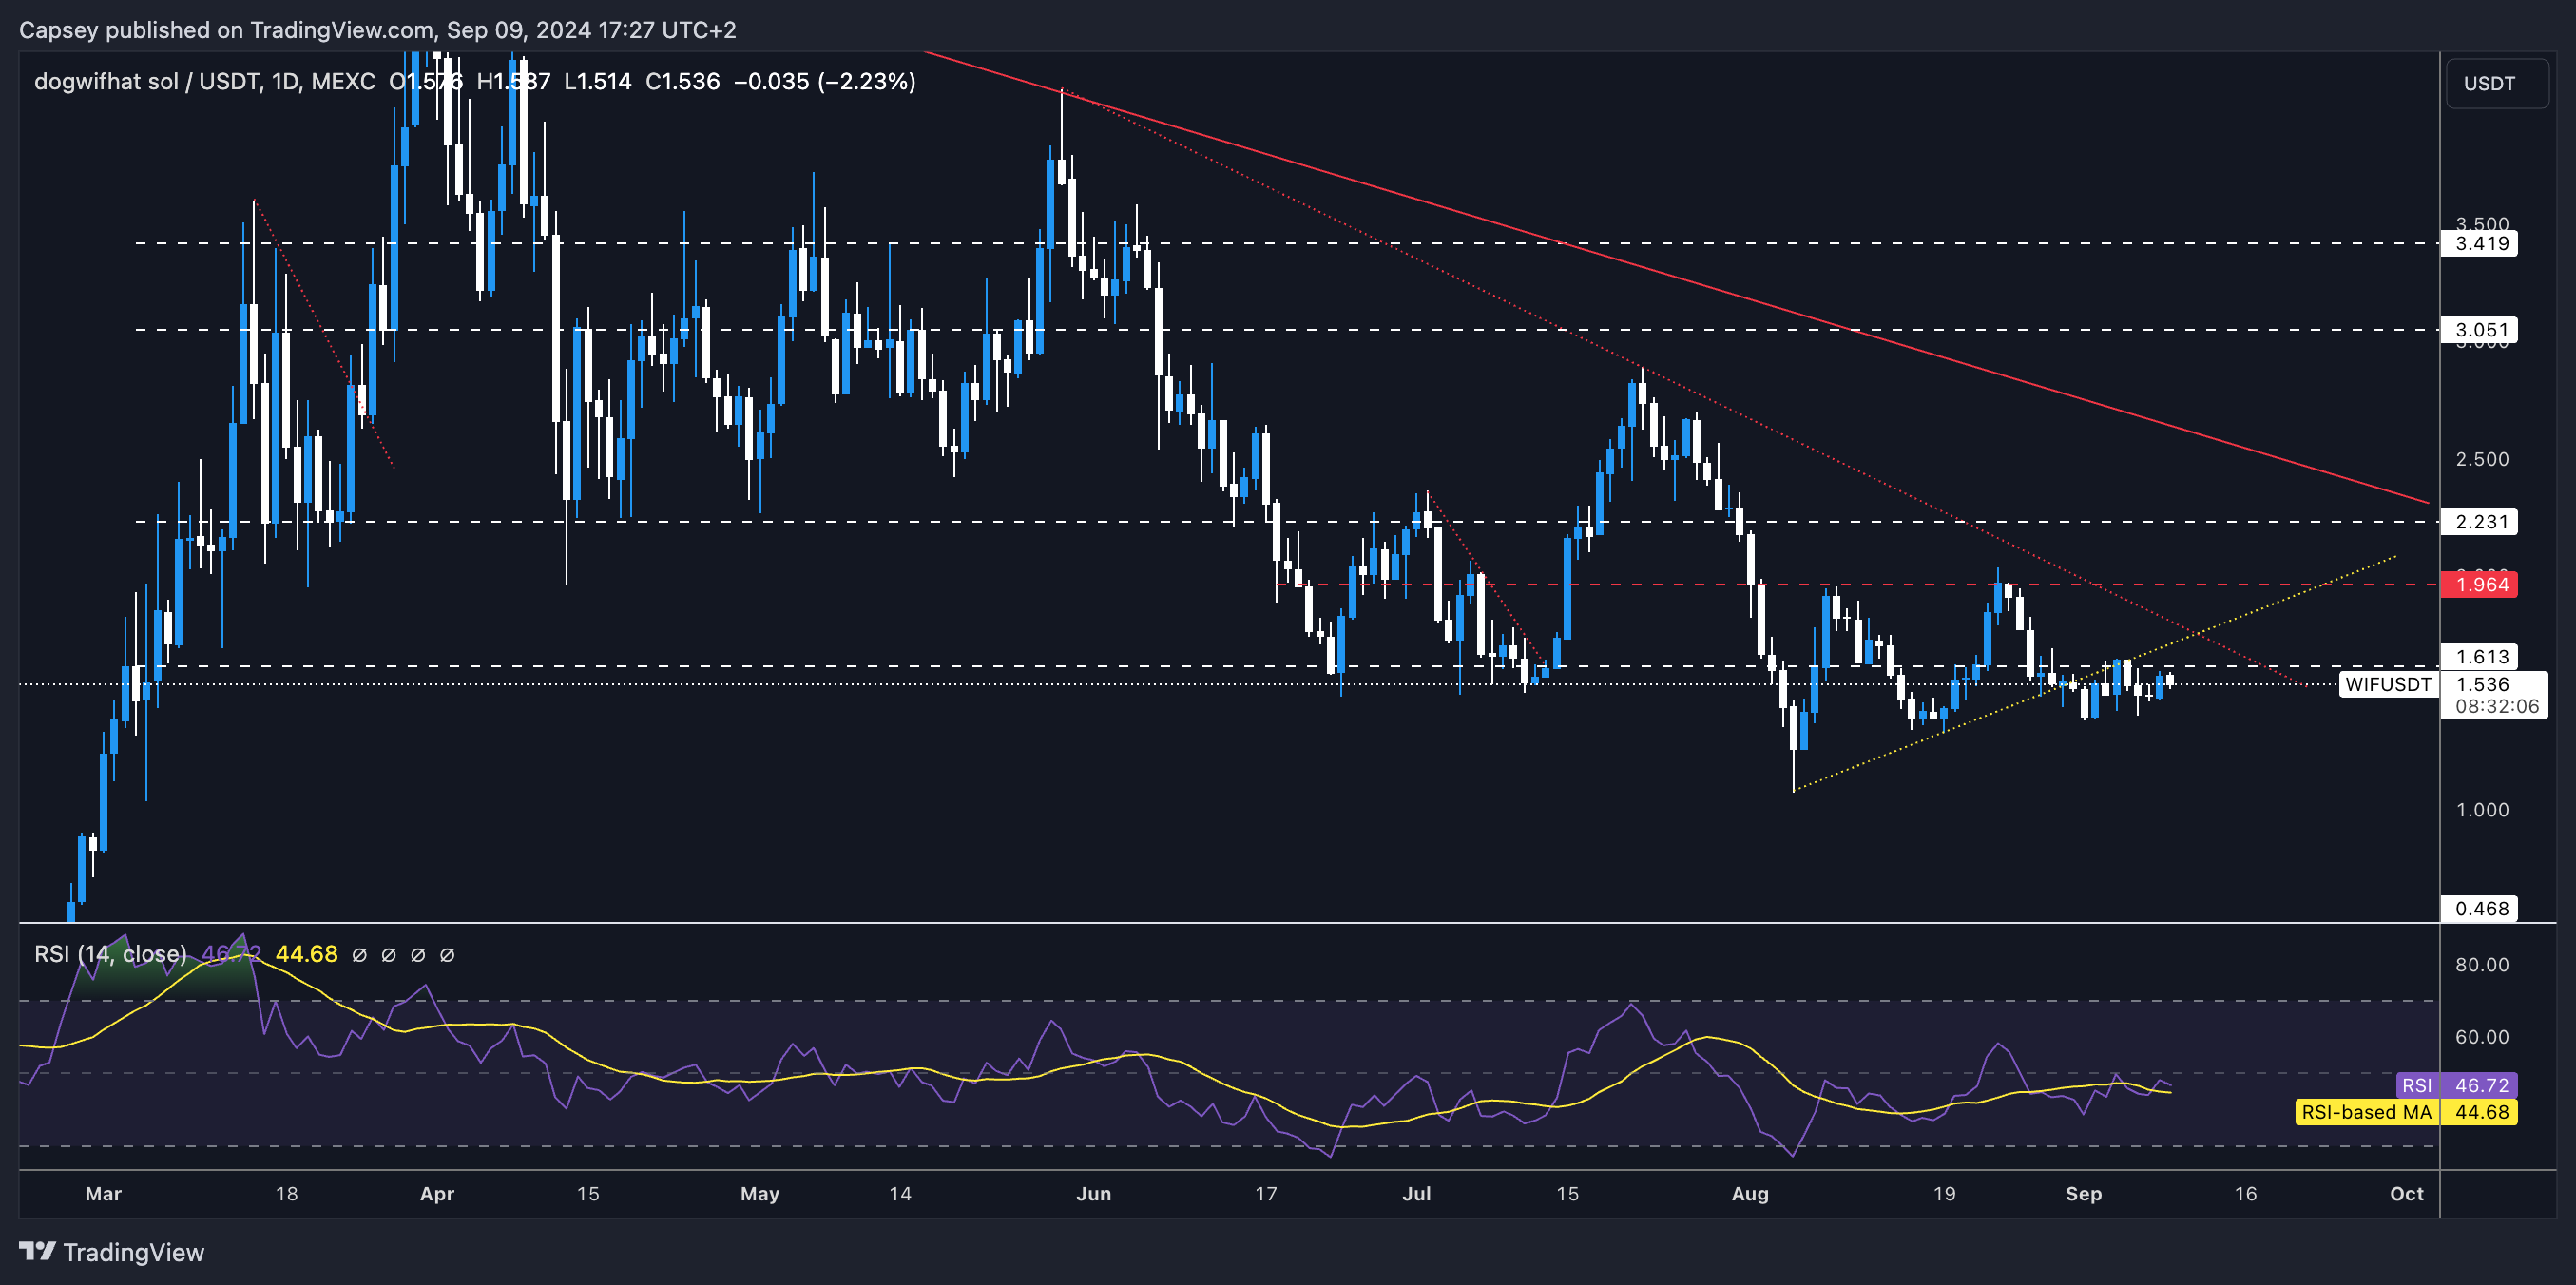
16 September 2024- WIF is still in its longer-term downtrend, and now the price is squeezing against the local downtrend line.
- Price is currently struggling to get back into the local uptrend, having found the underside of it as resistance a number of times now.
- The horizontal level of $1.60 also acts as a resistance that WIF is struggling to comfortably reclaim.
- Beyond $1.60, the local overhead horizontal resistance is at $1.96 and then $2.23.
- On the downside, we expect $1.37 to be local support, but the strongest support is between $1.00 and $1.20.
Cryptonary's take
Overall, WIF just seems to have lost its momentum, with traders focusing on other plays rather than trading WIF. However, we have seen volumes pick up in recent days, which could be a sign that some activity is coming back into WIF. If Powell delivers a dovish Press Conference on Wednesday (we think he will), then this might be the fuel that WIF needs to see a larger move to the upside. However, in the immediate term, we're not expecting a major upside, and therefore, we expect $1.96 to be a sticking point for WIF.Will WIF reclaim $1.60 or drop lower?
11 September 2o24- WIF is tightening within a narrow range, signalling the potential for a volatile breakout, but uncertainty remains as it struggles to reclaim key resistance levels.
- WIF is currently beneath its local uptrend line whilst it also remains in a larger, multi-month downtrend.
- WIF also remains beneath its major horizontal level at $1.60. In order to see bullish momentum return, WIF needs to comfortably reclaim this level.
- Above $1.60, the next major horizontal resistance is at $2.20, with a local level at $1.96.
- To the downside, if WIF were to lose the late $1.30s, then a retest of $1.20 is likely, although we'd expect strong demand at this level ($1.20).
Cryptonary's take
WIF is currently compressing into a tight range despite achieving significant volumes. This may result in a volatile breakout at some point in the near future. Unfortunately, we don't have a strong conviction on the direction yet.For this reason, we are remaining in spot positions (for the long term), and we'll look to add to our bags if the price dips to $1.20. Other than that, for now, we're just sitting patiently and not looking to take a lot of action.
Can WIF overcome $1.60 resistance, or is a pullback to $1.20 ahead?
10 September 2o24- WIF is currently beneath its local uptrend line whilst it also remains in a larger, multi-month downtrend.
- WIF also remains beneath its major horizontal level at $1.60. In order to see bullish momentum return, WIF needs to comfortably reclaim this level.
- Above $1.60, the next major horizontal resistance is at $2.20, with a local level at $1.96.
- To the downside, if WIF were to lose the late $1.30s, then a retest of $1.20 is likely, although we'd expect there to be strong demand at this level ($1.20).
Cryptonary's take
WIF is currently compressing into a tight range despite achieving significant volumes; this may result in a volatile breakout at some point in the near future. Unfortunately, we don't have a strong conviction on the direction as of yet. For this reason, we are remaining in Spot positions (for the long-term), and we'll look to add to our bags if the price does dip down to $1.20. Other than that, for now, we're just sitting patiently and not looking to take a lot of action.Will WIF reclaim $1.60 or drop?
9 September 2024- WIF is currently beneath its local uptrend line whilst it also remains in a larger, multi-month downtrend.
- WIF also remains beneath its major horizontal level at $1.60. In order to see bullish momentum return, WIF needs to comfortably reclaim this level.
- Above $1.60, the next major horizontal resistance is at $2.20, with a local level at $1.96.
- On the downside, if WIF were to lose the late $ 1.30, then a retest of $1.20 is likely, although we'd expect there to be strong demand at this level ($1.20).
Cryptonary's take
WIF is currently compressing into a tight range despite achieving significant volumes; this may result in a volatile breakout at some point in the near future. Unfortunately, we don't have a strong conviction on the direction as of yet.
For this reason, we are remaining in Spot positions (for the long-term), and we'll look to add to our bags if the price does dip down to $1.20. Other than that, for now, we're just sitting patiently and not looking to take a lot of action.
Will WIF retest $1.30 soon?
5 September 2024- WIF doesn't look to positive from a TA perspective here.
- Following the break below the $1.50 to $1.60 zone, WIF rebounded from the late $1.30's and is now running in to local resistances of the underside of the local uptrend line and the $1.60 area.
- In order for WIF to see more sustained upside, it'll need to reclaim above $1.90, which we don't expect in the immediate term.
- We do note that price is moving closer to the local downtrend line that could help price breakout higher in the coming week or two.
- To the downside, the $1.20 to $1.37 zone (range) should act as support if price does pull back more substantially again.

Cryptonary's take
Whilst the price here looks attractive if you have a long-term perspective, we're also not ruling out a retest of the $1.30's in the coming month. A retest of $1.20 to $1.37 would be a strong buy zone for us, with a view to holding for the next 6-9 (maybe even 12 months). For now, we're remaining concentrated in our portfolio, and we still really like WIF long-term. The key to the next month or so, will be just riding out the volatility and not getting cut up by it, and in the meantime, continuing to add towards the low end of the ranges.
Is a $2.23 breakout coming?
26 August 2024- WIF bumped into the underside of the $1.60 horizontal resistance a few times; however, we got a convincing break out above $1.60 last Friday.
- Price is now locally creating a bull flag. These have a bias to break out to the upside.
- To the upside, the resistances are the local downtrend line (red dotted line) and the horizontal resistance of $2.23.
- A break out above $2.23 would be the first sign of a bullish reversal. The main level will be if/when price breaks out above $3.05 and $3.40 (that range/zone).
- To the downside, we'd expect $1.60 to act as support. If that level is lost, we'd have to reconsider our current bullish bias on WIF.
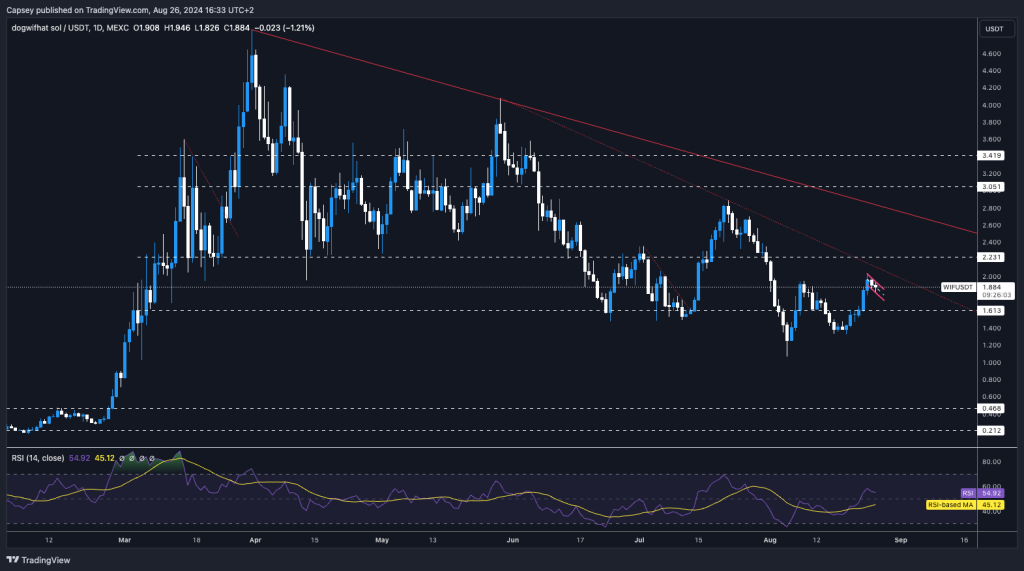
Cryptonary's take
WIF is at a local resistance here, although we do expect it to continue breaking out and retesting the main resistance at $2.20 sometime this week, possibly towards the end of the week. We would also expect the $1.70s to hold up as support in the immediate term.For now, we'll continue to play and monitor the range. The bull reversal occurs upon a breakout above $2.20.
Is $1.60 a resistance or a new support?
20 August 2024- We're pleasantly surprised to see WIF move back up to retest $1.60, having lost that level of support and fallen well below it.
- However, it's now likely that $1.60 acts as new resistance, so we wouldn't be too excited until $1.60 can be reclaimed and flipped into new support.
- If WIF were to pull back from here, we'd expect the $ 1.30's to be retested.
- To the upside, there seems to be a lot to do, especially considering the next major horizontal level (above $1.60) is $2.20, which would likely act as local resistance along with the local downtrend line.
- The RSI is in a clean middle territory, suggesting more upside.
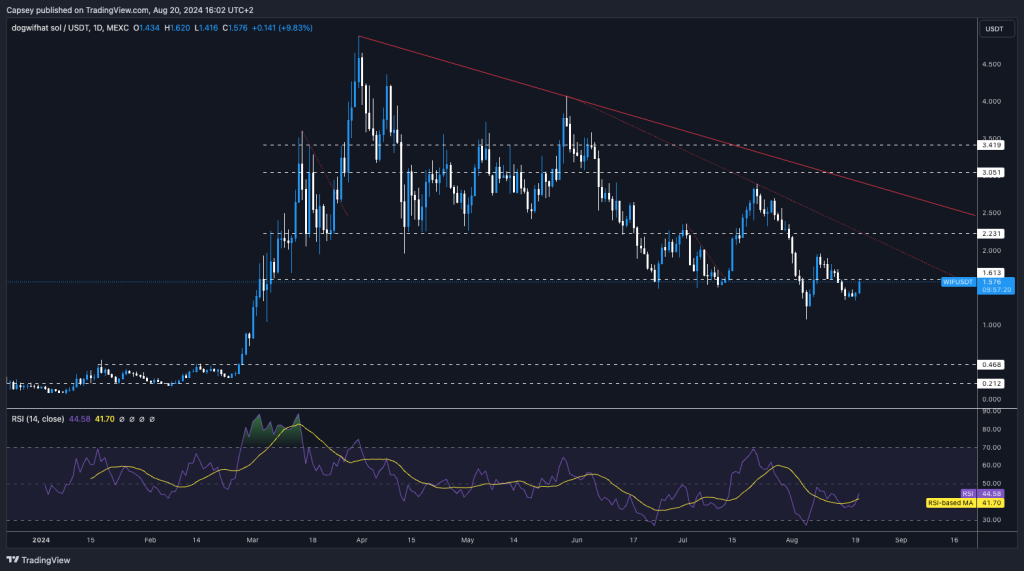
Cryptonary's take
In the immediate term, it's hard to be super positive about WIF here until it can convincingly close above $1.60. Over the coming days, we expect it to be range-bound between $1.30 and $1.60. We will reassess after J Powell speaks on Friday. If we see a convincing break out of $1.60, we would consider that a very positive development.Can WIF recover from $1.40 or drop to $1.20?
16 August 2024- WIF has unfortunately not played out as we had hoped in last Monday's Market Direction.
- WIF formed a bull flag above support, which in itself is a bullish pattern/price formation.
- Unfortunately, the price broke below the horizontal of $1.50 and has now fallen to $1.40 on weaker volumes.
- This potentially opens the door for a move back down to retest the $1.00 to $1.20 area, although we're not confident in this call, and we would expect that if price does revisit this area, that WIF is heavily bought back up.
- The RSI is at 36, so it's close to over sold territory, but not quite there yet.
Cryptonary's take
Whilst it's possible that WIF continues to slowly decline in the near-term, it's looking more and more under-priced. It's expected that on weaker volumes, that price will decline, but this has been a slightly larger decline that we might have expected 6-8 weeks ago for instance. If WIF hits oversold territory, we would look to begin bidding more heavily again there, but in all honesty, even current prices look attractive if you have a longer-term view on things.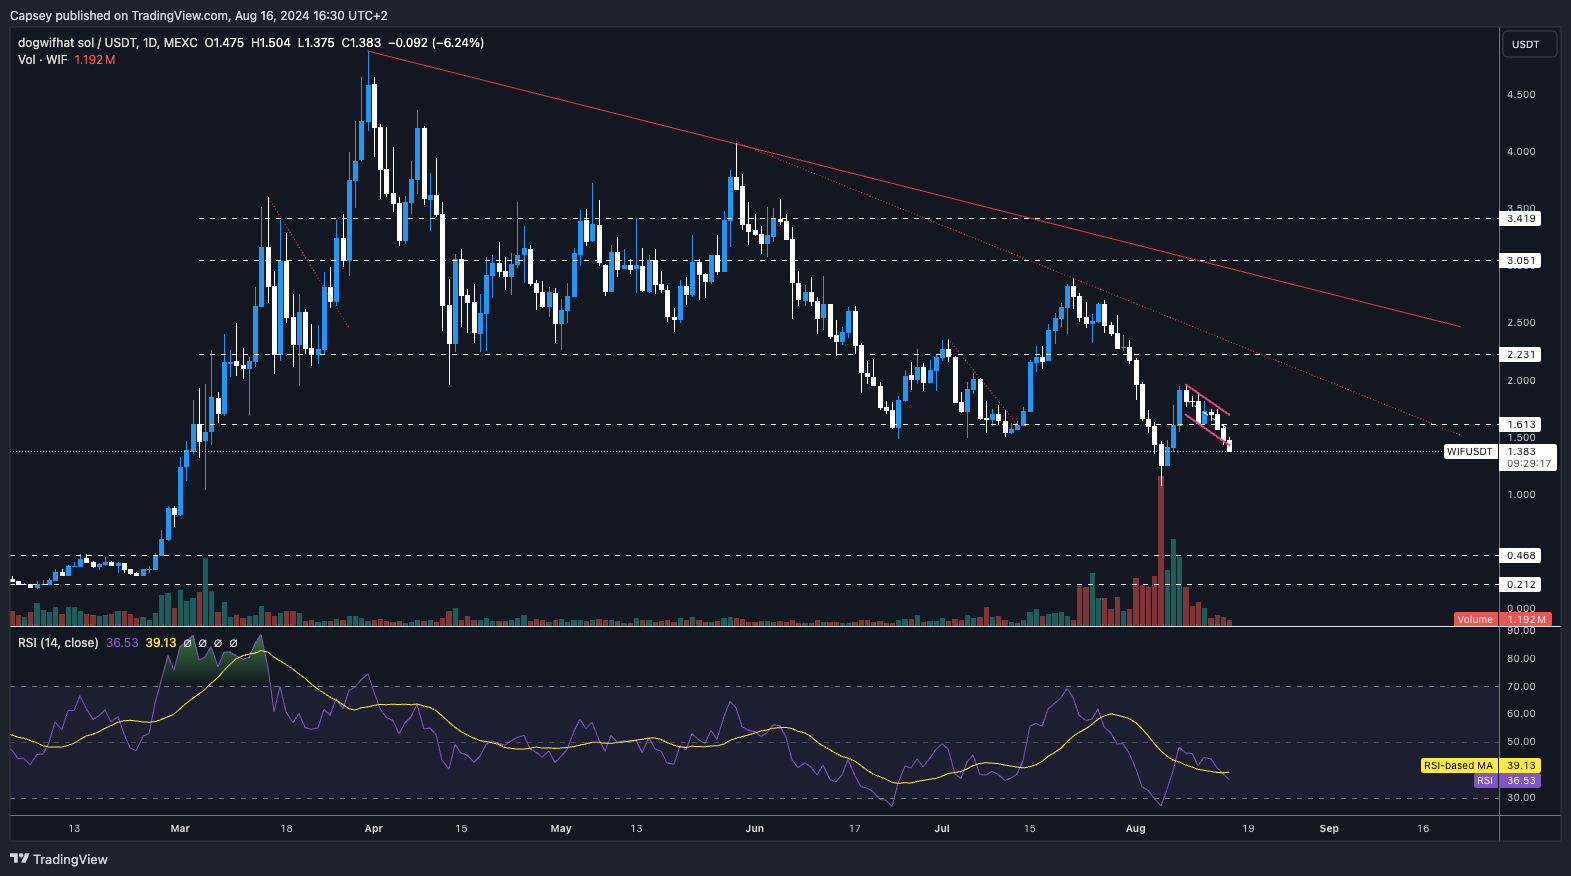
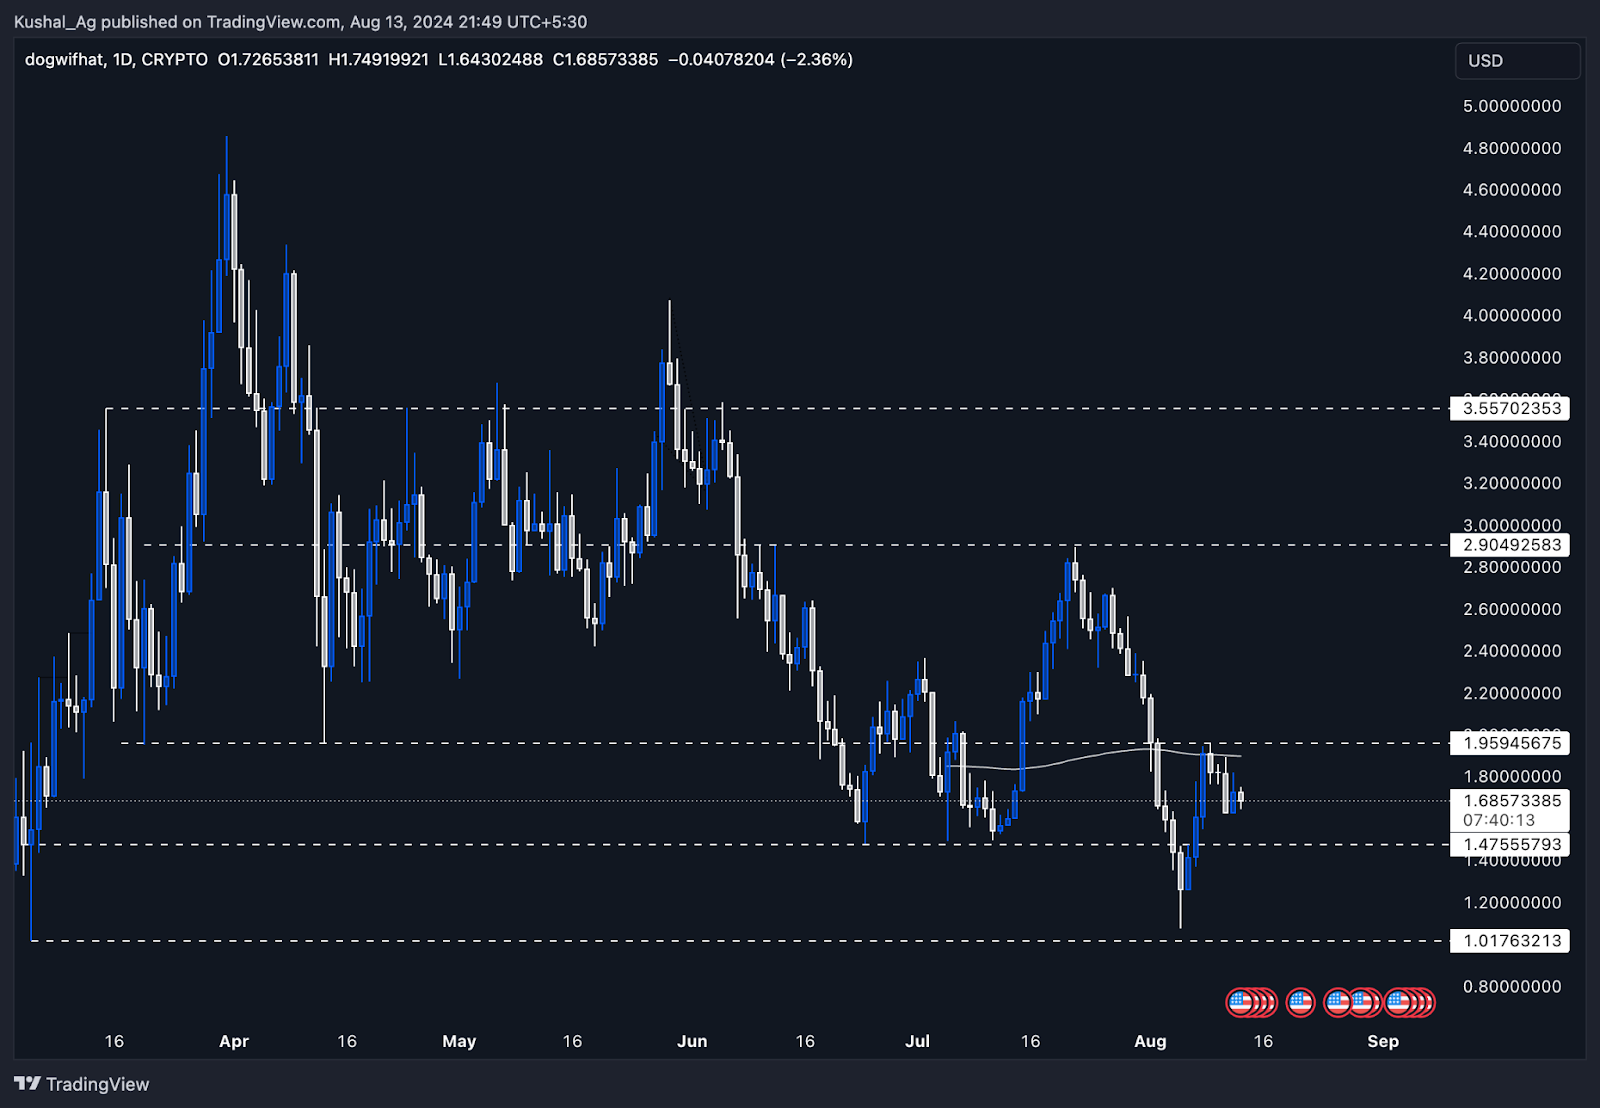
Will dogwifhat break the $2 resistance or consolidate?
13 August 2024- Current State: WIF is currently trading at $1.65, following a rejection from the $2 region. This level has proven to be a significant resistance point, which aligns with the 200 EMA, making it a critical hurdle for WIF to overcome.
- Key Observations:
- Resistance: The $2 level has acted as a strong resistance, as anticipated in our previous analysis. This rejection at $2 is notable because it coincides with the 200 EMA, reinforcing the importance of this level as a barrier that WIF must clear to continue its upward momentum.
- Support: Despite the rejection, WIF is holding above the 1.5 region, as we discussed earlier. The current price of 1.65 indicates that WIF is still within a healthy range, maintaining its position above key support levels.
- Potential Scenarios:
- Bullish Breakout: Breaking above the $2 resistance will be a challenge for WIF, but successfully reclaiming this level would likely lead to a strong upward swing. Once WIF clears this hurdle, we could see significant momentum, possibly targeting higher levels as part of a broader bullish move.
- Consolidation: If WIF continues to face resistance at $2, we may see further consolidation around the 1.5-1.65 range as it gathers strength for another attempt.
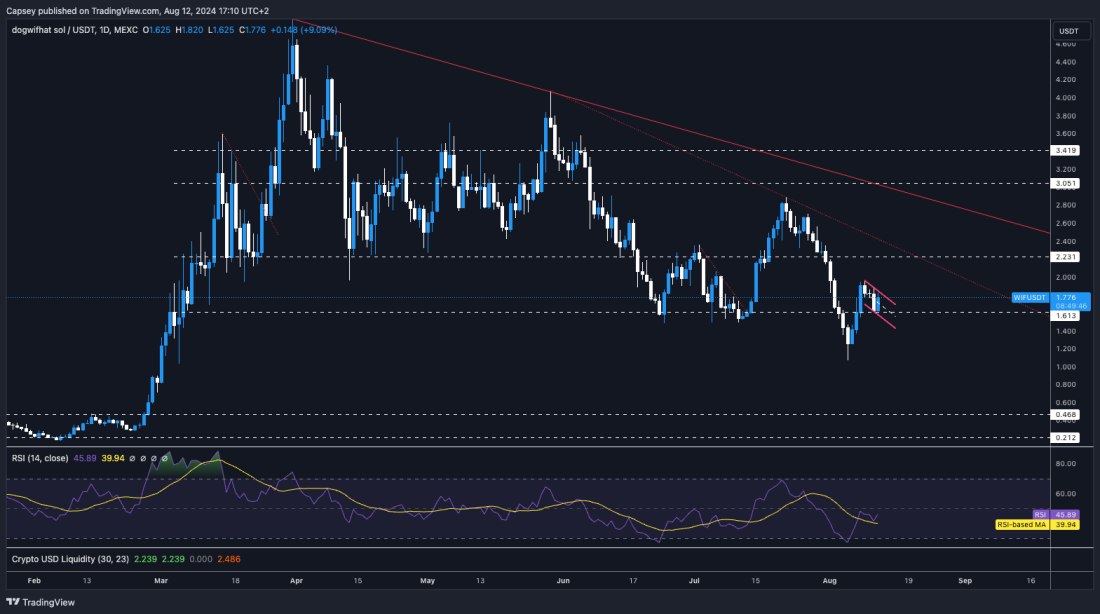
Can WIF break out and hit the $2.20 target?
12 August 2024- It's pivotal for WIF that it can hold above the $1.50 to $1.60 support range. A breakdown below this range would likely see a retest of the range lows at $1.10.
- WIF is forming a bull flag here above the $1.60 support; a break-out target would be the $2.20 area.
- $2.20 is a horizontal resistance, so it's possible that if the price does break higher, $2.20 acts as the next stumbling block for the price.
- If price does move higher to $2.20 and rejects, you'd want to see the $1.90 area act as a local support for price.
- There is a local downtrend line (red dotted line) that the price would also likely find resistance at if it broke out of its current bull flag.
- The RSI is in the middle territory, so this shouldn't cause any headwind for price.
Cryptonary's take
Ultimately, the price has to hold above $1.50 to $1.60, which we believe the price will as long as Bitcoin doesn't have a major breakdown and drag the rest of the market with it. If the price breaks down to $1.60, we will add more WIF to our spot bags.Assuming BTC doesn't drop in price substantially, which we don't think it will, we'd expect WIF to see more upside over the coming days/week. Price could break out of the bull flag and test the $2.20 horizontal resistance area. We would expect a first rejection at that level, but we'll reassess based on how the price behaves if it can get to $2.20.
Can WIF reach $2?
12 August 2024This article explores the current WIF price action and provides key strategies for accumulation. Explore our latest price prediction, key levels, and accumulation strategies. Stay informed and make smart investment decisions.
Please note: The video above is set to start at the 08:52, featuring an in-depth technical analysis of WIF (Dogwifhat).
- Hypothesis: WIF continues to be one of our top plays this cycle. The current price action suggests that WIF might be nearing a bottom within its trading range. The $1 to $2 range offers a great opportunity to accumulate, especially given our long-term conviction in this asset. This range allows for flexibility in building a position, with the potential for substantial upside as the market recovers.
- Key level: $1.00 - $2.00
- The play: DCA (Dollar-Cost Averaging) within the identified buy box. This approach will allow you to accumulate at a range of prices, reducing the risk of entering all at once. As WIF approaches these levels, staying patient and disciplined is crucial, gradually building your position.

Disclaimer: This is not financial or investment advice. You are responsible for any capital-related decisions you make, and only you are accountable for the results.
Cryptonary's take
Now is not the time to panic. The markets never provide smooth sailing. You must stay calm and composed and adapt your strategy to be positioned for the best opportunities.For now, we are dialled into the barbell strategy until things change.
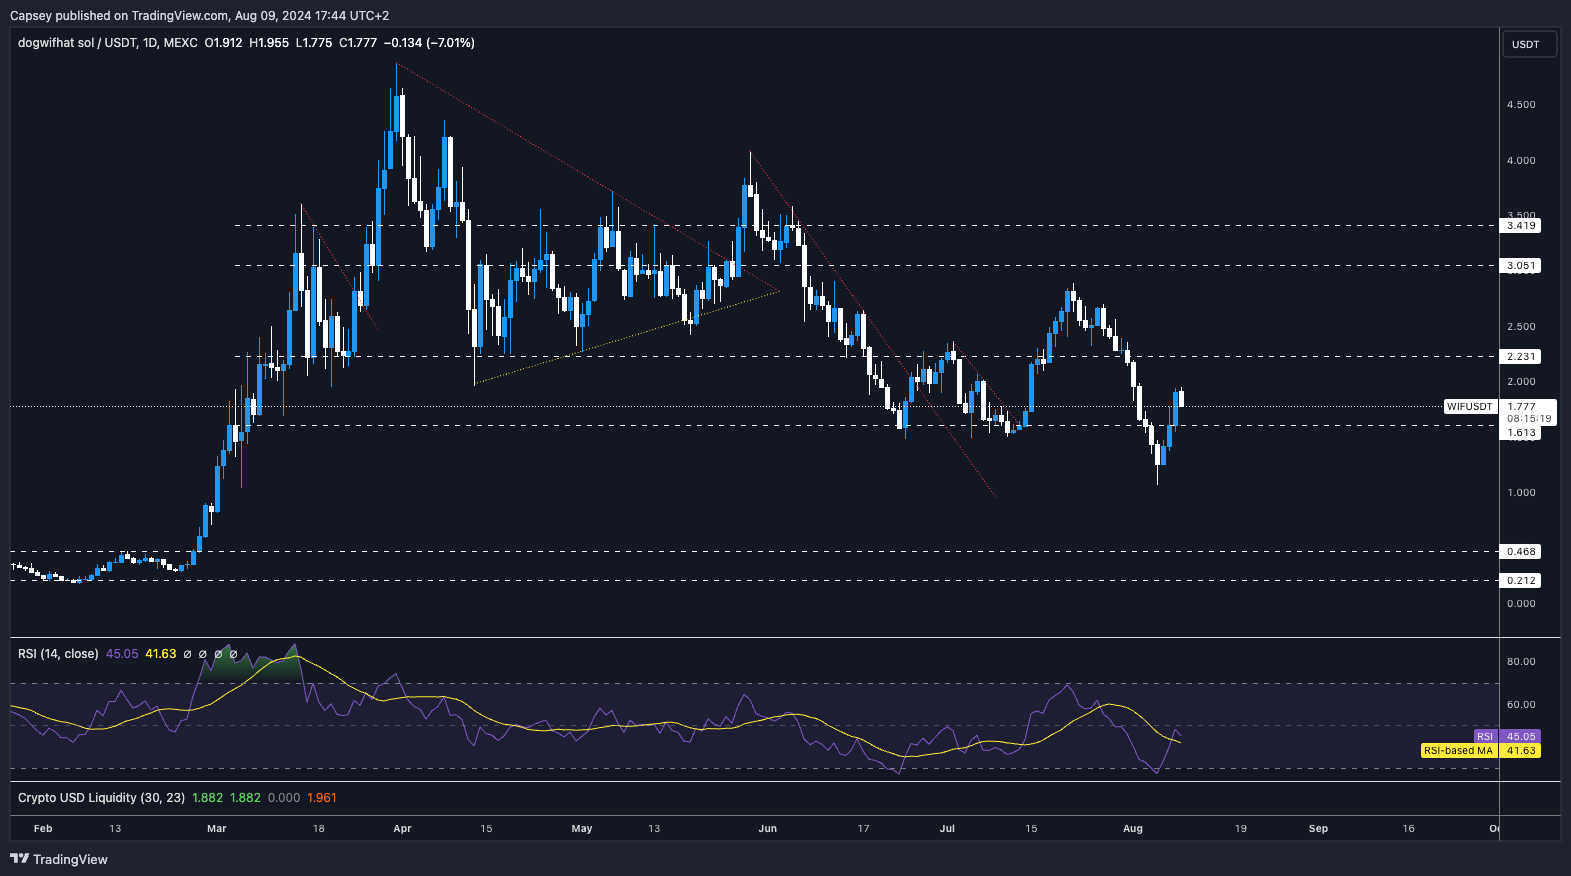
Is a $2.20 breakout next?
9 August 2024- The most pleasing part for WIF is that it has been able to get back above the $1.60 level, which was prior support for price. We feared it may become new resistance, but luckily, it didn't.
- If price pulls back, we'd want to see $1.60 become support again, and price bounce off of that level.
- Beyond this, the horizontal resistance we'd want the price to reclaim is the $2.23 level. We believe a break above $2.20 would be the bullish reversal.
- The RSI is in the middle territory, having bounced nicely from oversold levels.
Cryptonary's take
Over the coming days, we expect the price to pull back with the rest of the market. Our hope, but potentially not outright expectation, is that the price can hold support at $1.60. If so, this would be a bullish sign. If not, then we would be worried that the price could retest the lows around $1.10. But we do think $1.60 can hold.Beyond the next few days, we see the price being range-bound between $1.50 (assuming there are small dips/wicks below $1.60) and $2.20.
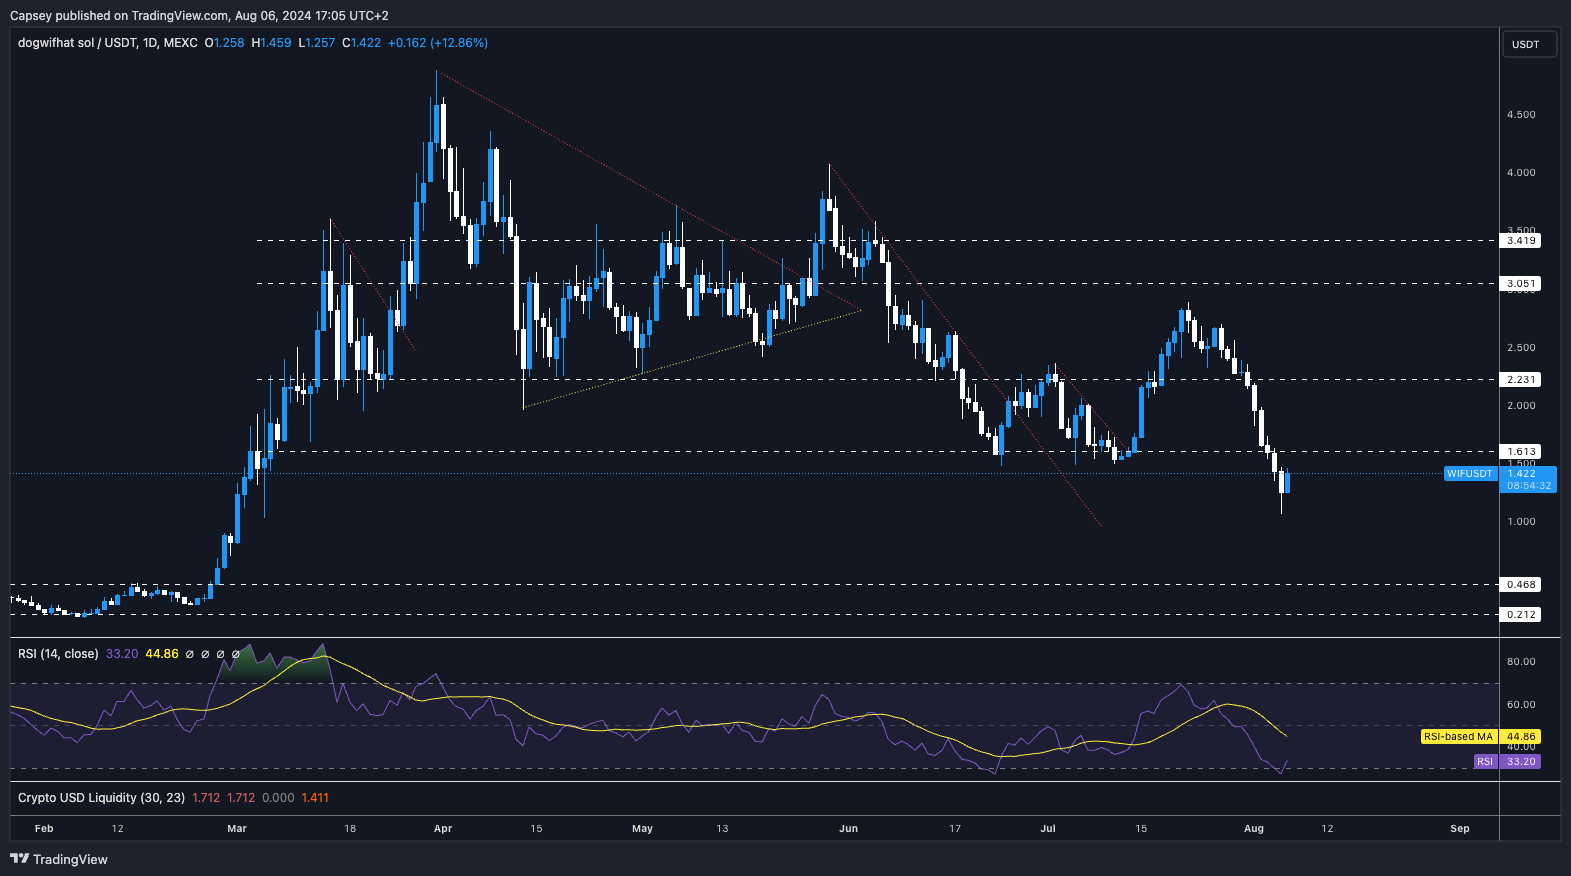
Is a breakout imminent?
9 August 2024Is DogWifHat (WIF) gearing up for a breakout from its consolidation phase? In our analysis of DogWifHat (WIF), we find ourselves in a unique position where the asset is consolidating within a defined range, offering potential opportunities for strategic accumulation.
The key area of focus for us is the yellow box region, spanning from $1 to $2. This zone represents a critical support area where WIF has shown resilience after the recent sell-off, followed by a reclaim of key levels. The price action within this range suggests a period of consolidation, which often precedes significant price movements.
From a technical perspective, the current weekly candles are indicative of indecision in the market. However, the context of the recent sell-off and subsequent recovery leans more towards a bullish outlook. The evenly sized bodies of the last few weekly candles suggest that the market is stabilising, potentially gearing up for a more decisive move in the coming weeks.
This period of consolidation could be an excellent opportunity for investors to accumulate positions within the $1 to $2 range, especially given the potential for significant upside.

What is Dogwifhat: Dogwifhat (WIF) has emerged as the leading meme token of this cycle within the dog category. Inspired by the viral "dog wif a hat" meme, this playful token captures the essence of internet culture while riding the wave of Solana's growing popularity.
At Cryptonary, we're particularly bullish on Solana this cycle, and WIF aligns perfectly with this Meme supercycle sentiment along with being on the Solana Chain, making it a significant asset in our portfolio.
WIF’s ATH is $4.85. We hold WIF at an average price of $0.03 because we believe in its potential as the dominant meme token in the dog category this cycle.
Is $1.5 support stable?
08 August 2024This article provides a comprehensive technical analysis of the current Dogwifhat (WIF) market trends.
Please note: The video above is set to start at the 16:30 minute mark, featuring an in-depth technical analysis of Dogwifhat (WIF).
WIF has shown relatively muted movement compared to other assets, maintaining stability within the $1.5 range. This level serves as a crucial support zone, providing a solid accumulation point for long-term investors. Despite broader market volatility, WiF has held its ground, indicating underlying strength.
Disclaimer: This is not financial or investment advice. You are responsible for any capital-related decisions you make, and only you are accountable for the results.
Accumulating positions within this range could yield substantial returns, especially if our base case price target of $10 is achieved. The current price action suggests a consolidation phase, offering an ideal opportunity to build positions in anticipation of future gains.
Educational insight: Consolidation phases are periods where an asset's price moves within a narrow range, indicating a balance between buyers and sellers. Recognising these phases allows traders to identify potential breakout opportunities and position themselves for future gains. For WIF, understanding its consolidation pattern provides a strategic advantage in accumulating positions.
What's next after $1.60 break?
7 August 2024Overview of WIF's recent price movements and potential future trends.
- At first glance at this chart, you’d be hoping that this move below $1.60 is a deviation, but for that, we’d need to see quite a quick reclaim back above the horizontal level of $1.60.
- WIF is coming off oversold levels, so a more significant bounce could be on the cards. The testing area would be $1.60.
- Beyond $1.60, the horizontal resistance would be at $2.23.
- If the wick is retested (between $1.07 and $1.20), we’d be buyers of this level.
Cryptonary’s take
We love WIF as a play for this cycle. However, it’s hard to be super bullish in the short term until/unless the $1.60 level is reclaimed. Therefore, we’ll keep this simple. We’d be buyers on retests of the lows.For those who added WIF and POPCAT yesterday at the lows, if you used more USDT than you might have liked (I am myself in this boat), $1.50 to $1.60 should be the area to trim some of the exposure you added yesterday. This is just to de-risk, not an outright call to sell Spot bags. It’s only if you used up more USDT than you were comfortable with yesterday.
Will WIF reclaim $1.60, or Is a deeper pullback ahead?
6 August 2024- At first glance at this chart, you'd be hoping that this move below $1.60 is a deviation, but for that, we'd need to see quite a quick reclaim back above the horizontal level of $1.60.
- WIF is coming off oversold levels, so a more significant bounce could be on the cards. The testing area would be $1.60.
- Beyond $1.60, the horizontal resistance would be at $2.23.
- If the wick is retested (between $1.07 and $1.20), we'd be buyers of this level.
Cryptonary's take
We love WIF as a play for this cycle. However, it's hard to be super bullish in the short term until/unless the $1.60 level is reclaimed. Therefore, we'll keep this simple. We'd be buyers on retests of the lows.For those who added WIF and POPCAT yesterday at the lows, if you used more USDT than you might have liked (I am myself in this boat), $1.50 to $1.60 should be the area to trim some of the exposure you added yesterday. This is just to de-risk, not an outright call to sell Spot bags. It's only if you used up more USDT than you were comfortable with yesterday.
WIF crypto price prediction for today: Can it reclaim $2.20 today?
1 August 2024Our WIF analysis uncovers a fascinating scenario: a negative funding rate that's setting the stage for a possible short squeeze. But that's just the beginning.
Is WIF approaching oversold territory, and if so, what does that mean for you? Whether you're considering adding to your position or eyeing a new entry, this breakdown of WIF's market structure and potential is an essential read.
- WIF's current Funding Rate is negative, meaning that traders are paying a premium to be Short. This can become a dangerous setup if the Open Interest increases, possibly resulting in a Short squeeze. We're not at this point just yet, though.
- On the recent price pullback, a potential landing zone for price would have been the horizontal support of $2.20.
- Price was unable to find support at the local level and has now dropped to test $2.00. However, the major horizontal support is at $1.61.
- If the price were to pull back to the $1.60 to $1.80 range, the RSI would likely be in oversold territory, providing an attractive opportunity for a buy.
- On the upside, the key level in the short-term to reclaim is $2.20. Beyond that, it's $3.05.
Cryptonary's take
WIF remains one of our picks for this cycle; therefore, it's a coin to which we'd continue to look to add exposure. The value territory for WIF is between $1.60 and $1.80, and that's where we'd be strong bidders if WIF were to get that low. Overall, we remain constructive on the market and look to add to what we believe will be the cycle winners. We see WIF as one of those.
Why $2.20 is a critical buy zone?
24 July 2024WIF has seen an increase in Open Interest, but nowhere near the highs it saw back in late May. The funding rate is at 0.01%, indicating that the leverage that has come on is the majority, Longs. WIF has done superbly to climb back above $2.20 and make further progress higher.
Price has stalled around $2.80 after the RSI moved into overbought territory. To the downside, the $2.20 area seems to be the most likely major support. If price were to re-visit this area, we would consider buying more WIF. To the upside, the key level to still break above is $3.05. $10 is likely a very conservative price target.
Cryptonary's take
The last ten days or so have shown us that when WIF begins a move, it can really move, and if you're not exposed, you feel very left behind. WIF is one of our best long-term plays for this cycle. Therefore, we continue to hold Spot bags, and we'd consider adding to our Spot bags if price retests $2.20. However, we did risk-on more with WIF in the $1.60s two weeks back. For those under-exposed, $2.20 is a potential area to add to bags. In the next 6-12 months, we expect upside price targets well north of $10. $10 is likely a very conservative price target.
Recommended from Cryptonary


