Save 23% ($351) & Get a Free 1-1 Call with our Team ⏰ : 0d 2h 59m 43s

- Key labour market data is coming Friday, including non-farm payrolls and the unemployment rate.
- Powell speaking today; markets eye potential rate cuts in November.
- Israel kills Hezbollah’s Nasrallah, but markets show little reaction for now.
- Risk assets are breaking out, with attention on the Russel 2000 and Crypto.
- Cryptonary's take
Disclaimer: This is not financial or investment advice. You are responsible for any capital-related decisions you make, and only you are accountable for the results.
This week's data & Powell speaking later today
The major data this week is on Friday, where we have Non-Farm Payrolls and the Unemployment Rate. The expectation is for Non-farmers to come in at 130k and for the unemployment rate to come in at 4.3%. If the data comes in as forecasted, the markets will take that positively, but we likely won't see risk assets get a major rally off the back of it.
The reason is that risk assets have rallied due to the current 'goldilocks' environment we find ourselves in (growth is good, inflation has come down significantly, and the labour market is holding in there). So, a labour market continuing to hold up continues to support this 'goldilocks' environment, and risk assets can continue their grind higher.
But, if the data begins to materially weaken, then the market might price in a hard landing - risk assets would come down considerably. So, the risk here is a downside if the data weakens. In terms of numbers, weakening would look like sub 100k Non-Farms and an Unemployment Rate of 4.4%. But before Friday, we have Job Openings on Tuesday (tomorrow).
The expectation is for 7.65m, slightly less than the 7.67m print we saw last month. Markets will just want to see this data point hold up. Anything under 7.2m might see risk assets sell off slightly.
Alongside the above, we have more FED speak this week, with the most notable of these coming today from Chair Powell, who speaks at the National Association for Business Economics (6:55 PM UK Time). The markets will be looking for any clues as to how Powell sees rate cuts going forward and how high the bar is for the FED to deliver another 50bps cut at the early November FED Meeting - that'll likely be dependent on labour market data.
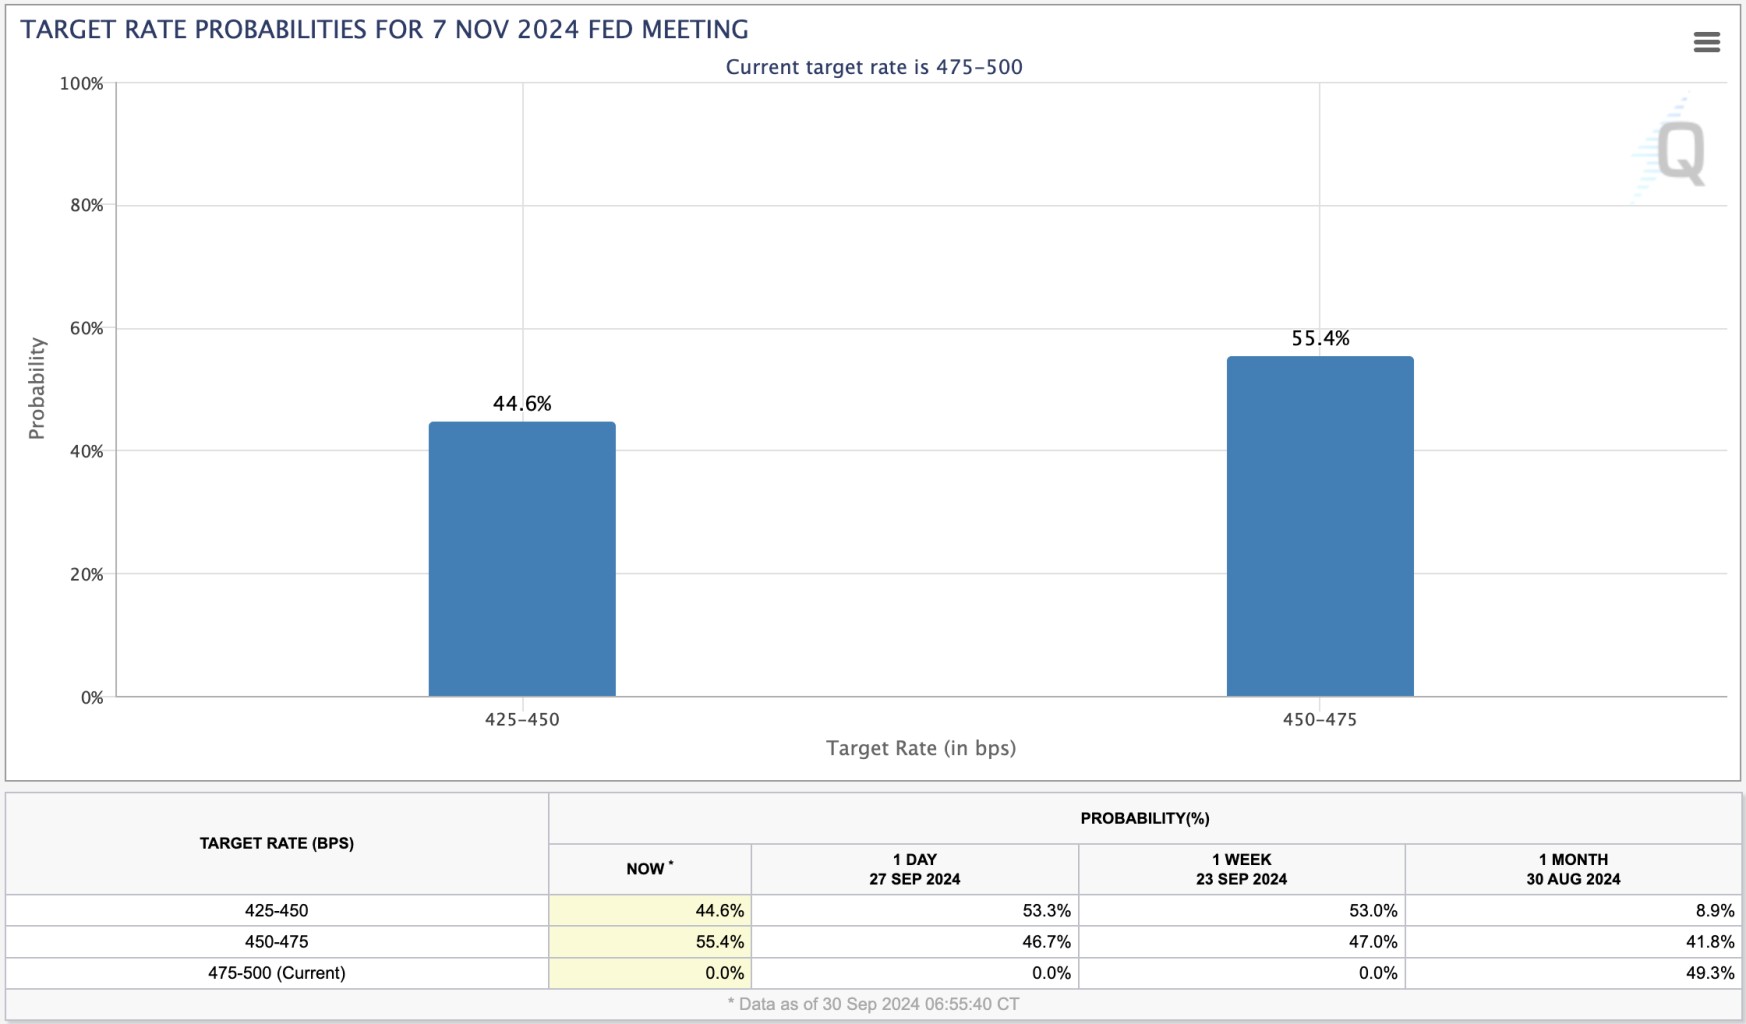
Currently, the market is pricing a 44.6% chance of a 50bps cut, with a 55.6% chance of a 25bps cut at the November Meeting. However, there is still lots of data to come out between now and that FED Meeting. We will get two Unemployment Reports between now and then. This will likely mean Powell is noncommittal in his comments today.
Probabilities of FED interest rate cuts for the November FED meeting:
Israel killing Hezbollah's Nasrallah & markets impact
Over the weekend, Hassan Nasrallah (leader of Hezbollah) was killed by US-supplied bunker-buster bombs that were launched into Lebanon by the Israelis. This is an escalation that now puts Iran in an awkward position; do they retaliate and engage in what would then be an all-out war, or do they do nothing and appear weak, potentially encouraging Netanyahu even more?
So far, markets haven't reacted to the seeming escalation, and that is likely due to the fact that Israel has proven they are far more competent than the Iranians. Markets doubt that Iran will respond simply because they're not competent enough to deliver an effective response that will then give them the upper hand.
Israel has been backed by superior US weapons, and the Israeli Mossad (secret service) has proven its reach - simultaneous blowing up of Hezbollah member pagers and also the explosion deep in Tehran that killed Hamas political leader Ismail Haniyeh. This can all change if Iran responds directly and if the response is far more forceful, but currently, the markets are doubting that the Iranians will do this, and hence, we have seen a muted response so far. However, we need to keep a close eye on any further developments.
Risk of index's breaking out
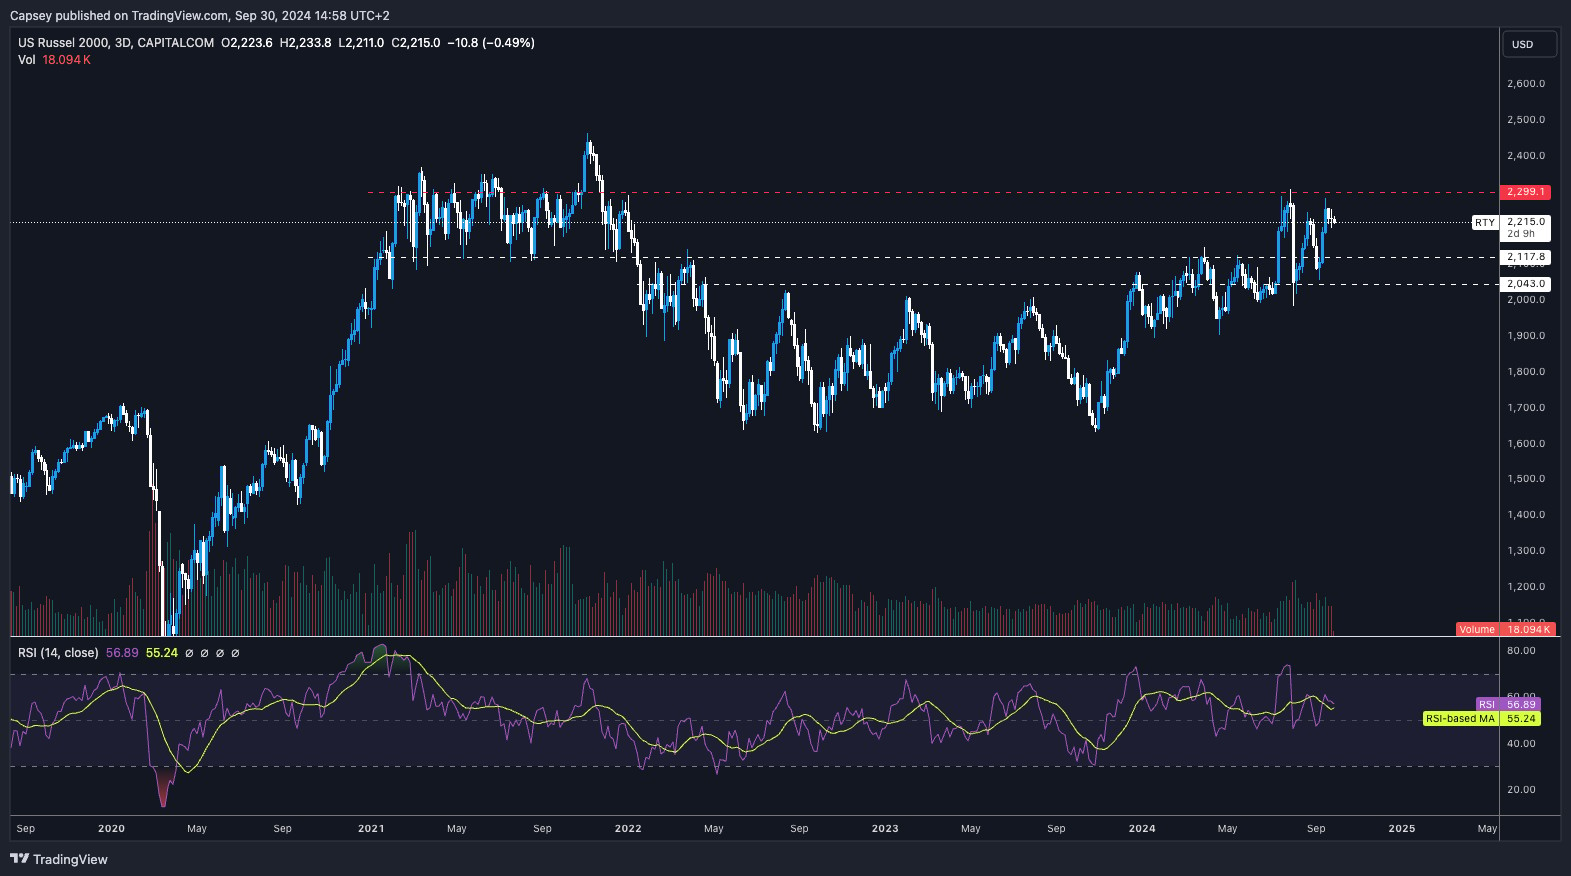
Markets are currently in a 'goldilocks' environment, and that has seen risk assets begin to break out. From a top-down macro approach, perhaps the best index for us to look at is the Russel 2000. Declining interest rates benefit these companies more than mega-cap tech. For example, as debt servicing costs decline, corporate profit margins improve. If the Russel 2000 sees a larger breakout, investors might move out along the risk curve (to Crypto), meaning a breakout in the Crypto Index might follow.
Russel 2000 3D chart:
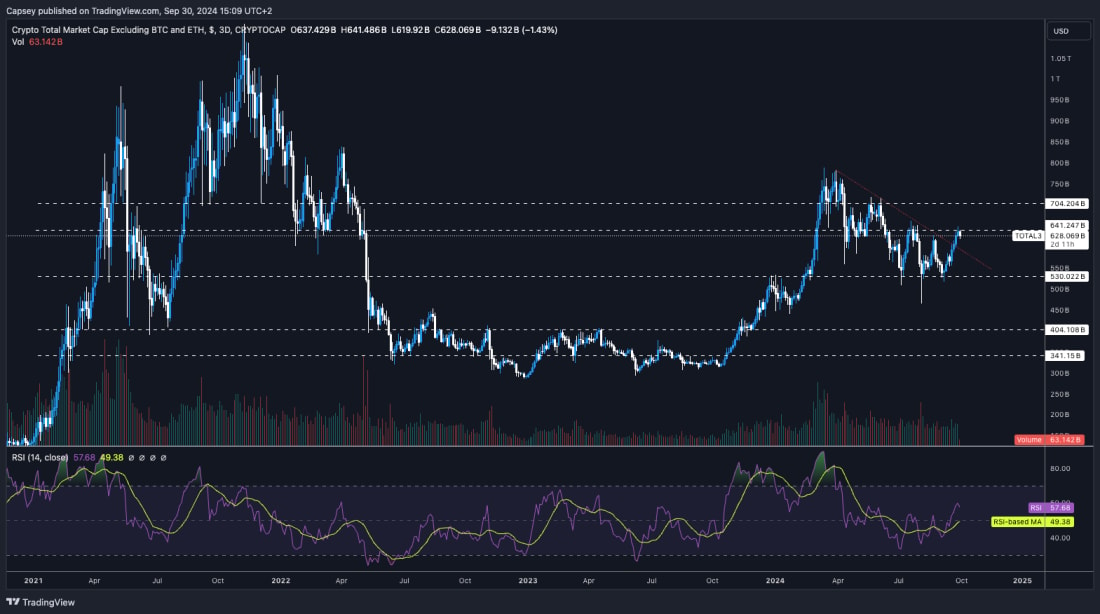
Perhaps the best Crypto Index for this is Total 3 (total Crypto Market Cap minus BTC and ETH's market caps). Looking at this chart for the 3-day timeframe, it's fantastic. We have a breakout from the downtrend line from a multi-month downtrend/consolidation, with the price now butting up into the first horizontal resistance.
We would expect the price to consolidate under or pull back very slightly from this local resistance for a short period of time before it breaks out higher and moves on to the $704b horizontal level. But, in short, we could be just a number of weeks away (on the cusp) of an Alt/Meme season. It may take up to the US Elections for this to really get going, but we believe the initial signs and moves have begun.
Crypto total 3 3-day timeframes:
Cryptonary's take
This week, price action may be slow/subdued as the markets await the labour market data on Friday. However, our macro thesis is that the US is in a 'soft landing' whilst it has also begun a new easing cycle. Therefore, our preference is to be dip buyers on the majors (BTC, ETH and SOL). So, if we see a pullback this week, we'll be looking to take advantage of it.
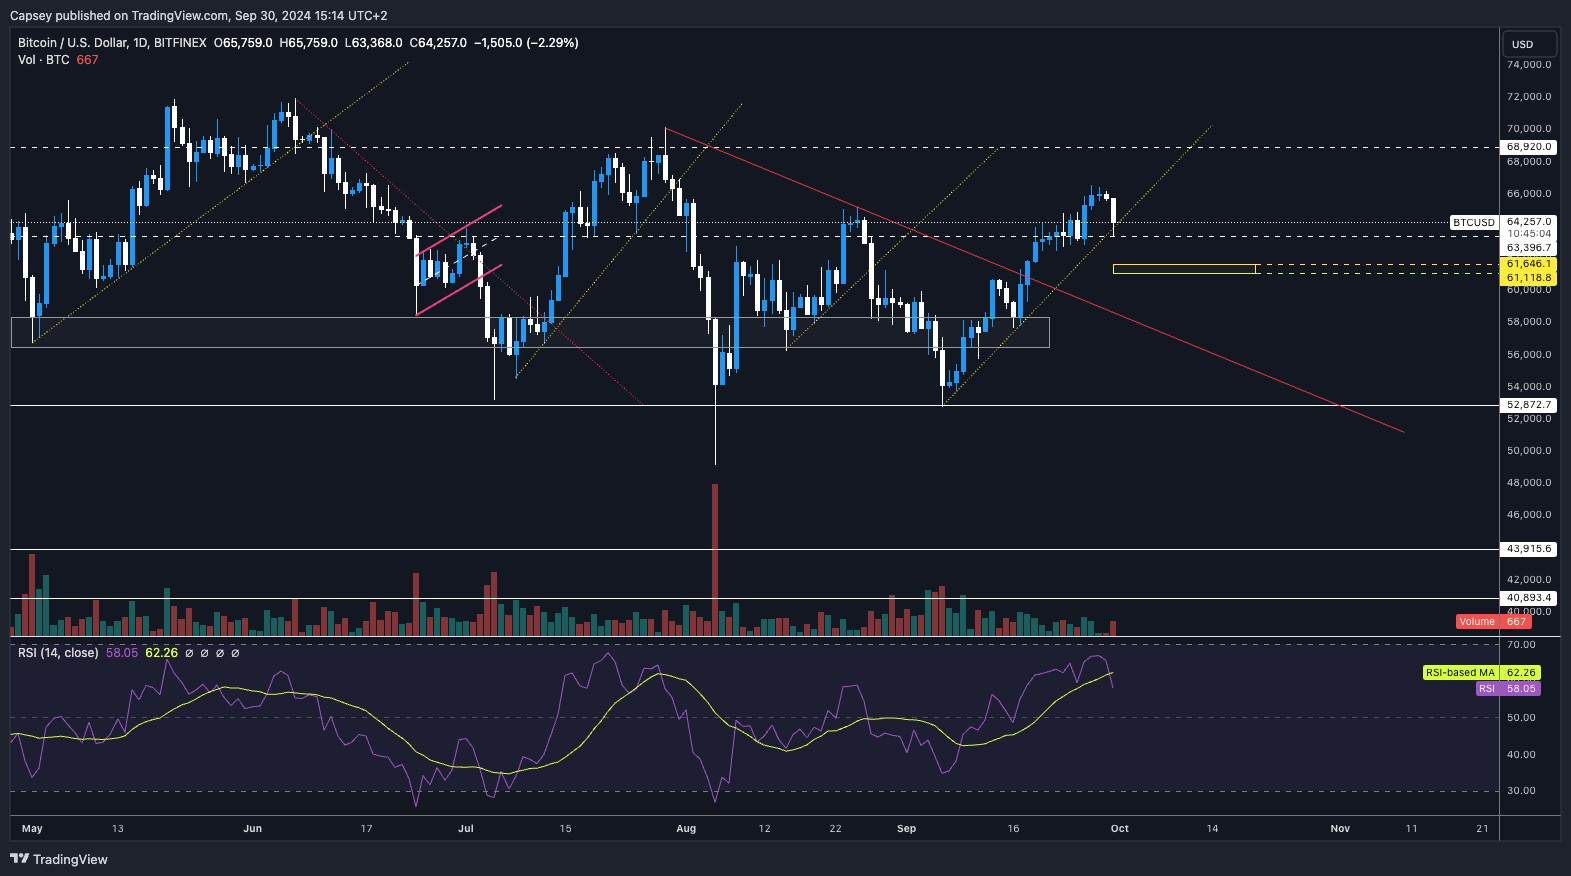
For BTC, we see the low $61k's as being that area. However, we're doubtful the price will even get as low as this as the price has held the local uptrend line and already bounced off the horizontal support we've had outlined for a long time at $63,400.
In short, this week's price action is hard to call, but if given the opportunity, we'll be dips buyers of the majors, and we expect price pullbacks to be shallow.
BTC:
Recommended from Cryptonary


