Save 23% ($351) & Get a Free 1-1 Call with our Team ⏰ : 0d 2h 59m 43s
3 undervalued DeFi trading platforms with strong earnings: Are they on your radar?
DeFi has been struggling to sustain investors' attention and enthusiasm now that the crypto market has pivoted towards high-risk, speculative assets; however, this disinterest from the rest of the market presents terrific opportunities.
The prevailing indifference toward DeFI is also why many investors are overlooking great DeFi projects with solid tokenomics and strong cash flow.
In this report, we present three DeFi underdogs that are currently undervalued and are generating significant revenue relative to their market cap.
Let's dive in.
TLDR
- DeFi remains essential, and the future interest rate cuts on the horizon could make DeFi more attractive.
- Despite the low DeFi dominance in the overall market, it is gaining traction in market mindshare and sentiment.
- We identified three undervalued DeFi assets based on their revenue-sharing tokenomics and the ratio of their market cap to revenue.
- We also included a detailed technical analysis of exactly how you should be looking to capitalise on these three opportunities.
Disclaimer: This is not financial or investment advice. You are responsible for any capital-related decisions you make, and only you are accountable for the results.
Is DeFi making a comeback?
The DeFi sector has faced significant underperformance in this cycle, partly due to the broader market's shift towards other easy-to-access high-momentum coins. Memecoins, for instance, have captured much of the speculative capital, drawing investors with promises of quick profits.This shift reflects a broader market sentiment where investors are chasing high-risk, high-reward assets. And if we are being honest, DeFi, with its more complex offerings and UX, doesn't have what it takes to match AI coins and memes in terms of immediate appeal.
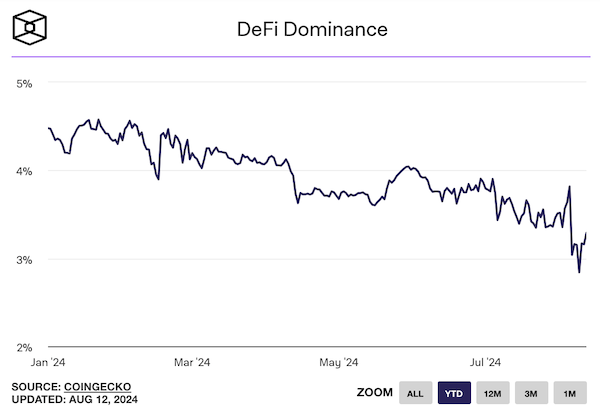
If we examine the total DeFi dominance chart, it's evident that the sector has been on a downtrend since the beginning of the year.
However, the story doesn't end there.
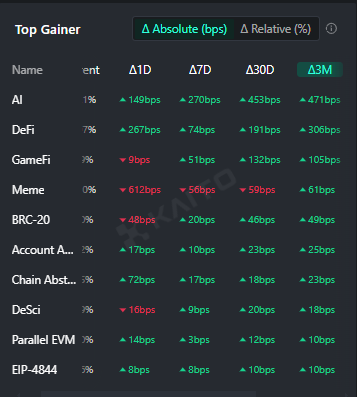
Despite its declining dominance, our social sentiment sentiment analysis suggests that interest in DeFi has improved markedly in recent weeks.
DeFi has now climbed to second place in market mindshare, capturing 13.34% of attention.

Additionally, it now ranks second in sentiment gains over the last three months, surpassing other narratives like GameFi and memecoins.
The macroeconomic situation also accounts for the slowdown in DeFi. Historically, DeFi thrives in environments where traditional yields are low, pushing investors towards DeFi for better returns.
The current macroeconomic environment of historically high interest rates and very attractive bond yields means that the risk-adjusted returns from DeFi are not as compelling, especially compared to safer, traditional financial instruments.
However, as we have indicated numerous times in our market update reports (here and here), the rate cut season will start in September, making DeFi yields and revenue-sharing tokens more attractive and bringing back attention to them.
So, which DeFi coins should you check out before the rest of the market catches on?
3 undervalued DeFi gems to watch
Given these signs of recovery and potential breakout, we found a few undervalued DeFi gems that should be on your radar.Due to the widespread presence of low-float VC coins in the market with weak value accrual, we focused on robust DeFi coins with most of their supply already in circulation. Additionally, we narrowed our list to DeFi coins that offer revenue-sharing tokenomics. We evaluated these assets based on the ratio of their market cap to the revenue shared with token holders.
As a result, we found three attractive DeFi coins that are currently undervalued and present attractive investment opportunities.
Gains Network
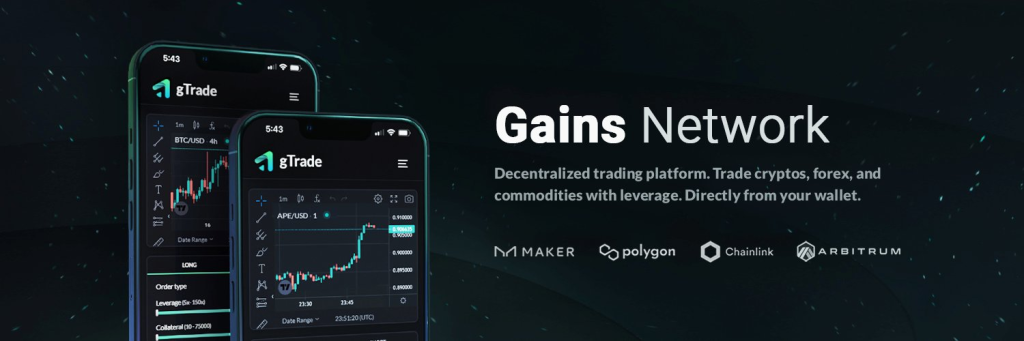
Gains Network is a DeFi ecosystem that has carved out a niche in the leveraged trading space, particularly with its flagship product, gTrade.
Gains Network operates on both the Polygon and Arbitrum networks, focusing on providing a liquidity-efficient, user-friendly, and powerful decentralised leveraged trading platform.
It is designed to offer users up to 150x leverage on cryptocurrencies, 1000x on forex, and significant leverage on stocks and commodities, making it one of the most aggressive leverage options in the DeFi space.
The Gains Network token (GNS) serves as both a governance and revenue-sharing token. Recently, the DAO implemented Buyback & Distribute tokenomics, where 90% of fees are distributed to stakers.
With a fully circulating supply and no insider unlocks pending, the investment case for Gains Network is strong.
Now, let's examine why we think it is undervalued based on the revenue the platform is generating.
Investment thesis
- Fully diluted mcap: $87m
- Revenue generated in the last 12 months: $30m
- Price-to-Earnings (P/E) ratio: ~3
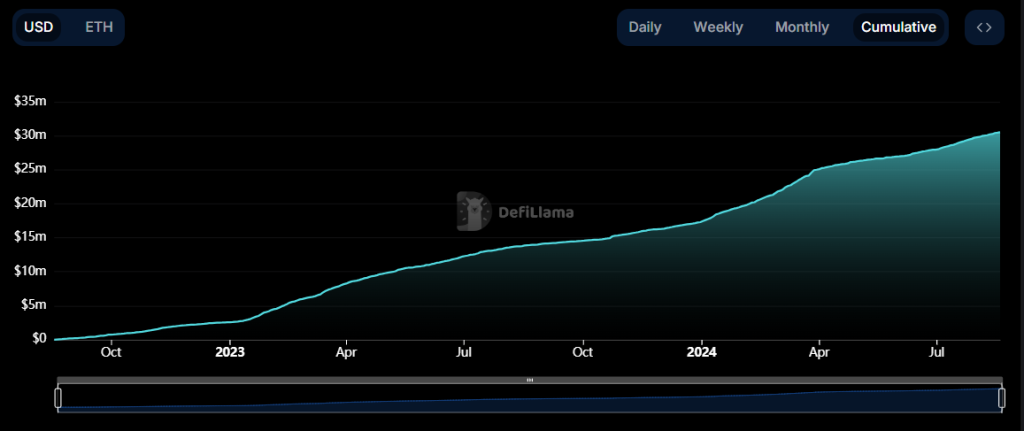
That gives a price-to-earnings (P/E) ratio of roughly 3. For assets in the application layer (apps) in crypto, we usually consider a P/E ratio below 10 to be undervalued.
For comparison, the P/E ratio of the S&P 500 (an index generally considered a benchmark for capital markets) is 27.45 as of the time of writing. Historically, the S&P 500's P/E ratio has never been below 5, even in times of economic crises, recessions, depressions and global uncertainty.
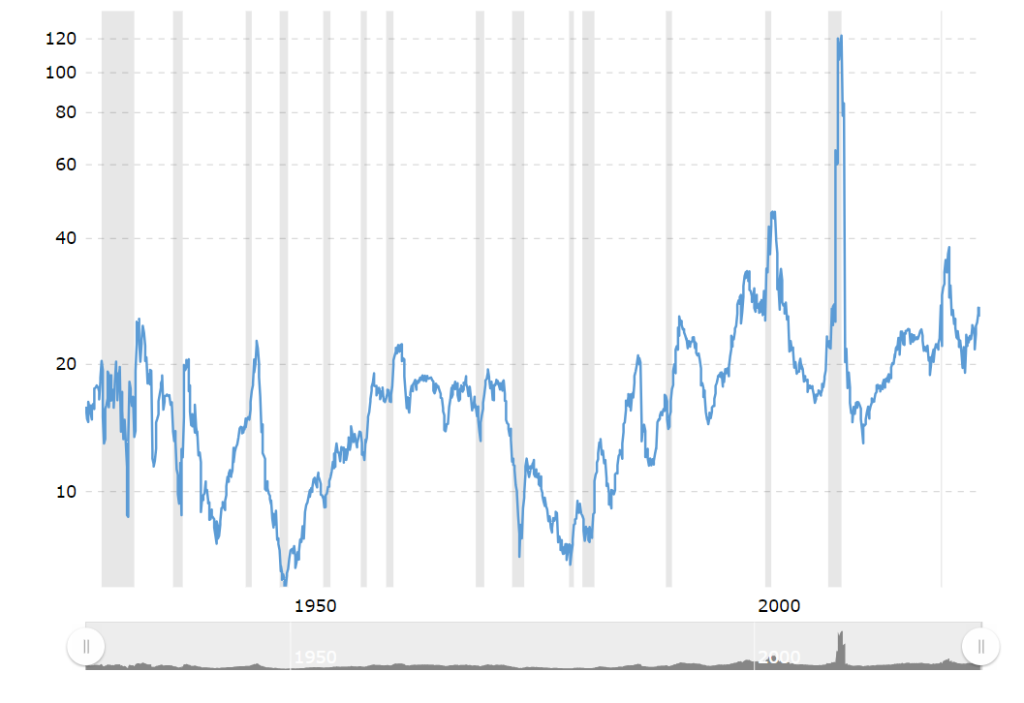
Thus, using this benchmark, there is a strong case for the asset with a P/E ratio that is below 10 to be undervalued in bull markets.
With a P/E ratio of 3, the current market price suggests that the asset is generating earnings at an exceptionally high rate relative to its valuation. This means that for every dollar invested, you're effectively capturing a significant portion of the network's revenue stream.
Since 90% of these earnings are distributed to stakers, the dividend yield alone is substantial, offering investors a steady income far exceeding traditional returns. This high yield indicates that the market has likely undervalued GNS, possibly due to underappreciation of its earnings stability or growth potential.
Even if the market price remains unchanged, the ongoing revenue distribution positions you to earn a significant return on your investment. And if the market eventually recognises the true value of GNS, there's considerable upside potential as the price adjusts to reflect its strong fundamentals and earnings power. This isn't just about potential price appreciation—it's about capturing a high, consistent return from an asset that the market has yet to fully value
Of course, this has several assumptions, such as volume and price not dropping as we go. However, even if we include some margin of safety and double the ratio to 6 or even triple it, it is still lower than 10 and significantly lower than S&P's multiples.
Thus, GNS remains undervalued, and when the macro environment improves, and investors switch to higher-risk opportunities, the market is likely to reprice the asset.
In the meantime, let's turn to technical analysis to determine the short-term odds.
$GNS technical analysis
In the context of the broader altcoin market, which has been underperforming for some time, analysing Gains Network ($GNS) on the weekly time frame provides a more comprehensive outlook. The weekly chart offers a clearer long-term perspective, reducing the noise and bearish bias that might dominate shorter timeframes.Higher-highs and higher-lows
GNS has maintained a bullish structure on the weekly chart, characterised by a series of higher highs and higher lows. This structure is clearly denoted by the red dots on the chart, which highlight significant swing points in the trend. The most recent red dot around the $2.11 level indicates a critical area of interest as it aligns with a key demand zone.
Demand zone analysis
The demand zone currently being mitigated is significant, formed in September 2022. This zone is represented by the grey box on the chart, stretching from approximately $1.28 to $3.00. This zone is significant because it was the area from which GNS launched an impressive 800% rally, reaching a high of $11.8 in February 2023.The latest price action has seen GNS revisit this demand zone after a bearish phase in August 2023, when it moved within a bearish channel and eventually broke lower. The fact that GNS is testing this zone again, with the broader market potentially setting up for a bullish move, suggests that GNS is poised for a potential reversal and upward movement from this area.
Key levels to watch
- Demand zone: $1.28 - $3.00 is the key accumulation zone. This is where bids should be layered for potential long positions, as this zone has historically acted as a launchpad for significant price rallies.
- Critical resistance: A break above $4.60 is crucial for flipping the lower timeframe structure bullish. Clearing this level would signal a stronger reversal and continuation of the bullish trend on higher time frames.
Conclusion
GNS, on the weekly timeframe, is testing a crucial demand zone that has historically led to significant bullish moves. With the broader market conditions potentially aligning for a bullish reversal, GNS is positioned for a possible upward movement.Investors should watch the $1.28 - $3.00 zone closely for entry opportunities and monitor the $4.60 level for a confirmed bullish flip on lower time frames.
Gains Network has great tokenomics with clear value accrual. A P/E ratio of 3 is extremely attractive as a cash flow play. Young Warren Buffet and Shark Tank investors would hunt for this kind of investment.
Even though we understand the nuance of crypto markets where attention decides an asset's performance, this is too good of an opportunity to ignore.
GMX
The next DeFi asset that we currently find attractive is GMX. GMX is a decentralised perpetual futures exchange and money market that operates on Arbitrum and Avalanche blockchains
Similar to Gains Network, it offers leverage trading on various assets, except it operates on Arbitrum and Avalanche. Traders can use up to 50x leverage, which can amplify both gains and losses; it is suitable for experienced traders looking for high-risk, high-reward opportunities.
The generated fees are distributed as ETH and AVAX on Arbitrum and Avalanche, respectively. This is in stark contrast with Gains, where fees are used to buy back the GNS tokens.
This approach allows investors to earn blue-chip assets that are less likely to be subject to market volatility.
However, similar to GNS, the supply of GMX is fully unlocked, making this asset quite appealing from an investing perspective.
Let's look at numbers and explain why we think it is undervalued.
Investment thesis
- Fully diluted mcap: $237m
- Revenue generated in the last 12 months: $7.6m
- P/E ratio: ~30 (~10 based on recent earnings data)
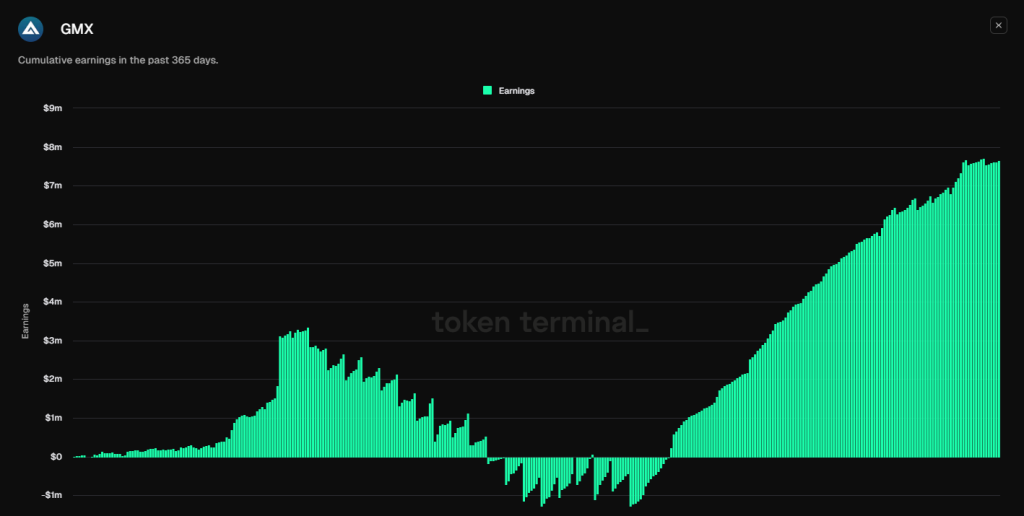
Up until April, GMX was barely profitable as a platform. However, from April, it started making money and generated a solid $9m in earnings, which is $21.6m annualised.
Comparing market cap and annual earnings gives an approximate P/E ratio of 10, which is quite solid from a value investing approach.
Moreover, since March/April (when GMX finally started being profitable), the market has cooled down and been range-bound. We are yet to see how much money GMX can make for its stakers in better market conditions when things are overheated.
Therefore, we remain optimistic that when attention switches back to DeFi, and BTC breaks its range, we can expect increased volume and earnings.
$GMX technical analysis
When analysing GMX on the weekly timeframe, we can see a consistent bullish structure characterised by higher highs and higher lows, as denoted by the red dots on the chart. This pattern has been established over a significant period, demonstrating GMX's strength and resilience in the market.Higher-highs and higher-lows
From June 2022 to April 2023, GMX experienced an impressive 680% rally, propelling the coin to a higher high of $90. This significant move highlighted GMX's potential and placed it firmly on the radar of long-term investors. However, after reaching the $90 mark, GMX has been consolidating within a large wedge pattern on the weekly timeframe.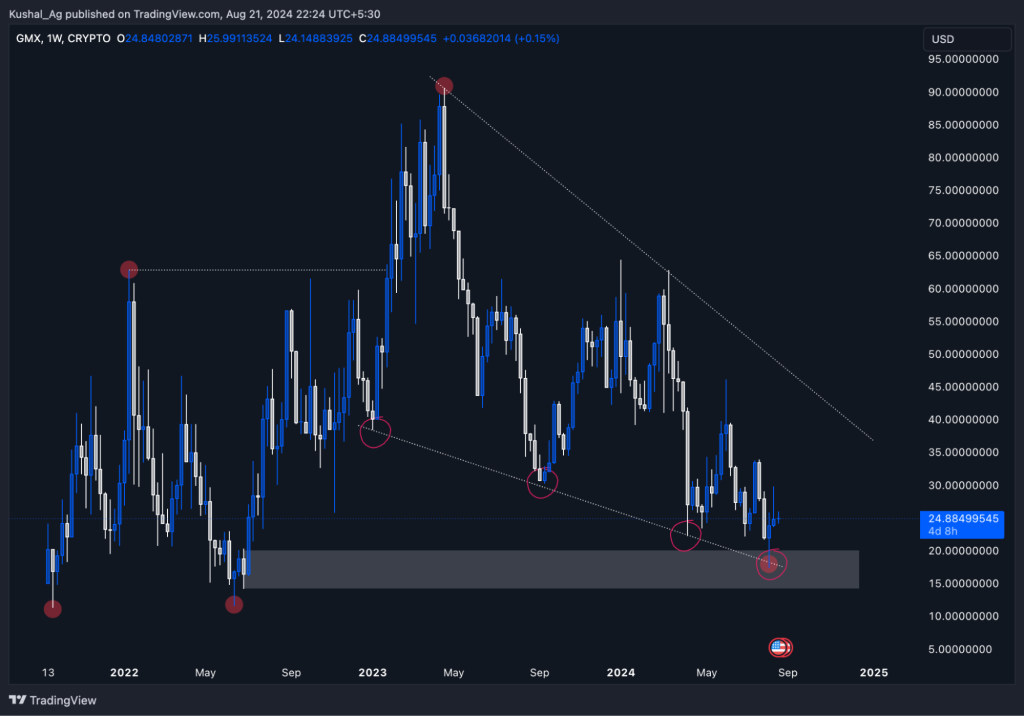
Wedge formation
The wedge pattern that GMX is currently trading within is critical for its long-term outlook. A breakout from this wedge, particularly on the upside, could trigger a substantial rally, aligning with the previous bullish trends observed in GMX. This pattern is essential for traders and investors as it could signal the next major move for GMX.Demand zone and support levels
Currently, GMX has mitigated its weekly demand zone, which is marked by a grey box on the chart, ranging from $14 to $20. This zone coincides with GMX taking support at the lower end of the wedge pattern.Historically, the price has bounced strongly and quickly whenever it has touched the lower boundary of the wedge, as marked by the red circles on the chart. This marks the fourth time GMX has touched this critical support level, making it a significant area of interest for potential bullish reversals.
Key levels to watch
- Demand zone: $14 - $20 is a critical support area. Given the historical bounces from this level, it is a strong area for potential accumulation.
- Upside potential: If GMX continues to hold this support level and the wedge breaks on the upside, a push towards $40 is anticipated. This target aligns with the previous price actions and could be a key resistance area in the near term.
Conclusion
GMX is at a pivotal point on the weekly timeframe. The ongoing wedge formation and the significant demand zone between $14 and $20 presents a strong case for a potential bullish reversal.If the price manages to break out of the wedge on the upside, GMX could see a substantial move, possibly targeting the $40 level in the near term.
Investors and traders should monitor these key levels closely as they could dictate the next major trend for GMX.
GMX is a solid perps platform that recently became profitable. However, many people are overlooking its cash flow potential. The yield is paid out in ETH and AVAX, which makes it very attractive if you intend to earn a passive income.
Hegic
Hegic is a DeFi protocol built on the Ethereum blockchain. It is designed to facilitate on-chain options trading. It was founded in January 2020 by a developer named Molly Winterminute.
The protocol aims to simplify complex financial instruments like options, making them accessible to ordinary users for potentially high returns with lower costs. It operates on the principle of peer-to-pool trading, where users can buy and sell options directly through smart contracts without traditional intermediaries.
Its token, HEGIC, is the platform's core, which underwrites options and collects premiums, fully participating in the protocol's net P&L distribution.
Even though we are confident that Lyra will be a winner in the options sector, it currently doesn't have a token or revenue share. Hegic can be an undervalued alternative to Lyra to capitalise on in the meantime.
Now, let's talk numbers.
Investment thesis
- Fully-diluted mcap: $19m
- Revenue generated in the last 12 months: $4m
- P/E ratio: ~5
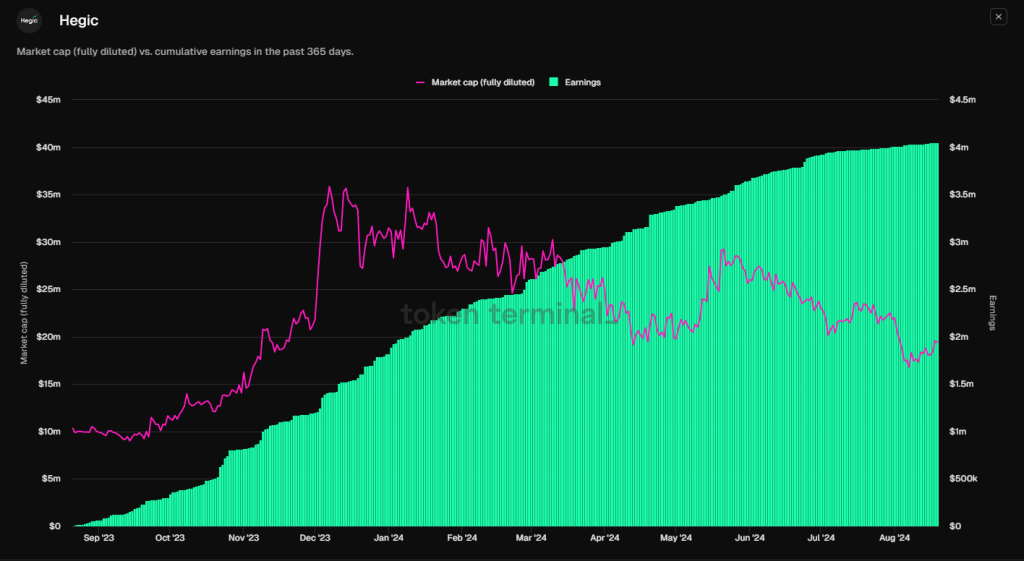
In traditional markets, such low P/E ratios, especially for tech-related companies, are rare and often signal undervaluation. The current pricing suggests that the market hasn't fully recognised Hegic's potential or its consistent track record of profitability.
By investing in Hegic now, you're not just betting on potential price appreciation; you're aligning yourself with an asset that delivers solid earnings relative to its valuation. As the market catches up to Hegic's real value, there is significant upside potential, making this an opportunity to capitalise on a mispriced asset with solid fundamentals.
Further, the options sector in crypto is a relatively new primitive that hasn't yet had its time to shine. We believe the whole sector is overlooked and has yet to take off. In traditional capital markets, the volume of options traded is in the hundreds of billions. Crypto platforms have a clear market potential to eat up the market share of their centralised counterparts.
HEGIC is a revenue-generating asset that can also be used as a proxy for the whole sector. If options take off as a narrative, the market will seek ways to get exposure; since Lyra's token isn't live yet, the second obvious choice is HEGIC.
$HEGIC technical analysis
When analysing Hegic on the weekly timeframe, we can see an interesting trend. Historically, we've seen much higher prices, with the asset reaching up to around $0.5 and even as high as $0.637 at one point. This highlights Hegic's potential in the market.However, since then, we've experienced a significant downtrend.
Price history and structure
Hegic has been around since 2021. During this cycle alone, we've had a few significant upward movements. Notably, on October 17th, we saw a 500% rally, followed by a sharp 600% wick on October 16th. These moves show the asset's capability for strong surges, but since then, the price has been settling, finding final support around the $0.01590 price point.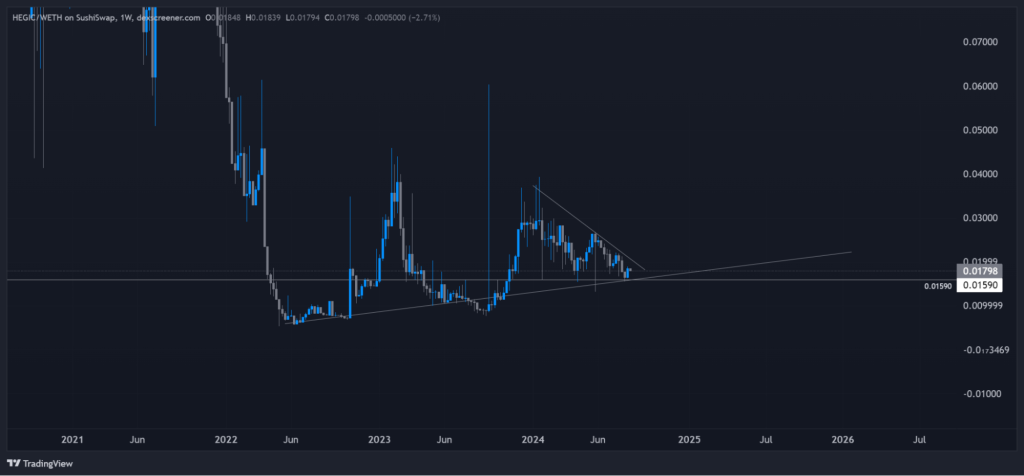
Wedge formation
Hegic appears to be forming a wedge pattern, which might indicate that the downside momentum is running out, especially as demand around $0.01590 is holding up. This price zone is where we'd look to accumulate and build any sort of position.Key support and uptrend
We've also observed a swing low around January 22nd, which captured a nice upward trend, forming higher lows. This has created a diagonal support line, clearly illustrated on the chart. As long as this support holds, it provides a solid reference point and accuracy for getting involved in the asset.Conclusion
Hegic is at an intriguing point on the weekly chart. This is a critical area to watch, with historical highs showing its potential and current formations suggesting a possible bottoming out. Support around $0.01590 could be key for accumulation, and if this diagonal support holds, it could signal a good opportunity to enter the market.In a cycle where the market is full of VC-backed alts, Hegic has attractive tokenomics, a fully unlocked supply, and a robust revenue share model. It is undervalued with a P/E ratio of 5 and presents a compelling investment opportunity for those looking to have revenue-generating assets in a portfolio.
Cryptonary's take
Despite being one of the coolest use cases in the blockchain industry, DeFi has lagged both in terms of attention and performance during this cycle.However, sentiment is showing signs of shift, and many undervalued cash-flowing assets are currently overlooked.
There are many ways to build a balanced portfolio, and there is nothing wrong with allocating some portion to undervalued assets that generate passive income.
These assets can bring steady income to your portfolio and help free up some capital to capitalise on larger corrections.
Cryptonary, OUT!
Recommended from Cryptonary


