Save 23% ($351) & Get a Free 1-1 Call with our Team ⏰ : 0d 2h 59m 43s
On-chain truths: What charts tell us about crypto’s next move
The crypto market is alive with whispers of what’s to come, and the charts hold the key to unlocking its secrets. We’ve crunched the numbers, and the picture they paint is nothing short of intriguing. Let’s dive in!
This cycle looks nothing like the last. There's no retail mania, yet. No easy liquidity. And no wild DeFi coins tearing through Twitter. Instead, what we have is strategic, silent, institutional accumulation
Bitcoin is being held tighter than ever, off exchanges, in cold wallets, or parked with ETFs. Stablecoins are piling up in wallets, waiting. But neither is moving fast. Why? Because the macro backdrop remains hostile: interest rates are high, liquidity is scarce, and everyone's waiting for someone else to blink first.
But under the surface, the structure is tightening. Supply is drying up. Liquidity is pooling. And sentiment is beginning to shift from hesitation to curiosity. It's not just Bitcoin anymore. Capital is eyeing Ethereum, real-world assets, and even memecoins, but it's doing so selectively.
This report is an audit of the current crypto market structure and an outlook for where it might go next. We break down on-chain supply trends, institutional accumulation through ETFs and off-chain flows.
Let's begin.
Disclaimer: This is not financial or investment advice. You are responsible for any capital-related decisions you make, and only you are accountable for the results.
On-chain market structure
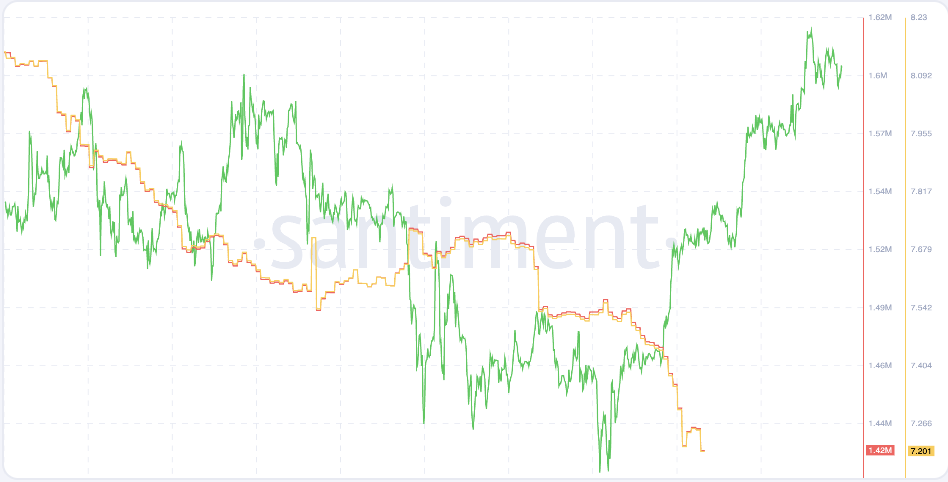
This cycle isn't built on hype, it's built on scarcity. The blockchain tells a story that's easy to miss on the surface. Here's what the data reveals:1. Bitcoin: Vanishing supply
- Exchange reserves are at historic lows: Only ~1.42M BTC remain on centralised exchanges, just 7.2% of the circulating supply. (as of April 2025). That's the lowest percentage since 2018. Investors, especially long-term holders, are moving their coins into cold wallets and locking them away. The supply is on a consistent downtrend, signalling a supply squeeze.
- Dormancy at record highs: Over 68% of BTC supply hasn't moved in over a year, and 42% hasn't moved in more than 3 years. This is structural conviction and a potential powder keg if demand spikes.

- Whale activity confirms strength: Mid-tier whales (100-1,000 BTC) are still accumulating even after the $100K peak, increasing their share from 20.8% to 23.07%. Larger whales (>10,000 BTC) have only slightly trimmed, likely for rebalancing, not exiting.

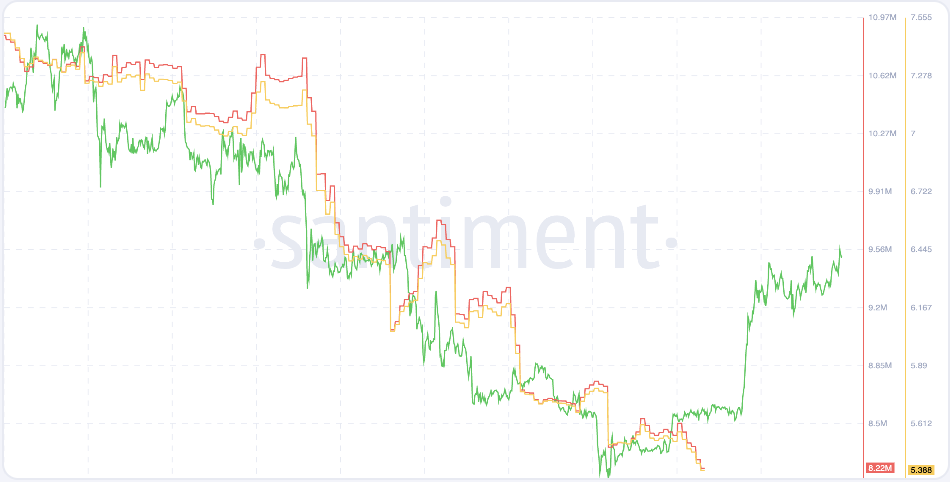
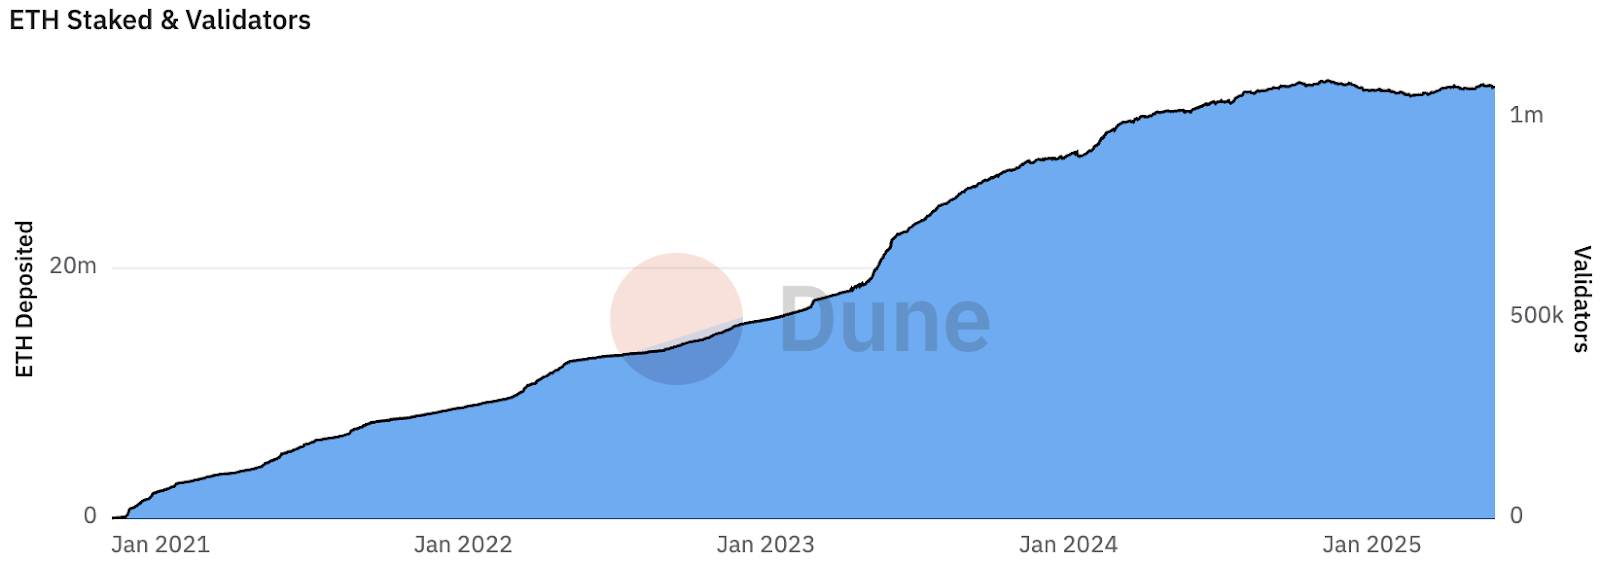
2. Ethereum: The staking squeeze
- Exchange reserves just north of 5% of supply: Similarly, ETH on centralised exchanges has hit an all-time low ~5.3%. The trend is clearly down.
- More than 28% of ETH is staked: With over 34M ETH staked, protocol incentives have engineered a supply squeeze. Add in DeFi and self-custody, and today, the sell-side liquidity is thinner than ever.
- ETH is following, not leading - yet: ETH/BTC has lagged for months (until recently, we have analysed this below), but structural conditions suggest that when ETH demand returns, the rally could be explosive due to limited supply.
3. Stablecoins: Sidelined capital waiting
- Record supply, record patienceStablecoin market cap hit a new high of $247B, with Tether ($153.6B) and USDC ($60.8B) dominating. Yet most of this capital remains inactive.

- Deployment has slowed dramaticallyInflows/outflows dropped over 80% between March and April. Stablecoins are sitting in DeFi or wallets, earning yield, but not chasing risk.
- Stablecoins now drive alt rotationsForget BTC rotations, today, stablecoins are the real engine of alt rallies. When they move, the market moves. But so far? Still parked.
Off-Chain forces: Institutions and ETF flows
This cycle, institutions are steering the ship. Bitcoin is now a treasury asset, not a trade. Just look at the numbers:- MicroStrategy now holds 580,250 BTC (~$61b), including 7,390 BTC acquired in May 2025 alone.
- Metaplanet, dubbed "Asia's MicroStrategy," holds 7,800 BTC valued at ~$800M.
- Even GameStop raised $1.5B via convertible bonds to buy Bitcoin, signalling that treasury-driven BTC buys are not a one-off trend.
But the trend is evolving. Ethereum is now entering the institutional treasury conversation as well. In May 2025, SharpLink Gaming (SBET) raised $425M in a private equity round, led by Consensys, ParaFi, and others, explicitly to buy ETH as a treasury reserve asset. Institutions are beginning to see Ethereum as programmable money, with cash flow, staking yield, and real use cases.
Bitcoin's identity has matured: ETFs, pensions, and governments are racing to accumulate digital gold. However, this structural demand removes liquidity from the market and delays any meaningful rotation into riskier assets. Meanwhile, Ethereum ETFs are also gaining momentum, with inflows like BlackRock's $24.9M ETH purchase on May 22 sparking a 2.3% price jump and 18% spike in volume. ETH ETF AUM reached $2.49B by mid-May, despite outflows from Grayscale.
ETFs are driving up prices by removing assets from circulation. That's bullish long-term, but slower and more orderly than retail-led runs.
That's the new market rhythm: slower, steadier, institution-led. But altseason/expansion doesn't wait on fundamentals, it rides momentum. To catch it early, we need to watch the signals that precede the narrative. So let's break down the charts that matter and see what they're telling us.
Quantitative look at the charts
Everyone's waiting for altseason (or some version of it), but few are watching what truly unlocks it. To know when the rotation begins, we need to track the signals that have historically preceded it: breakdowns in Bitcoin dominance, strength in ETH/BTC, and confluence across macro-crypto correlations. But this time, we need a sharper lens.BTC + stablecoin dominance index
Instead of looking at BTC.D alone, we will look at BTC.D plus the stablecoin dominance to get a clearer picture. On the weekly timeframe, the combined Stablecoin and Bitcoin Dominance Index has remained in a strong uptrend for nearly four years, reflecting the market's long-standing preference for safety and liquidity. But that trend may be losing steam.Over the past few months, the index has formed a rising wedge, a classic pattern that often precedes a reversal. The structure is now attempting to break down, hovering around 70.16% after topping locally at 72.83%.
The key inflection zone lies around 68.2%. A clean breakdown below this level would confirm the wedge breakdown on the higher timeframe, signalling the start of a rotation away from BTC and stables, likely toward altcoins. On the flip side, if dominance climbs back above 71%, we could see another leg higher toward 73-74%, delaying any broad risk-on environment.
If the wedge plays out to the downside, the measured move could take the index back toward the 61.14% region, a key support zone and the likely target of this breakdown.
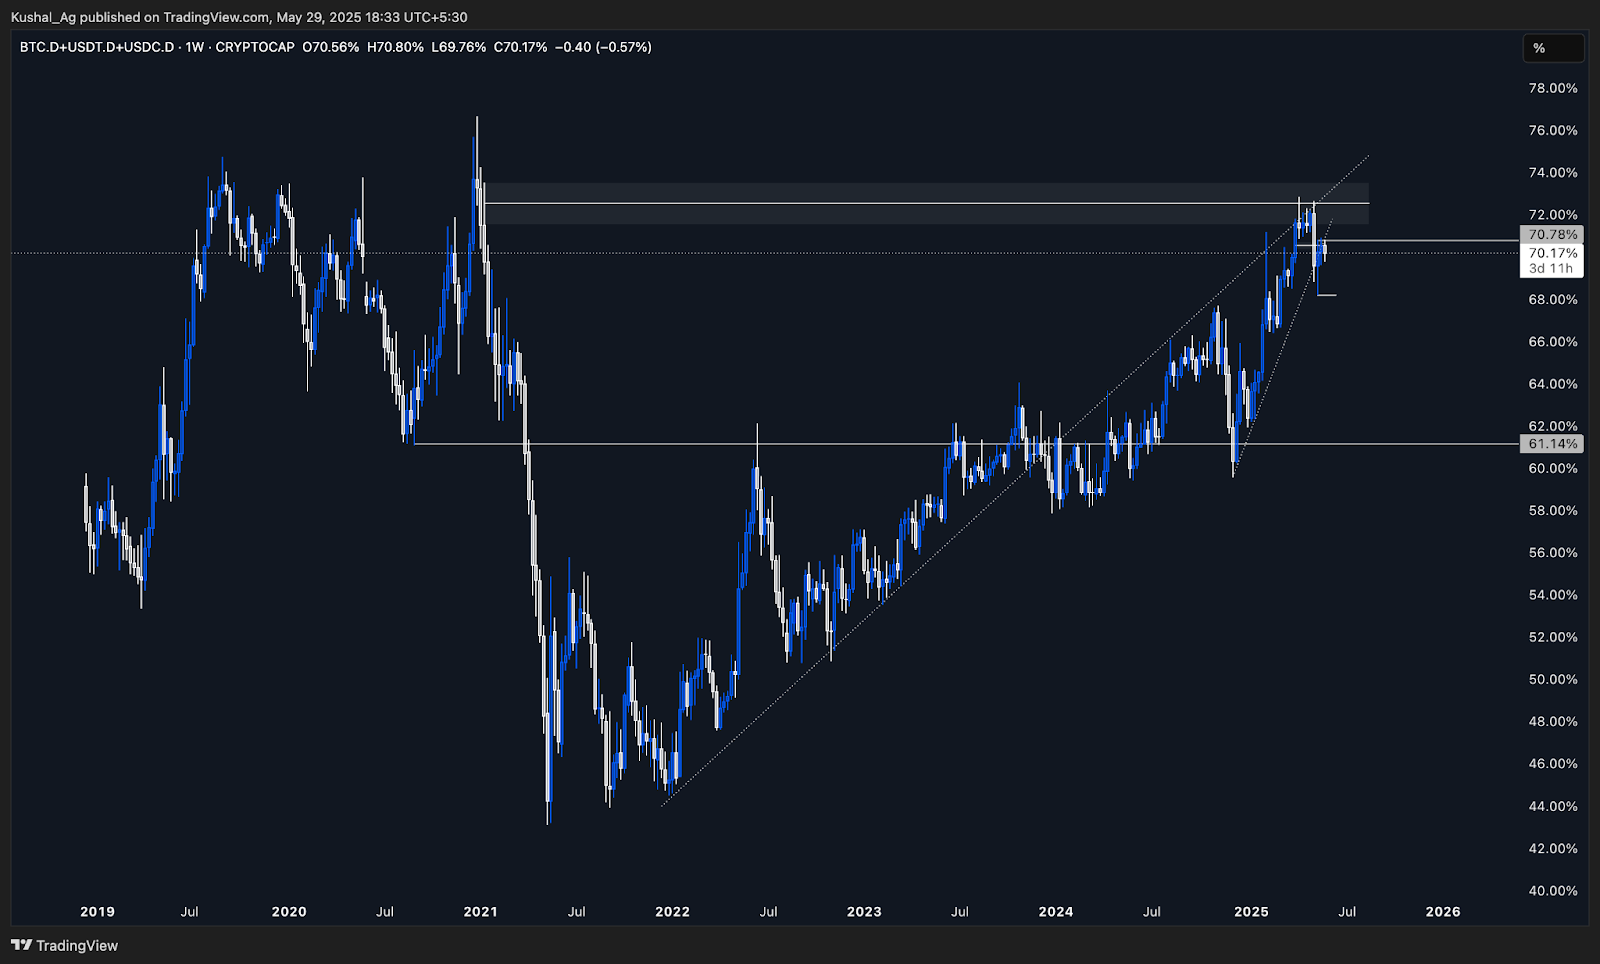
This chart sits at a critical pivot. A breakdown would mark the official start of capital rotation. A bounce would mean altseason remains on hold. This is one of the most important charts in the market right now.
ETH/BTC: First mover of rotation
After a prolonged downtrend, ETH/BTC is showing early signs of a reversal. For nearly three years, Ethereum consistently underperformed Bitcoin, but that tide may be turning.The pair recently reacted from a monthly demand zone (from January 2020), forming a base from April to early May. From the 0.018 level, ETH/BTC rallied sharply, climbing nearly 40% to 0.026. The local bottom was set at 0.017, marking the lowest point in the current cycle.
This bounce also coincided with a long-standing diagonal trendline, which acted as a resistance ever since 2025 started. Currently, ETH/BTC is attempting to hold above the 0.023 level, a critical zone that could validate the shift in structure if maintained.
If this level holds, 0.029 is the next target to watch over the coming weeks. A sustained rally here would be a strong signal for broader altcoin strength, as ETH/BTC often leads the rotation from majors to alts.
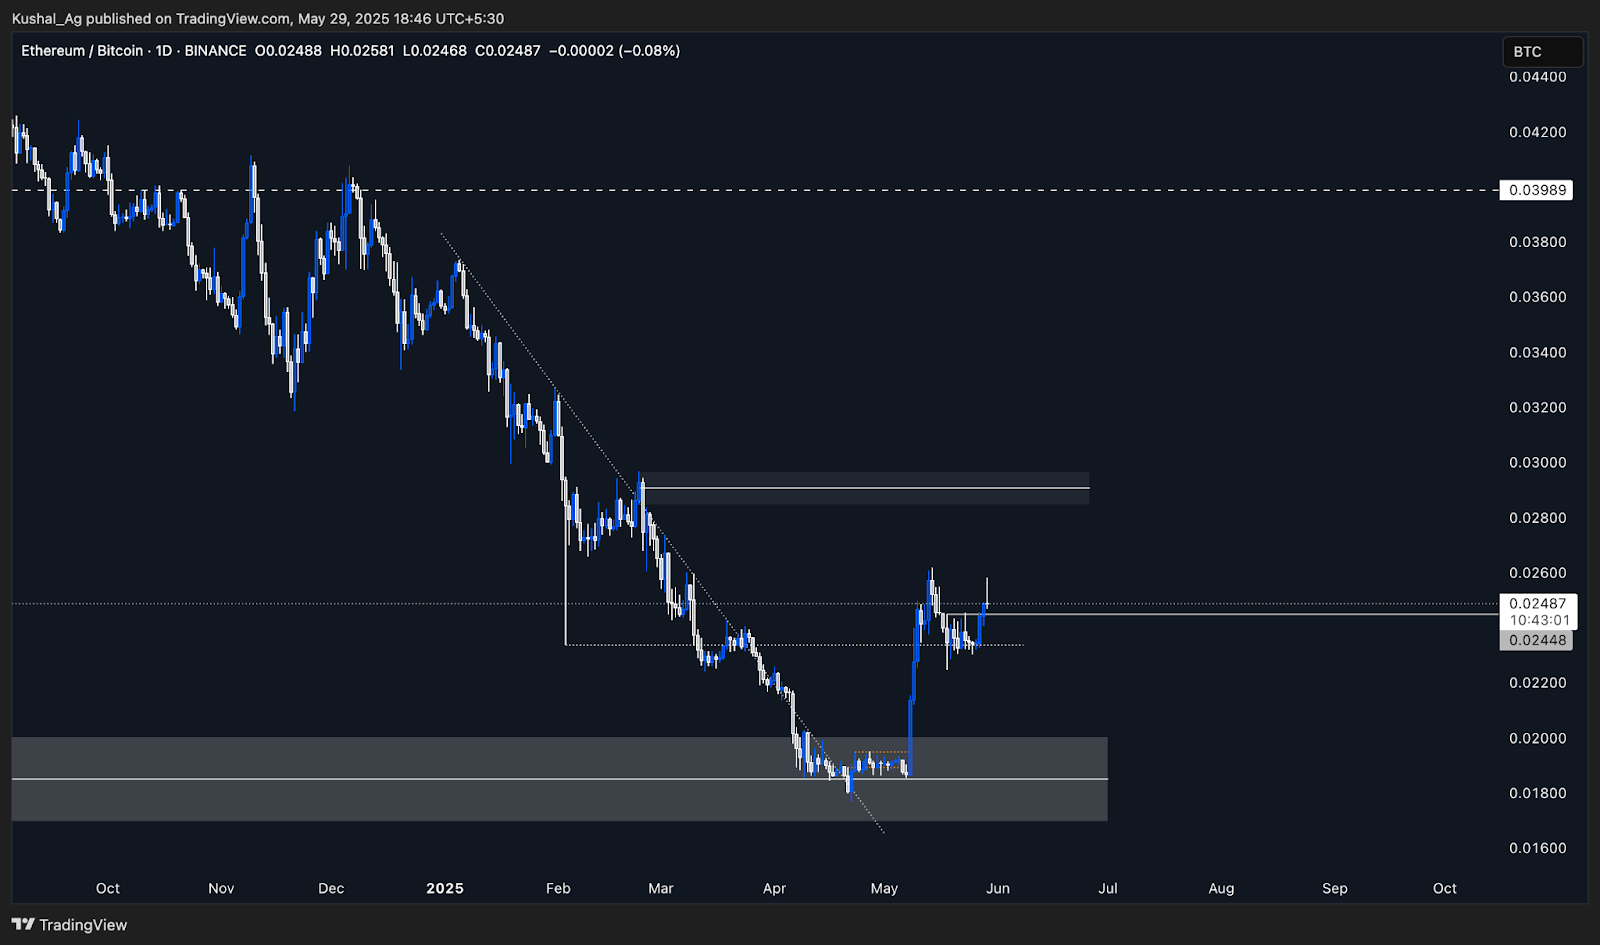
Rotation often starts with ETH. This shift is the first breadcrumb.
HYPE / BTC: Relative strength
HYPE/BTC paints a similar story. After retesting its all-time high of December 2024, the pair faced resistance and has since pulled back. It's now approaching a key support area, marked by line number 5 on the chart.
This pullback, if held, could set the stage for the next leg higher. HYPE outperforming Bitcoin is an important signal. In previous cycles, altcoins that show strength vs BTC ahead of broader rotation tend to lead once the real momentum kicks in.
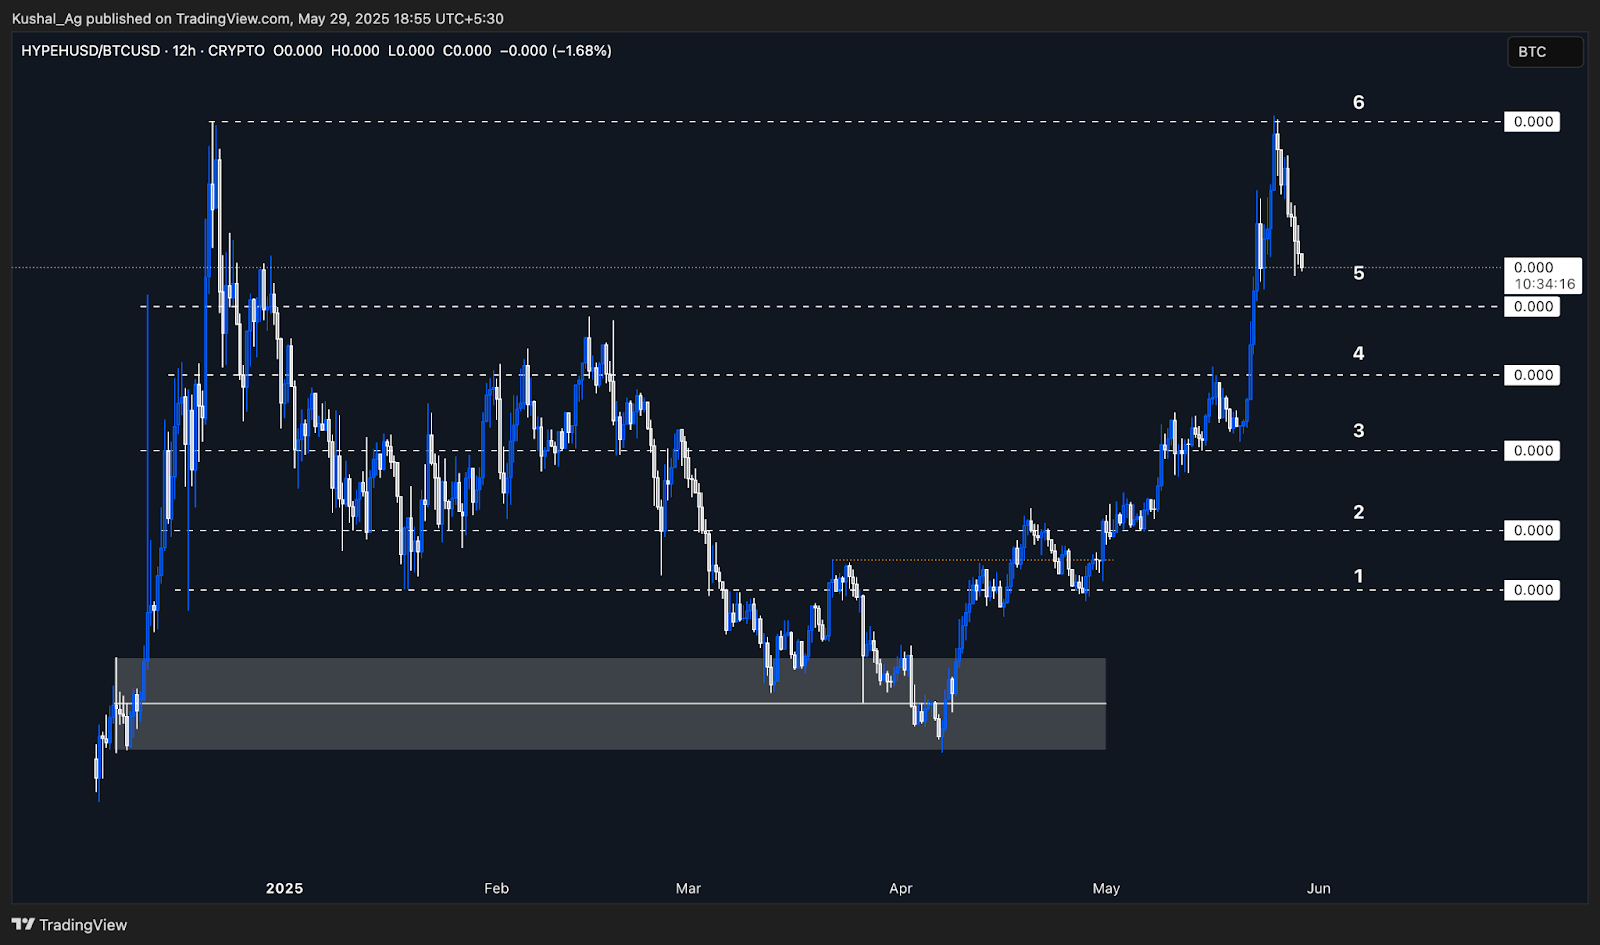
What does it all tell us? Altcoin rotations are happening, but they're selective. Only a few names are absorbing real liquidity.
OTHERS chart (Excluding Top 10)
The OTHERS chart offers a direct lens into the broader altcoin landscape, excluding the top 10 coins by market cap, and right now, it's showing early signs of strength.Weekly Timeframe Setup
On a weekly basis, price bounced strongly from a longstanding demand zone established in October 2024. This zone ranges from $226B to $190B, and it was retested multiple times between February and May 2025.
Although price briefly capitulated below the zone to $175B, it quickly reclaimed the range, forming what now appears to be a higher low. This reclaim aligns with the 200-week EMA, which currently sits around $196B, adding solid confluence to the bounce.

If this structure holds, it sets the stage for a potential new higher high on the weekly, indicating a possible trend reversal for the broader alt market.
Daily Timeframe Coil
Zooming into the daily timeframe, price is coiling between two major levels:
- Resistance: $288B
- Support: $247B
A clean breakout above $288B could serve as a trigger for the next leg higher in altcoins, potentially opening up a 25-30% move into the $360B-$370B zone, which is the next clear resistance.
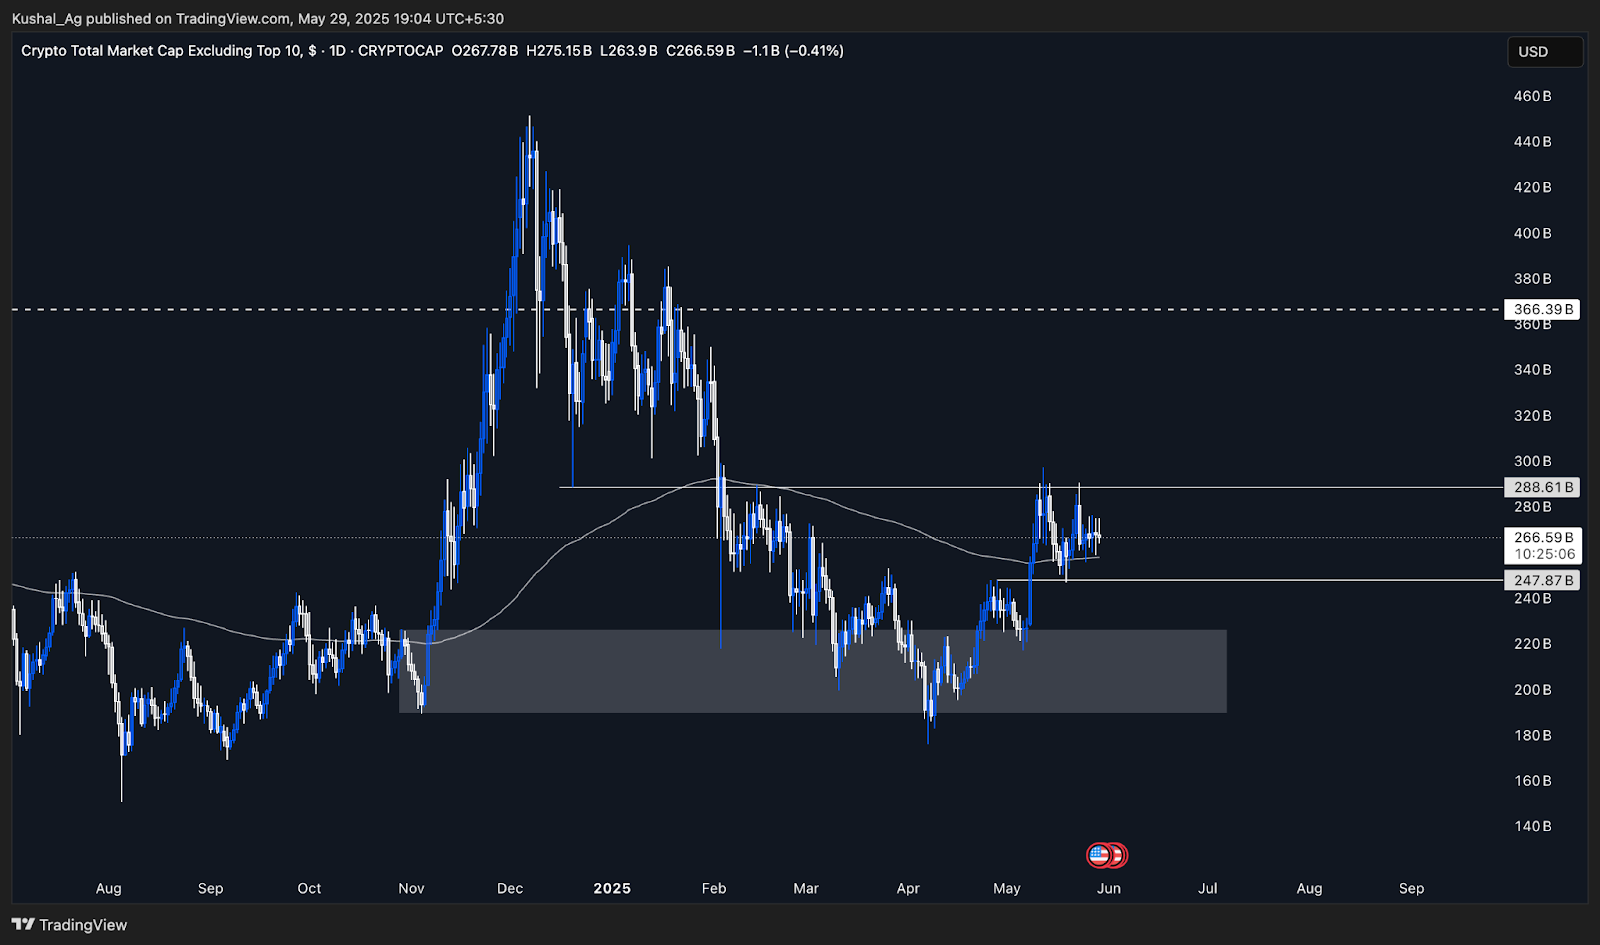
This setup whispers smart accumulation rather than euphoria. The confluence of weekly demand, 200 EMAs, and range-bound consolidation points to a maturing altcoin market preparing for expansion. The breakout zone is clear. Now it's about confirmation.
Charts show the setup, narratives decide the follow-through. Let's tap into the flow beneath the surface.
What's Different This Cycle
Everyone's waiting for the same fireworks as 2021. But this isn't 2021, and this time, the mechanics, motivations, and market structure are completely different. Let's break down the key shifts that make this cycle a different beast:Institutional Behavior ≠ Retail Mania
In 2021, altseason was driven by retail-fueled euphoria, everything pumped, often without a clear reason. Hype alone was enough. But this time around, the flows are different. Institutions are leading the charge, and they don't YOLO into memes. They allocate capital strategically, benchmark performance, and require both liquidity and a solid narrative before committing.ETF inflows into Bitcoin, along with growing institutional interest in real-world assets and Ethereum liquid staking tokens, point to a clear top-down capital stack: Bitcoin first, Ethereum next, and then, only maybe, large-cap altcoins with regulatory clarity. As a result, any altcoin rally this cycle is likely to be slower to start, more selective, and rooted in fundamentals or perceived real-world value rather than blind speculation.
Dominance stays higher for longer
Bitcoin Dominance remains above 60%, and Stablecoin Dominance is climbing alongside it, an unusual pairing this deep into a bull market. In past cycles, BTC dominance typically dropped quickly once price broke out, signalling a flood of capital into altcoins. This time, it's been sticky. Bitcoin's grip hasn't loosened yet, and that divergence is telling.While BTC.D has started to dip after a long uptrend, the move isn't yet strong enough to confirm full-blown rotation. Meanwhile, the Stablecoin Dominance Index remains elevated, signalling that a significant amount of capital is still on the sidelines, parked and waiting, not yet confident in where to go.
The takeaway: the market remains cautious. A rotation into alts is possible, but this time, it will follow a confirmation.
Rotation may be tactical, not frenzied
Instead of a "rising tide lifts all boats" environment, this cycle is shaping up to be more like sniper fire, capital rotating with precision into sectors that show clear catalysts, and exiting just as fast once the momentum fades.We've already seen this with narratives like AI, RWAs, and LRTs. These sectors ignite quickly, fueled by hype and headlines, but the attention span is short, and rotations are fleeting. What we're witnessing is a series of micro-altseasons, intense, short-lived rallies that might last only a few weeks before capital moves on.
There won't be a broad, sustained rally across all alts. Instead, success will come from identifying narratives early, managing risk aggressively, and staying ahead of the exits. Strategy matters more than ever.
What could kill the altseason before it starts?
The setup looks ripe: sidelined capital, early ETH strength, and signs of rotation. However, here's what could still derail the altcoin thesis, even with all the right ingredients on paper.Bitcoin + stablecoin dominance refuses to break down
The combined dominance index (BTC + stablecoins) is hovering near 73%, but it hasn't broken. If it pushes higher instead, it signals that capital continues to favor safety: Bitcoin and the sidelines. A breakout in Bitcoin dominance above the prior highs (~65%) and a continued climb toward 70-71% would confirm that institutional flows are sticking with BTC, not diversifying. Without a structure shift to the downside on this combined index, the rotation case weakens considerably.Stablecoin "Dry Powder" isn't bullish if it stays parked
$240B+ in stablecoins might sound like firepower, but only if it actually fires. Right now, a big portion of this capital might be chasing 5%+ yields in TradFi via Treasury bills or on-chain RWA protocols. That's capital earning passively, not rotating into risk. If the macro stays tight and yields remain elevated, some of that capital might never rotate, it's already found its return elsewhere.Ethereum lag would stall the entire rotation
ETH is the gateway to everything else. If ETH/BTC fails to hold its recent structure shift, or if an ETH ETF faces delays or rejection, then broad confidence in alts will suffer. Alts have never had a sustained run without ETH leading. If Ethereum can't break through with ETF momentum and improved fundamentals, smaller-cap coins won't stand a chance. ETH must outperform for capital to climb further down the risk ladder.Cryptonary's Take
This time feels different. Tightly held supply. Record stablecoin reserves. ETFs absorbing Bitcoin like clockwork. Every data point is whispering the same thing, we're close.But don't expect a repeat of 2021. The rules have changed. So have the players. This will likely be a sniper's market. A rotation game. Selective. Narrative-driven. Unforgiving to the unprepared.
What we can see from the chart is that Bitcoin dominance is stalling. Stablecoin dominance is peaking. Ethereum is stirring. And sentiment is finally shifting from hesitation to anticipation. However, don't rush, we still need the last confirmation from Total 3, BTC. D and Stablecoin dominance. If everything is good, charts say we have a good chance of having a bullish summer or at least bullish 6-8 weeks with a select few assets outperforming.
What to do? Wait for meaningful pullbacks, Dollar-Cost average/ Value Average or yield farm quality while we are on the hunt for new plays.
Peace!
Cryptonary, OUT!
Recommended from Cryptonary


