Save 23% ($351) & Get a Free 1-1 Call with our Team ⏰ : 0d 2h 59m 43s

Topics covered:
- Today's Inflation Data
- The Current Rally, From An On-Chain Perspective
- On-Chain Summary
- Crypto Index's
Today's inflation data
Today, we released new inflation data. Essentially it all came out in line with the expectations. Core MoM came in at 0.3%, whilst the Headline Rate YoY came in at 2.6%, up from 2.4%, but as expected. This was enough that markets moved up initially off the back of it as it likely still sets the FED up to cut by 25bps at this December's meeting.The current rally, From an on-chain perspective
Let's dive into the mechanics beneath the current rally to see how overbought this is and if there is more room left for prices to go higher in the immediate term. Firstly, we can see that this rally has mostly been a Spot-driven rally (healthy), which we can also see from the positive ETF inflows, which have continued this week so far.BTC ETF inflows: 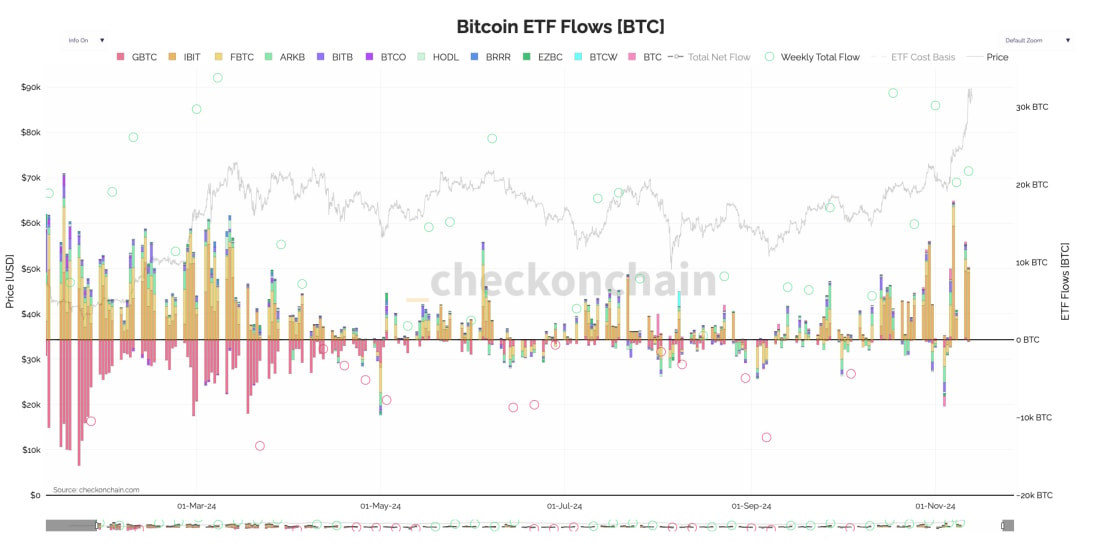 These strong flows have pushed the price well beyond BTC's prior all-time high, with the price having touched $90k yesterday. This has put the 'Percent of Addresses in Profit' metric at its highs. We did see in the 2017 period that this metric can remain this way for a long period of time if the price continually grinds higher to new highs.
Percent addresses in profit: 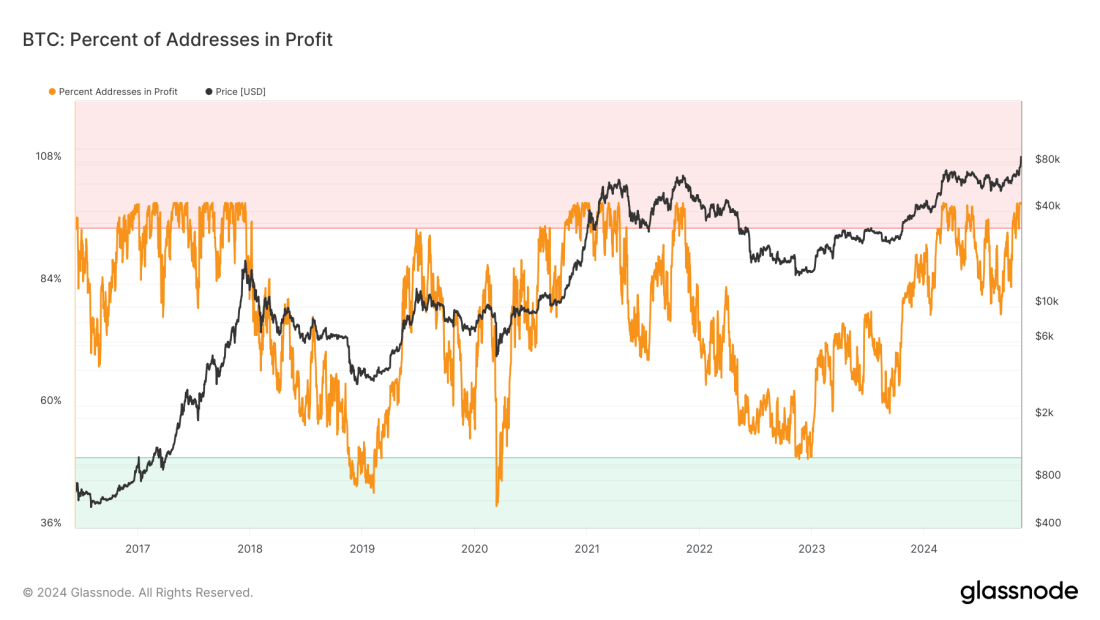 Even though we've seen a large move up in Bitcoin's price, the MVRV has also moved higher, but ratio-wise, it's not very elevated here - positive, this is bullish and implies further upside to be had. To put this in perspective, the current MVRV is at 2.6. Back in March, it hit 2.8. In Q2 2021, the height of the euphoria last cycle, it hit 3.95. The MVRV has also just recently moved off of its 365 daily moving average.
MVRV ratio: 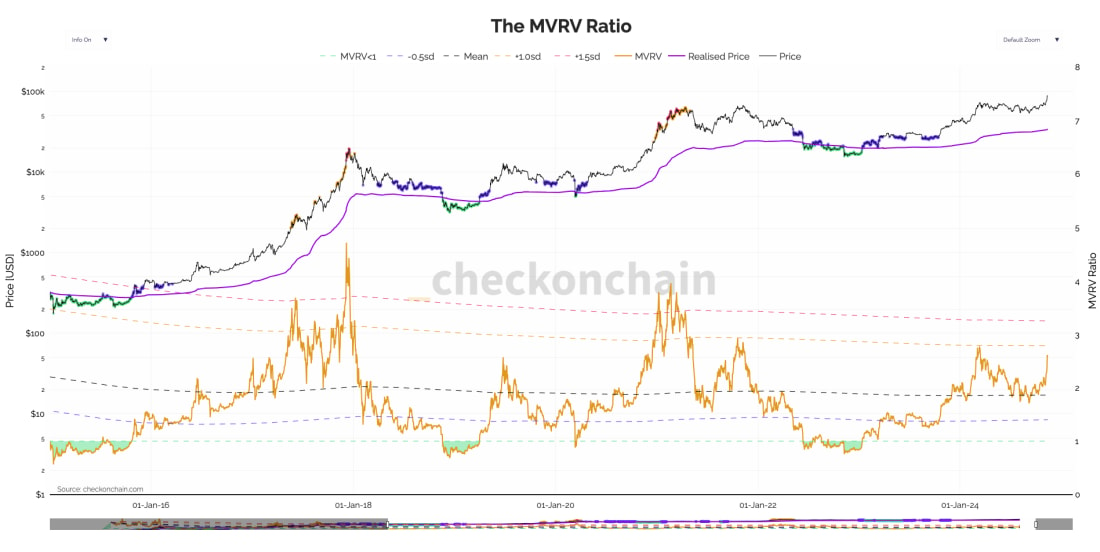 So far, there has been some meaningful profit-taking, but again, the profit-taking isn't anywhere close to being excessive here.
Net realised profit/loss: 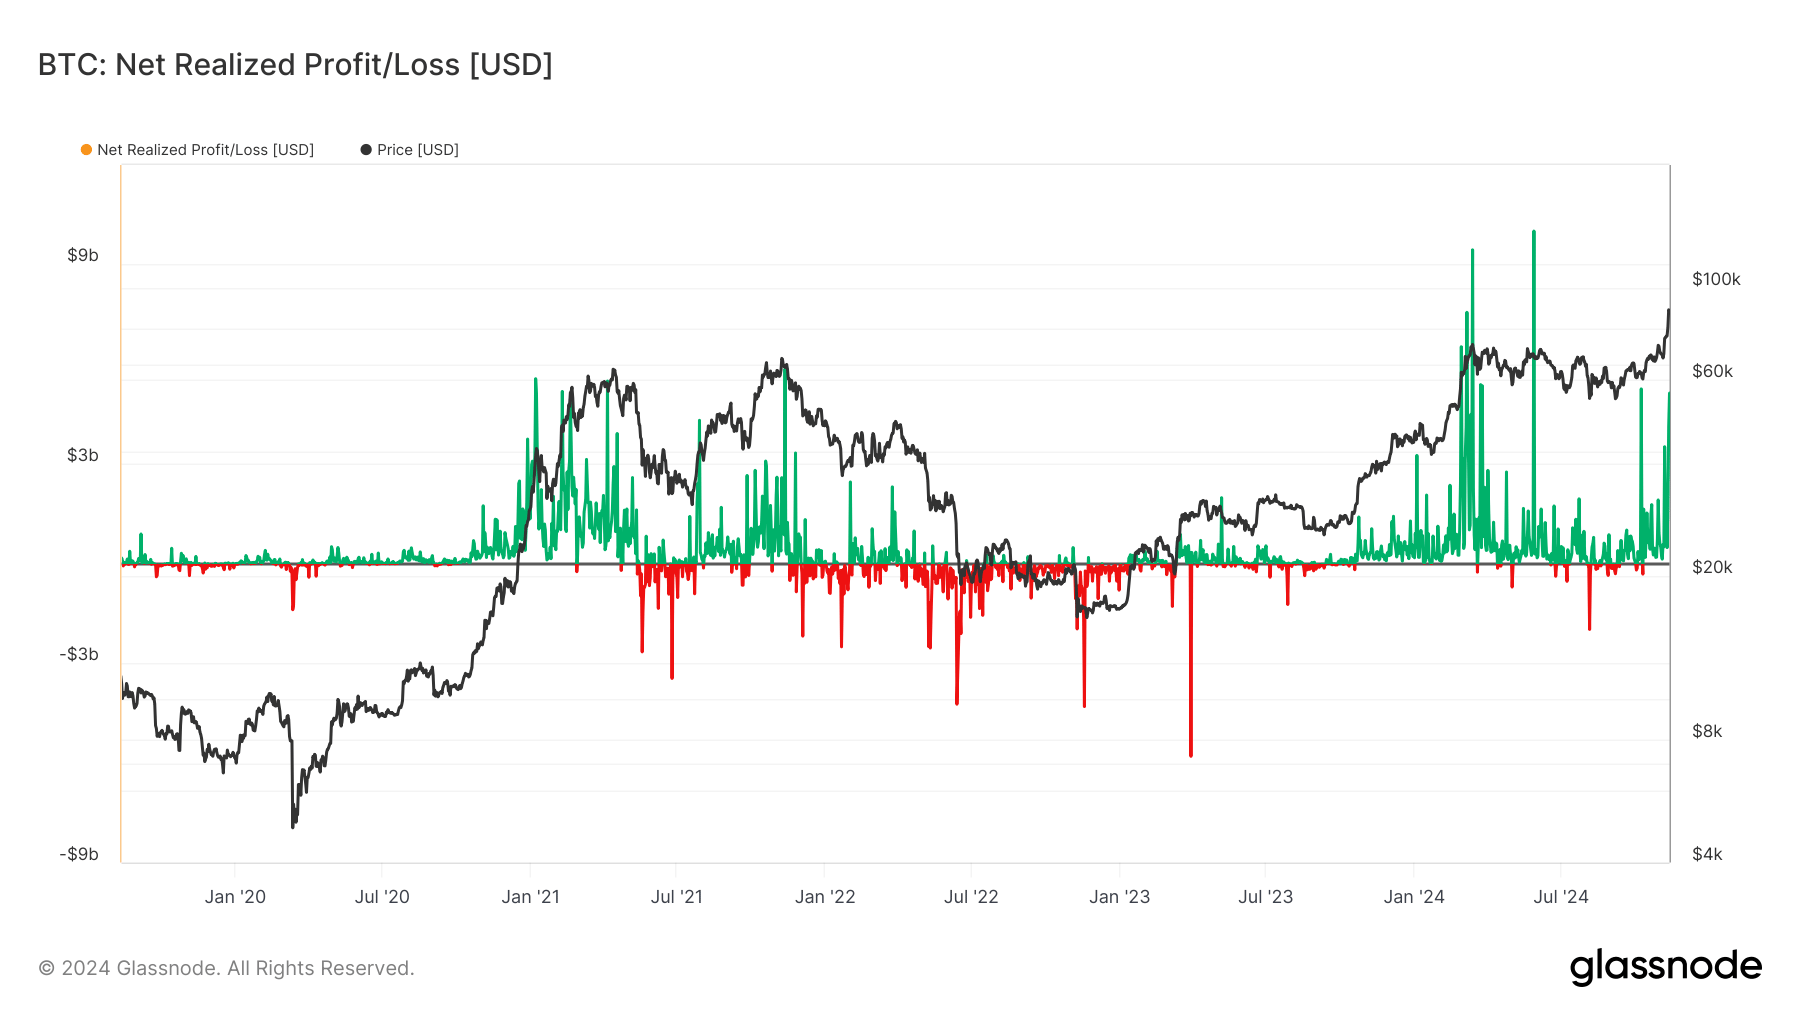 What's also positive here is that the 'Holder Net Position Change' hasn't shown a dramatic move down (red block beneath the 0 lines on the far right-hand side of the chart). The Hodler Net Position Change shows the monthly position change of long-term investors. It indicates when Hodlers cash out. There is a small red line, indicating that there has been a small amount of profit taken from the Hodlers. But, ultimately, this is extremely minimal. Currently, long-term investors (Hodlers) just aren't willing to part with their BTC at $88k.
Hodler net position change: ![]() If we then refer back to the Original Pricing Models, we can see that the MVRV +1 standard deviation is at $95k. So, there is still some slight upside in the short-term, but it is possible that in the short-term, BTC will slow down and consolidate at these higher price levels. But, the positive to this would be that overbought metrics reset, whilst it's also likely that this would give Alts/Memes the room to go on their own runs higher.
If we then refer back to the Original Pricing Models, we can see that the MVRV +1 standard deviation is at $95k. So, there is still some slight upside in the short-term, but it is possible that in the short-term, BTC will slow down and consolidate at these higher price levels. But, the positive to this would be that overbought metrics reset, whilst it's also likely that this would give Alts/Memes the room to go on their own runs higher.
Onchain original pricing models: 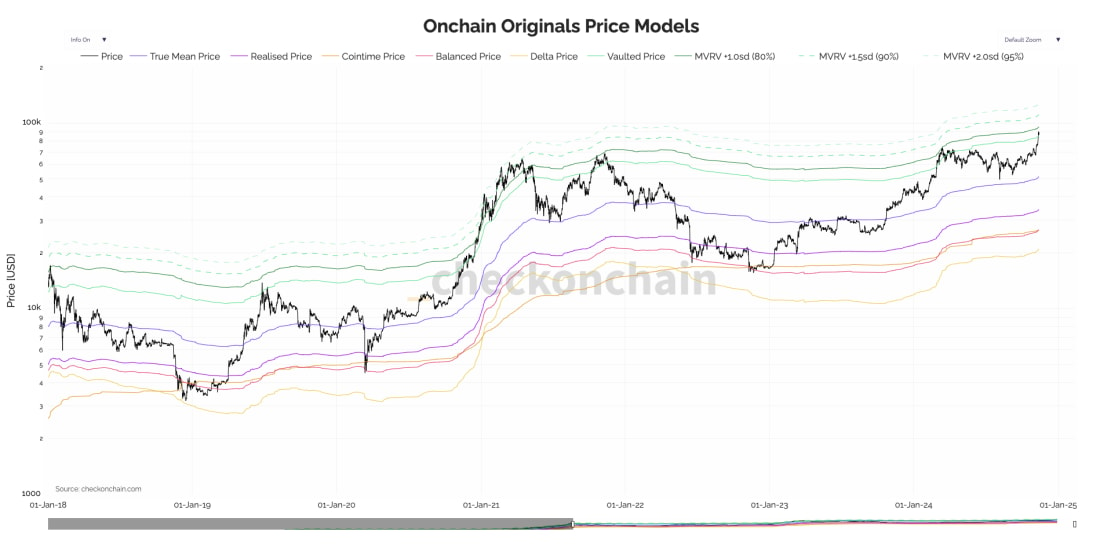 What we're now looking to gauge is whether the retail audience has come back. One of the main charts we look at for this is the YouTube views chart. We can see that this has spiked higher, but it's still nowhere near the March 2024 high and nowhere close to the 2021 high. This indicates that retail is starting to come back, but it is unlikely that the price top is near.
New Youtube views: 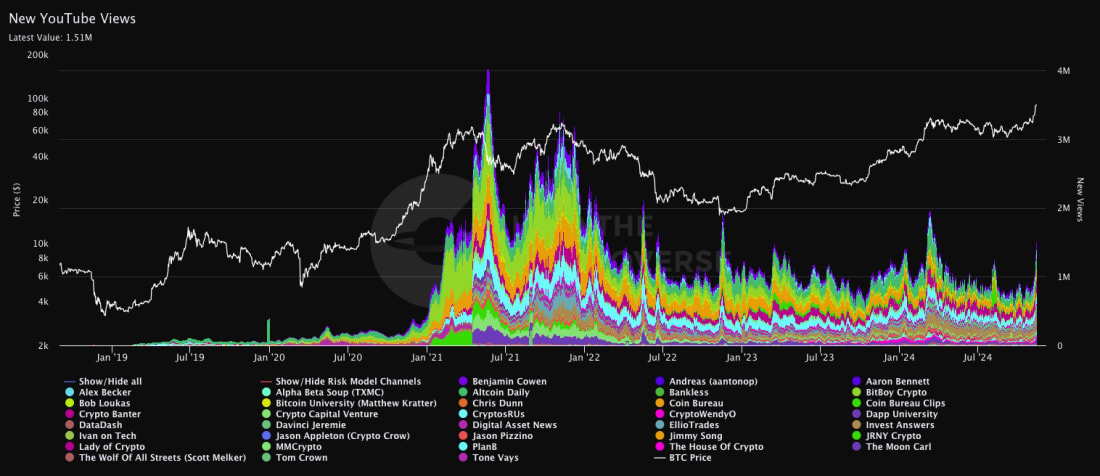
On-chain summary
Prices have rallied significantly, but long-term holders aren't yet realising substantial gains at these current prices. Alongside this, many of the pricing models suggest that the price might go slightly higher in the immediate term, but it's also just as likely, if not more likely, that the price will consolidate around the upper $ 80k for a few days/a week.Crypto index
Upon this large move up for BTC, we want to look at how Dominance is acting and also how the ALT Index is acting. What we can see is that Bitcoin Dominance is climbing. This suggests that we're still in the 'Bitcoin goes up, and Alt's/Meme's lag' phase. When dominance starts to go down, that's when we can expect the Alt/Meme season. In the meantime, we expect Alts/Meme to just continue being range-bound or grinding higher - depending on the individual coin. A possible target for BTC dominance is 63%.BTC dominance: 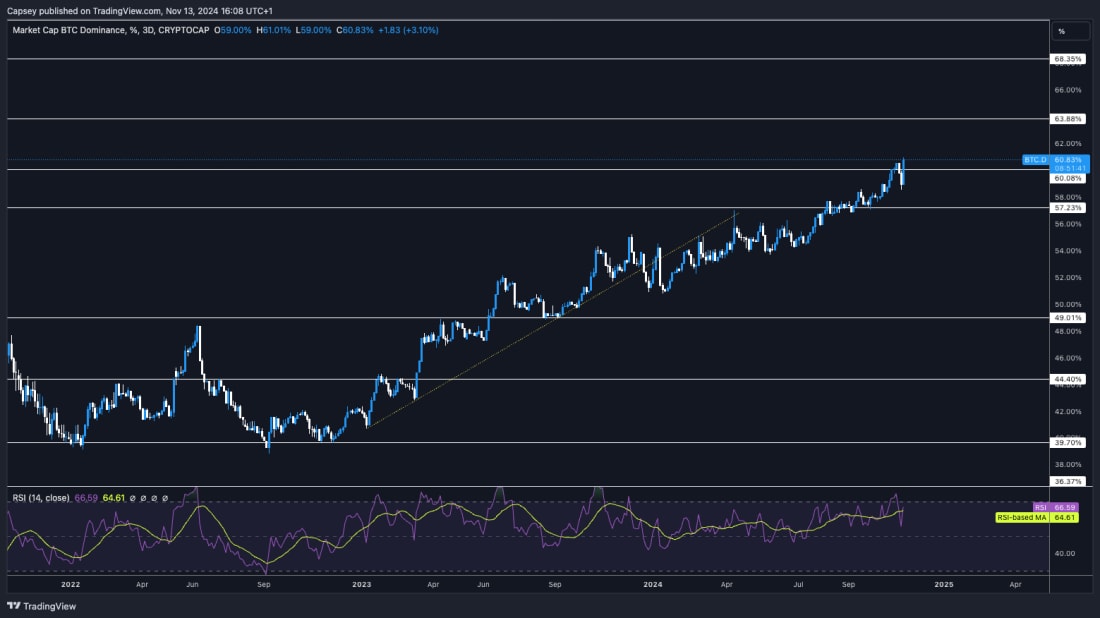 Another main Index we've been watching closely for signs of a more material breakout is the TOTAL3. This is the total market cap of crypto minus the market caps of Bitcoin and ETH. We can see in the below that this has also broken out above the key level of $704b.
There is another resistance at $780b, where we're currently finding a bit of resistance. We'd expect to see this cool off in the coming days, but likely not by much, before then breaking out above $780b. The minimum target is prior to all-time highs at $ 1.1 trillion. In plain english = our Alts/memes are likely to go substantially higher in the coming months.
TOTAL 3: 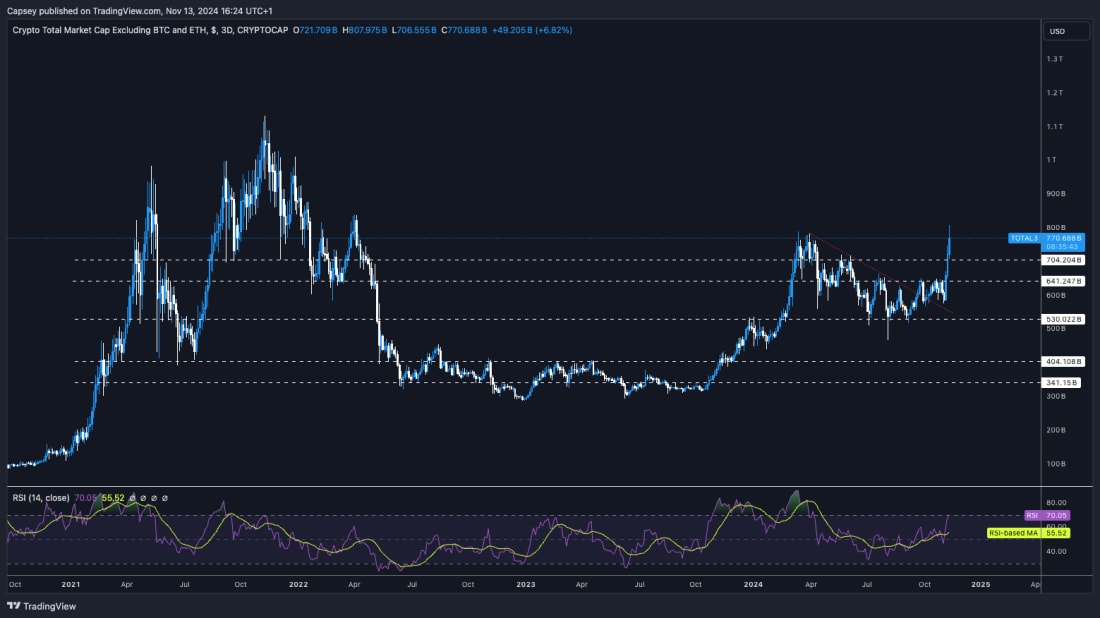
Cryptonary's take
Ultimately, the message here remains the same. The outlook for Crypto is good, with a positive macro backdrop. Alongside that, we're now seeing technical breakouts across the board. It's very likely we're in the period where Bitcoin has its run. Once it slows down, this will give room to the rest of the space (Alts/Memes) to have their runs.For now, we're remaining patient and letting our prior years and months of work reap the rewards as our Spot bags move up nicely in value. The error here would be over-trading and messing around with those Spot bags. We're in a good part of the market (in terms of the cycle). Let the market do the hard work for you here.
Recommended from Cryptonary


