Save 23% ($351) & Get a Free 1-1 Call with our Team ⏰ : 0d 2h 59m 44s

Let's dive into the numbers and market impact. In this report:
- Data So Far, and Thoughts Going Into Tomorrow's Data.
- Israel/Iran Escalation and its Impact on Markets.
- BTC and On-Chain Fundamentals of this Pull Back.
Disclaimer: This is not financial or investment advice. You are responsible for any capital-related decisions you make, and only you are accountable for the results.
Data so far and thoughts going into tomorrow's data
This week is a labour market data-intensive week. On Tuesday, job openings came in at 8.04m, which was a large increase from the prior month, meaning that employers are advertising for more open positions.However, we saw that the number of job quits fell to its lowest level since COVID-19. People have less confidence that they can go and get another job, so they're less likely to quit their current job. This is perhaps an early sign of some weakening. On Wednesday, we had the ADP Employment Change come out at 143k jobs added. This is a substantial increase in prior months, and after BLS revisions, perhaps ADP has actually been the more accurate reporter on jobs (in comparison to the Bureau of Labour Statistics).
This is positive and suggests the labour market is more than hanging in there. This was then backed up today when Jobless Claims came in at 225k. No material increase in this figure is positive, which likely means we can see the unemployment rate remain at the 4.2% to 4.3% levels tomorrow. This week's jobs data, so far, points to Non-Farm Payrolls and an Unemployment Rate that we expect to come in positively tomorrow, i.e., a print of more than 130k jobs and the Unemployment Rate to remain below 4.3%.
If the data comes in as we expect, markets will like that, but over the last few days, the market has been mostly focused on the developments between Israel and Iran.
Israel/Iran escalation and its impact on markets
Over the last few days, the markets have begun to price in the escalation in the Middle East. Now, we're not seeing TradFi markets come down a lot at all, and that's likely due to traders still doubting that an all-out war will happen.Both sides have advocated for this, despite the Israelis continuing to push and strike in Lebanon, taking out all of Hezbollah's upper hierarchy. The Iranians responded to the death of Hassan Nasrallah by firing several hundred ballistic missiles, although just one person was killed, and only military sites were targeted.
So, even though you see the clips on Twitter of missiles being fired and landing in Israel, the total damage hasn't been large by any stretch (according to reports). But again, the Israelis will likely respond to this attack, and this is where the market has begun re-pricing slightly.
Firstly, the conflict seemed to have moved to Israel against Hezbollah, and Iran stated that they didn't want to get involved in a war that was settling for markets. Of course, this changed when it was Iran itself that responded. This caused some risk in risk assets, but again, nothing very sizeable as the market still doubts that this will develop into an all-out war.
Second to this is that the Israelis are now looking to hurt Iran more, and therefore, it's possible that Iran's oil fields will be targeted. Iran produces 1.7m barrels of oil/day, so this would be a big hit to their $ coffers. The issue with this is that a lower supply of oil means the price of oil will go up.
This is inflationary... and therefore, it may mean that the FED does slightly fewer Interest Rate cuts than what the market was pricing for, as they now have a slight eye back on the inflation picture as it's possible the price of oil continues to rise. Oil is up 10% since Monday's session.
Oil 1D chart: 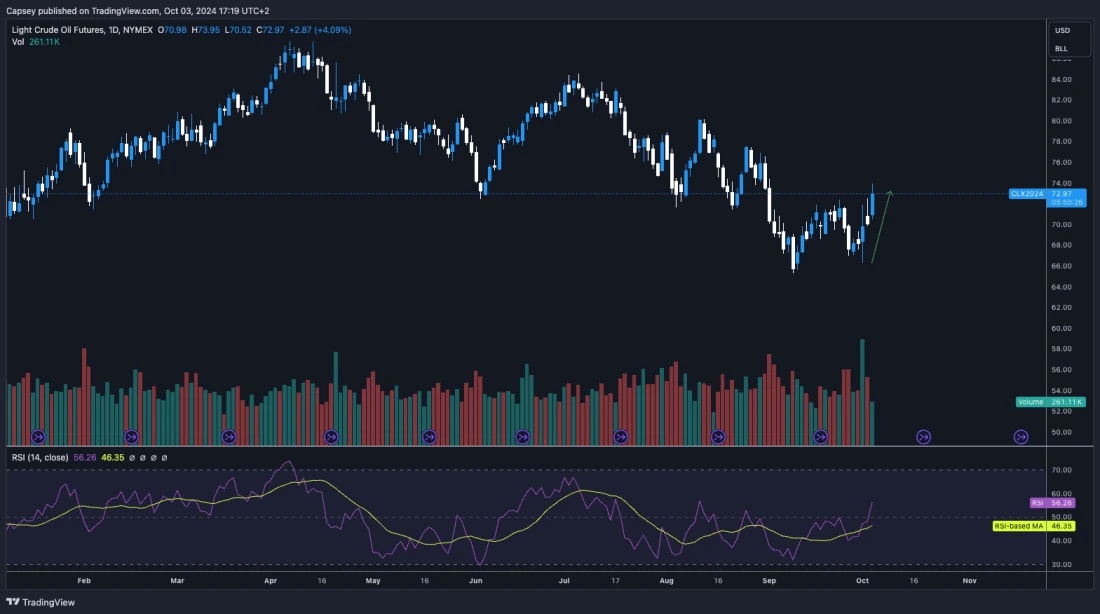 However, we can see that the S&P is only down 1.22% from its highs, so yes, there has been some risk, but nothing majorly drastic.
S&P 1D chart: 
BTC on-chain fundamentals of this pullback
From a price perspective, Bitcoin was up 26% from its lows in early September, but the price has now gone down 8.5% in the last six days.Let's now dive deeper into this Bitcoin pullback to see if there's anything under the hood that should have us concerned or if this is just a normal pullback following the gains we saw in September.
The first metric is the Net Realised Profit/Loss. We can see that on this price move down, this indicator has returned to the 0 line. This indicates that some profits were taken, but the 0 line is also supported in bull markets. Investors don't look to book losses as they're confident in the market, and therefore, they continue holding their bags and waiting for the market to bounce - hence, the 0 lines can act as support. We're now there, and it would be very normal for price to find support at or very close to this level.
Net realised profit/loss: 
If we then look at the Relative Unrealised Loss, we can see that investors are not holding large losses (no significant spike in this metric currently), so investors are not likely feeling the pressure to capitulate on their bags, as they're just not in that great a loss (per cent wise).
Relative unrealised loss: 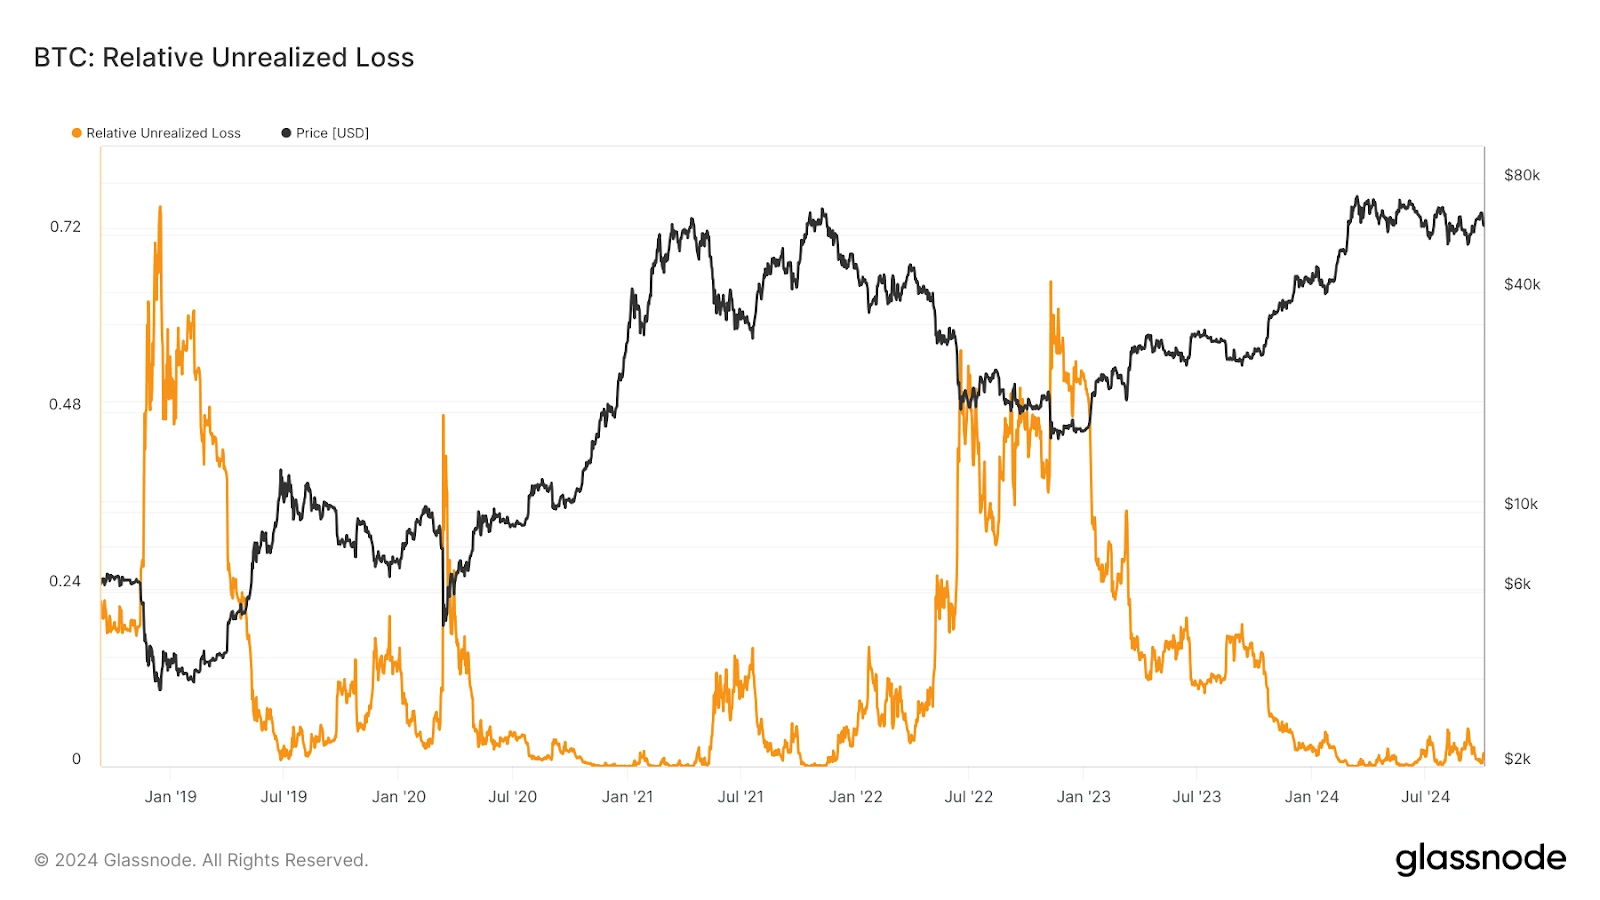
Now if we look at pricing models, one of those is MVRV Ratio Momentum. Over the last six months, this has reset substantially, having never really been overbought anyway. It is now below its 365d average, which would be bearish if this trend persists. However, this metric currently looks similar to the 2019 period (check out the oscillator - slightly red, indicating the MVRV is only just below its 365d average).
MVRV ratio momentum: 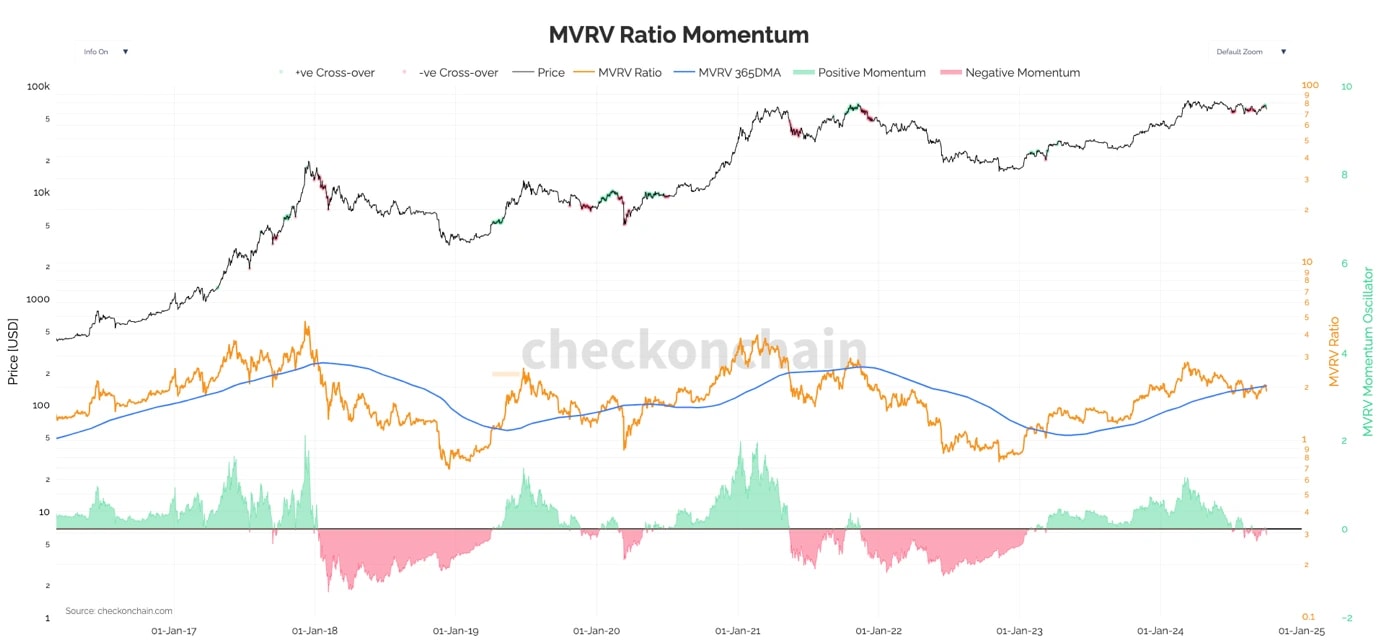
If you now say to me, "ok, sieve through the noise of this, where are we in comparison to past cycles? Is this normal?" I'd say "yes" and that "we're right on track". Check out Bitcoin's price performance against the number of days from the cycle low. And now check this out against prior cycles. This seems very normal to me, and for now, at least, it's not worth getting our 'knickers in a twist' over.
Price performance since cycle low: 
Cryptonary's take
Price performance during September was very strong, so we may now see a slight pullback, one we were calling for and expected at some point soon. Iran's retaliation (despite never having a huge effect) was enough. However, risk assets, in general, have only been pulled back minimally.Now, we're not ruling out further downsides, and if we do get further downsides, we think $58k is probably the local floor. Generally speaking, however, we see the optimal move as being constructive. This pullback looks very typical, and even looking under the hood of it, there isn't anything there that's materially concerning. We remain constructive, and if prices do pull back a bit more, we'd see those as a good bidding area if you're not already bidding at current prices.
Recommended from Cryptonary


