Save 23% ($351) & Get a Free 1-1 Call with our Team ⏰ : 0d 2h 59m 44s
Jupiter (JUP) price prediction: Will it break $1.8 again?
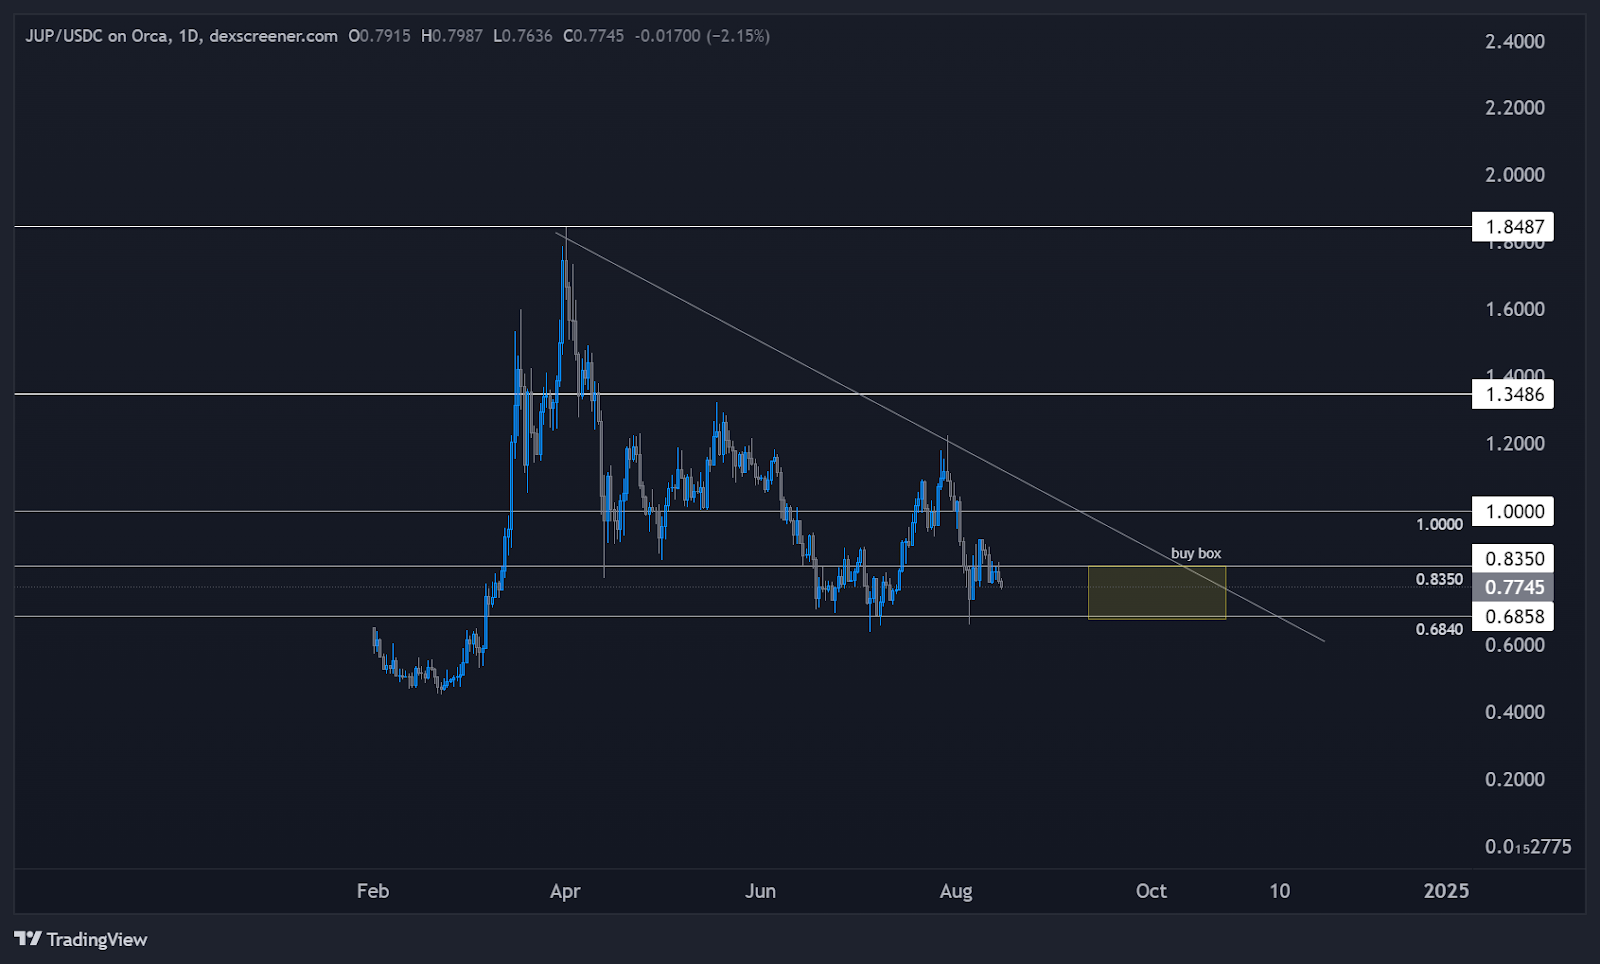
Jupiter has been undergoing a significant period of price action since the end of February. After a sharp bullish move, the asset surged from $0.4532 to $1.8, marking a substantial 300% gain.

However, since reaching this peak, the asset has struggled to maintain those elevated levels, failing to set any higher highs, which indicates a potential lack of demand at those prices. The price has since retraced significantly, returning to around the $1 mark, a psychologically important level for traders
Key observations: Bullish run and retracement:
Jupiter experienced a 300% increase in late February, peaking at $1.8. The subsequent inability to set higher highs has led to a retracement back to the $1 level, highlighting a potential shift in market sentiment.
Lower highs and macro wedge formation:
The asset has formed two notable lower highs, one on March 31st and another around July 29th-30th. This price action is contributing to the development of a larger macro wedge pattern, with Jupiter trading within a narrowing range
Key support levels:
Current key support is identified between $0.69 to $0.70. Additionally, the asset has formed a double bottom at the $0.6840 level, often a strong indicator of a robust support zone.
Disclaimer: This is not financial or investment advice. You are responsible for any capital-related decisions you make, and only you are accountable for the results.
Potential scenarios: Bullish scenario:
If Jupiter breaks out of the current macro wedge pattern to the upside, especially if it surpasses the $1.8 high, it could signal renewed demand and a bullish continuation. Accumulating the asset between the $0.6840 and $0.8350 regions, as planned, might offer a strong risk-reward opportunity, particularly if the price respects the double bottom support at $0.6840.
Bearish scenario:
Should Jupiter fail to hold the $0.6840 support and break down from the wedge pattern, this could indicate further downside potential. In this case, watching for a decline below the $0.69 level would be crucial, as it may suggest a bearish trend continuation.
Conclusion:
Neutral/Bullish: Jupiter is currently consolidating within a macro wedge pattern, with significant support around the $0.6840 level. The formation of lower highs and the double bottom suggests the asset is at a critical juncture. A breakout from this wedge could dictate the next major move, making the coming weeks pivotal for determining Jupiter's direction. If the price respects the $0.6840 support and breaks out to the upside, it could offer a promising bullish setup. However, a breakdown below this level would signal caution for bullish traders.
Recommended from Cryptonary


