Save 23% ($351) & Get a Free 1-1 Call with our Team ⏰ : 0d 2h 59m 43s
Market dynamics favour Memecoins and Altcoins
Memecoins like $PEPE surged after the Coinbase listing, driving major market moves. Altcoins like RUNE and SUI showcase bullish patterns, while Nosana finds strong support zones. Let’s analyze what’s ahead for these top performers.

Disclaimer: This is not financial or investment advice. You are responsible for any capital-related decisions you make, and only you are accountable for the results.
PEPE:
Overview
$PEPE has taken the crypto world by storm, recently achieving a major milestone with its listing on Coinbase, one of the most prominent cryptocurrency exchanges. This development solidifies $PEPE's status as a leading memecoin, particularly in the ongoing memecoin supercycle. It has now climbed to the 15th spot in cryptocurrency market capitalization, surpassing Bitcoin Cash, and is currently valued at over $9 billion.Over the past week, $PEPE has delivered a staggering 105% gain, demonstrating a strong performance in the Ethereum memecoin space and reinforcing its position as a top asset in the current market cycle.
Daily time frame analysis
On the daily chart, $PEPE recently broke out spectacularly following the Coinbase listing announcement, surging 50% on the news. The 200 EMA had been a crucial support level, complemented by the daily demand zone between $0.0000082 - $0.0000088, which had been highlighted in previous analyses.Despite a brief breakdown below the 200 EMA and the demand zone, $PEPE reversed hard after forming a local bottom at $0.0000077, a clear signal of strong buyer interest. Since reclaiming the $0.0000010 level, $PEPE has gone parabolic, delivering a remarkable 230% rally from its early November low.
Currently trading at $0.000021, $PEPE appears to be stabilising after its recent explosive move. Immediate resistance lies at its ath now $0.0000256, with further upside potential if this level is broken. On the downside, its previous ath at $0.000017 acts as a strong support if PEPE takes a pullback.

Want insights into PEPE price prediction? Read our full analysis to see where PEPE is heading next!
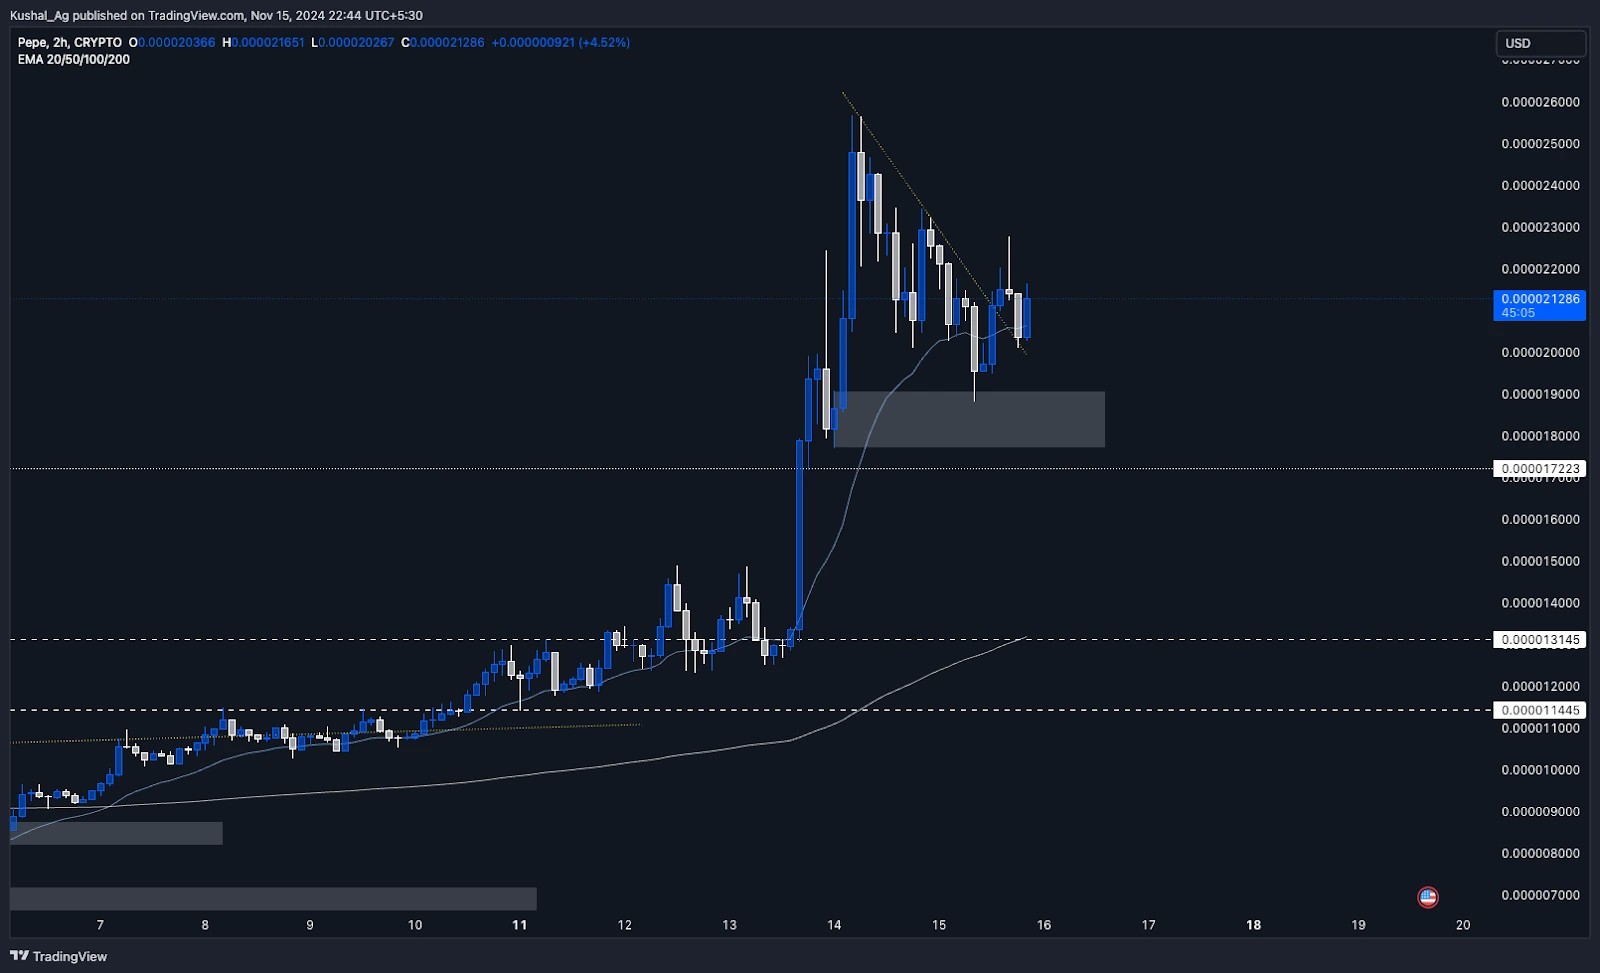
2-hour time frame analysis
Zooming into the 2-hour chart, $PEPE exhibits bullish short-term price action. The asset has consistently held the 20 EMA as support, forming a solid base around this level. Additionally, $PEPE has created a demand zone on the 2-hour time frame, ranging from $0.000019 - $0.000177, and has mitigated it with a wick and taken strong reversal.Significantly, $PEPE has broken out of a short-term downtrend trendline and even retested it successfully, indicating a bullish setup for further upward movement. With the wider market aligning, $PEPE is well-positioned to attempt another push higher, potentially targeting the $0.0000024 resistance level in the near term.
Cryptonary's take
$PEPE continues to prove its dominance in the memecoin space, fueled by its Coinbase listing and significant price movements. Technically, it holds critical support levels while showing consistent strength in both the daily and 2-hour time frames. For short-term traders, the breakout above the 2-hour downtrend and the strong support at the 20 EMA and demand zone provide an interesting momentum-based setup. For long-term holders, $PEPE's bullish market structure, reinforced by its market cap milestones, makes it a standout asset in the ongoing memecoin supercycle.That said, memecoins are inherently volatile, and traders should exercise caution by closely monitoring key support zones like the 2-hour demand zone and the previous ATH. The wider market will play a critical role in sustaining $PEPE's momentum, but for now, it remains a top contender in the crypto space.
RUNE:
Market context
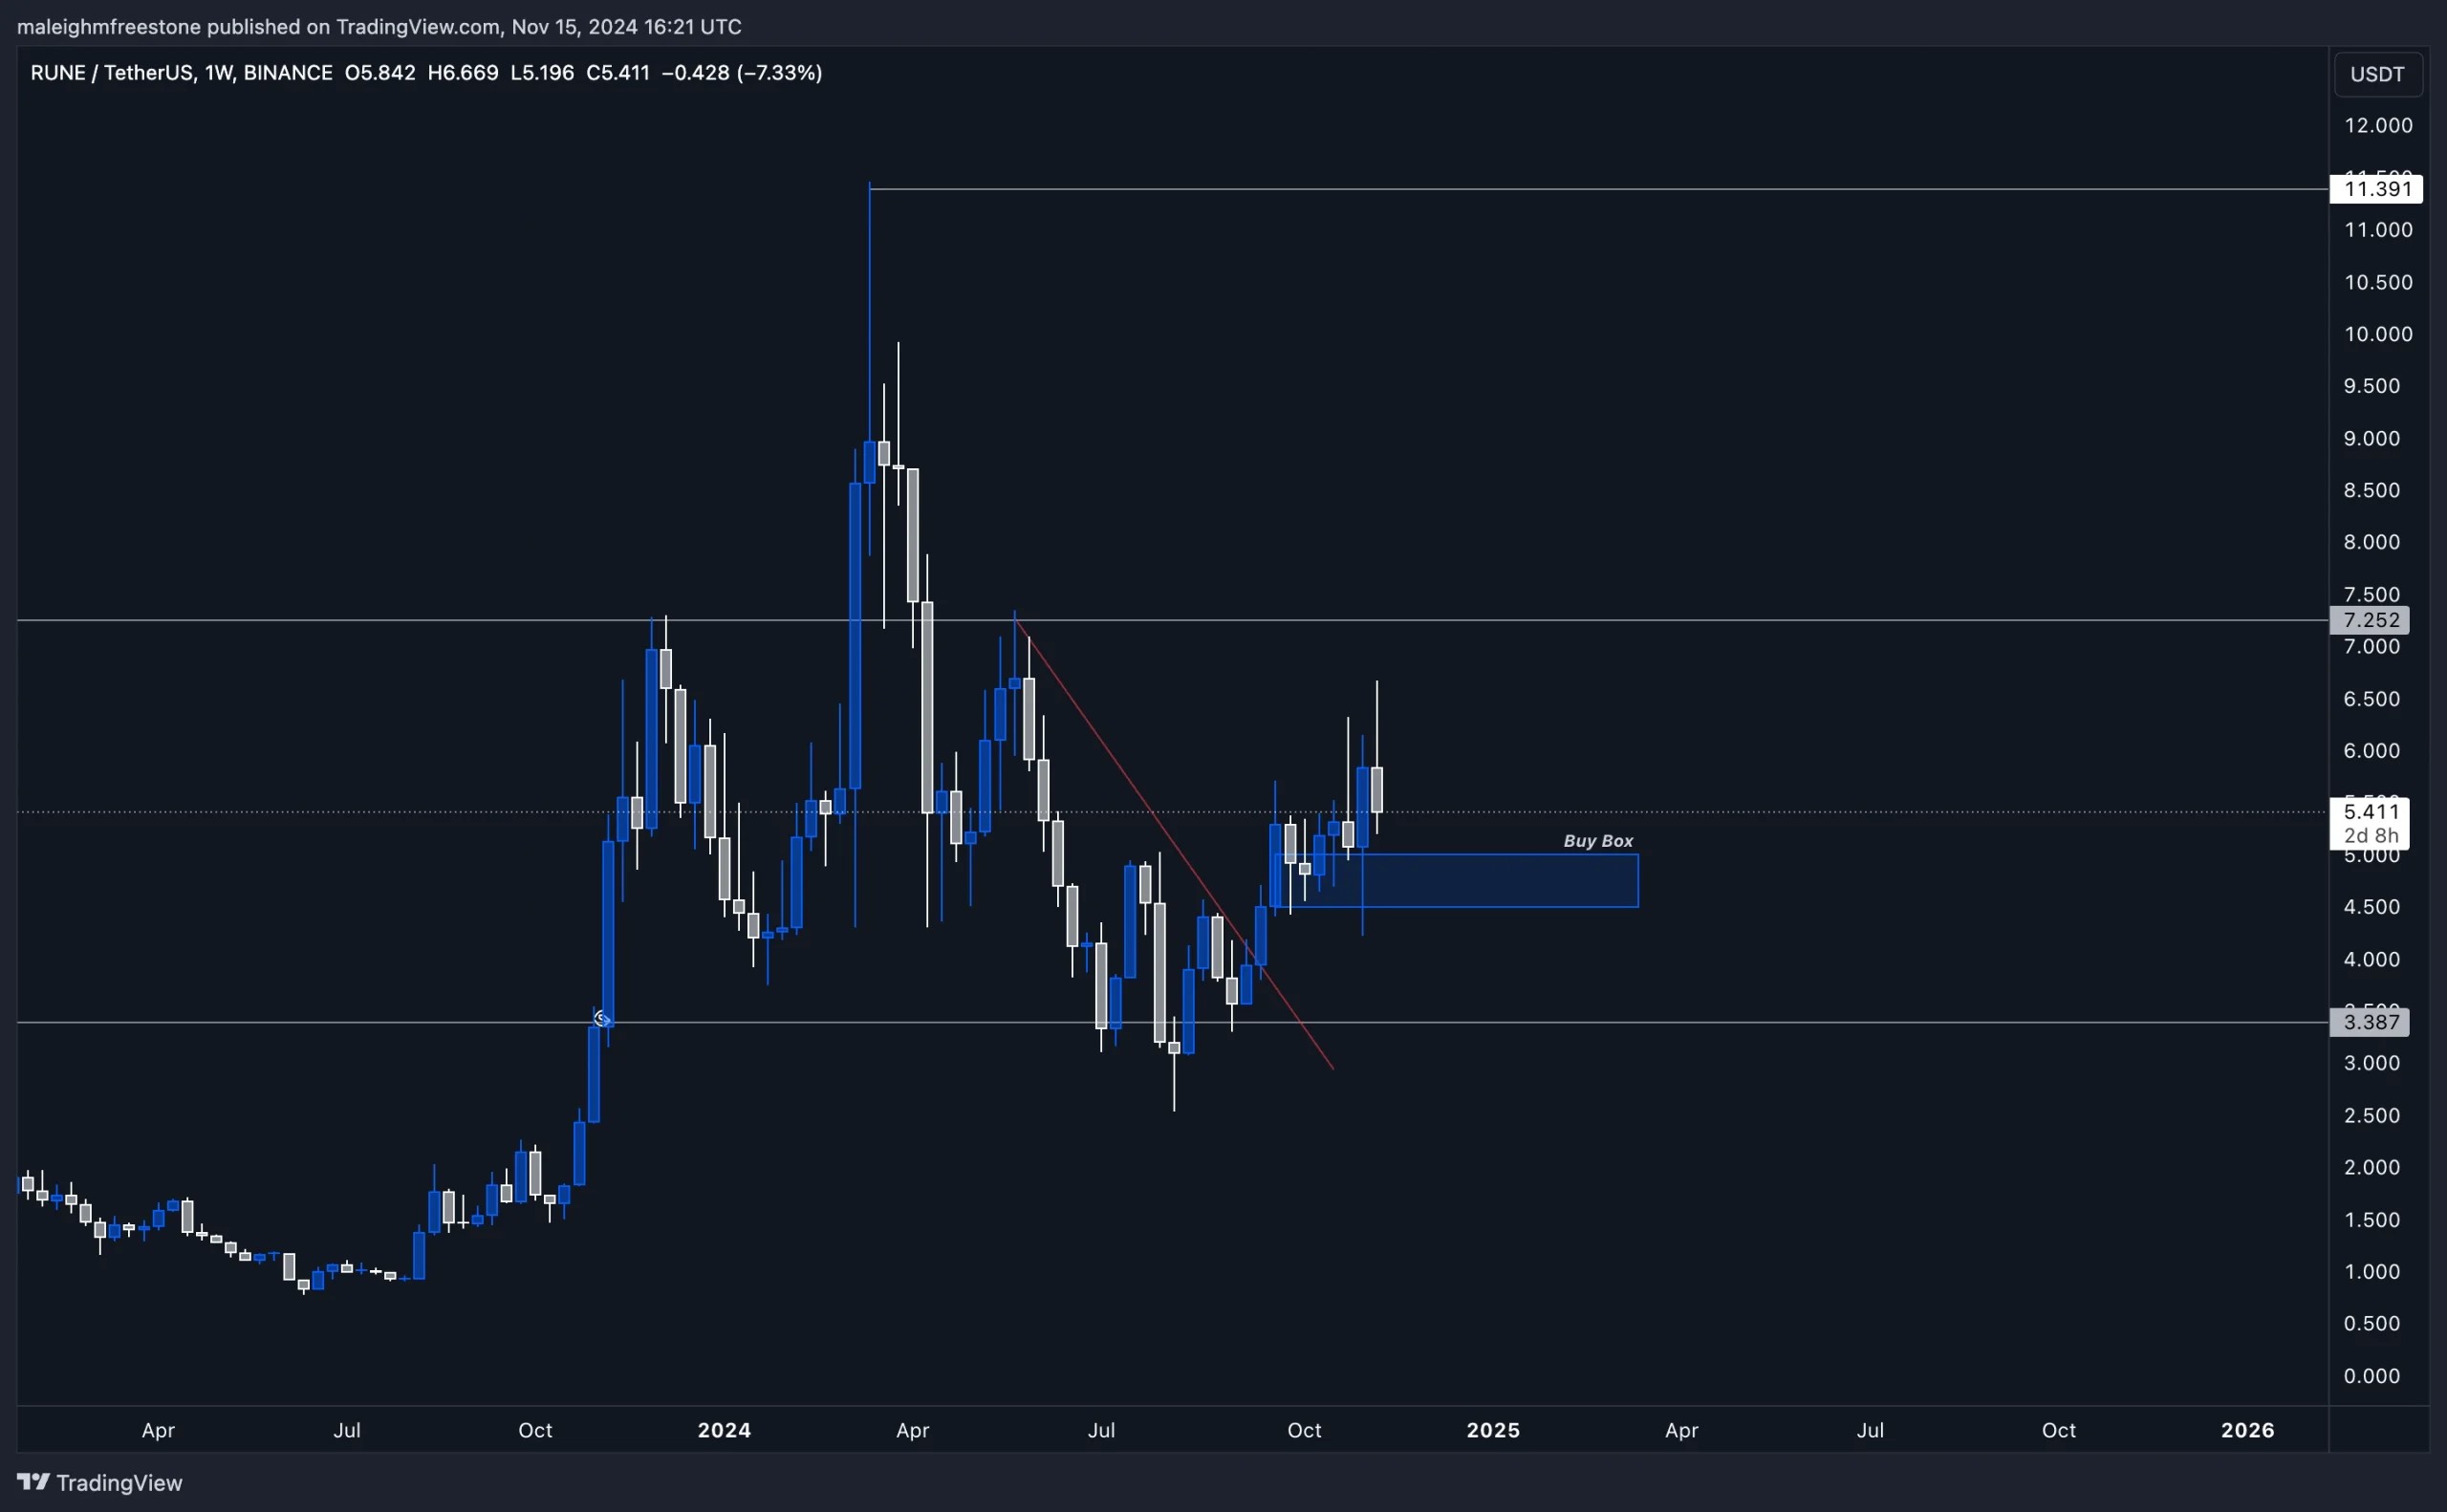
In our last breakdown, we emphasised the importance of the $5 level as a primary buy zone for RUNE, and we've seen promising movements in line with broader market dynamics. As Bitcoin has been trading significantly higher, RUNE's chart against BTC is starting to form a wedge pattern, a sign of potential bottoming out and setup for future movement. This wedge formation could signal a shift, especially if Bitcoin stalls or sees a slight pullback in dominance, setting up capital flow into altcoins like RUNE.On the RUNE/BTC chart, we've identified a key support level showing a double bottom formation. If RUNE revisits this support, we'd be looking for a demand-driven bounce at this level to sustain the wedge pattern.
The price aligns with the $5 mark in our buy zone, reinforcing this as a potential entry point for positioning. We're also keeping an eye on capital flow patterns, where a temporary slowdown in Bitcoin could translate into rotation into high-cap alts, benefiting RUNE. With RUNE trading within our blue buy box, this setup aligns with our broader market strategy to leverage opportunities when alts see inflows from BTC.
Playbook
Objective: Capitalize on RUNE's accumulation zone and monitor the wedge pattern on the RUNE/BTC chart to time entries.- Spot accumulation zone: Look to add spot positions within the $5.0-$5.5 buy box, with a focus on any retests within this range for building a position.
- Wedge breakout target: A strong move past $5.5 would target a breakout towards $7 on RUNE/USD, with potential continuation to $10-$11 if the broader market maintains strength.
- Risk management: Given recent manipulation around $4.5, place a stop-loss just below this level to manage downside risk effectively.
Key levels
- $5.0 - $5.5: Primary buy box and strong support zone.
- $7.0: Initial breakout target for continued upside.
- $10.0 - $11.0: Extended target, assuming positive capital flow into alts.
Educational insight: Wedge patterns and liquidity dynamics
The wedge pattern on the RUNE/BTC chart is crucial here, as it suggests potential consolidation and accumulation ahead of a directional move. Recognizing wedge formations can be a powerful tool for spotting trend shifts or continuations, especially when paired with strong support and resistance zones. Additionally, the recent bounce at $4.5 in RUNE/USD exemplifies a liquidity sweep- an intentional move to shake out weaker hands before reversing. Understanding these dynamics can help us navigate volatility and avoid being caught on the wrong side of the market.Cryptonary's take
RUNE's current setup shows strong alignment with broader market trends, as well as potential support from Bitcoin's capital flow dynamics. While RUNE isn't a core holding, it remains in our CPRO picks for its resilient performance and attractive buy zone around $5-$5.5. The wedge pattern on the RUNE/BTC chart combined with solid demand levels makes this a compelling trade for those aiming to capitalize on high-cap alt momentum. Spot accumulation within the buy box and disciplined positioning can help maximize the opportunity here, especially if the market continues its bullish trajectory.NOS:
Market context
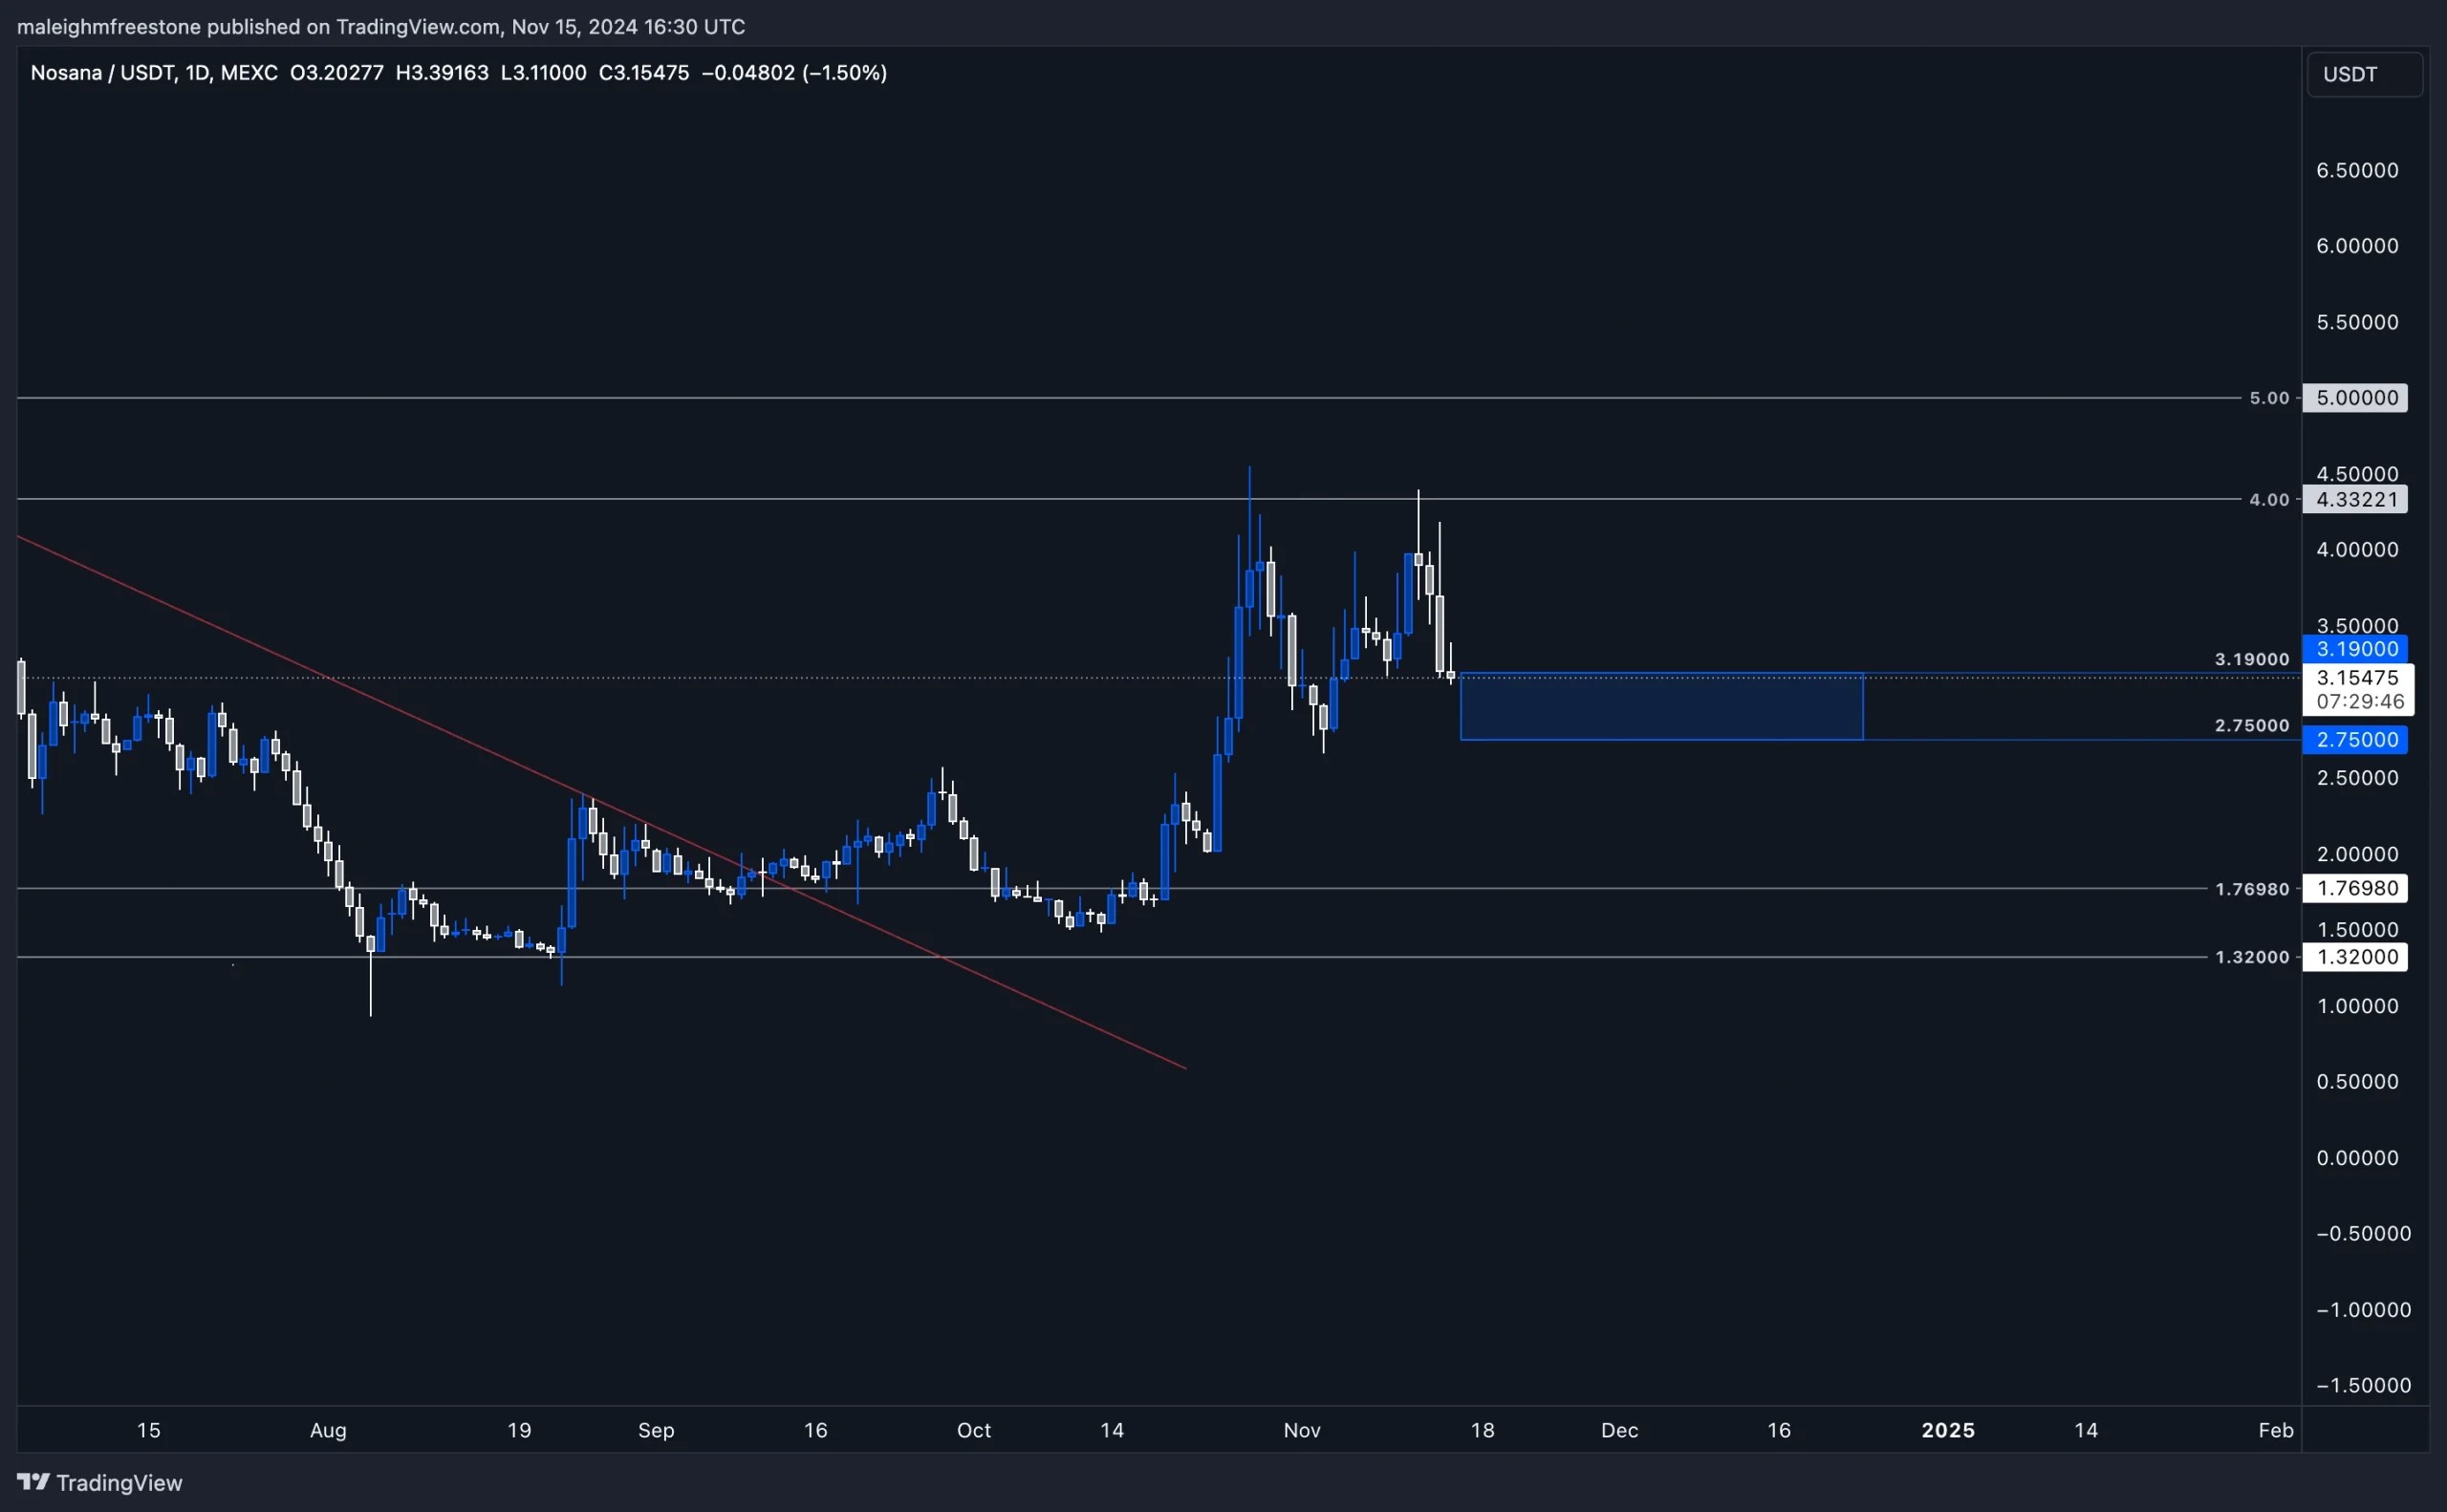
Nosana has been performing exactly as we anticipated, solidifying its position as a high-probability setup within our CPRO Picks. We previously highlighted the 2.75 to 3.19 buy box as a critical accumulation zone based on historical support and resistance levels. Price has now retraced to this area, validating our analysis and confirming that this range holds strong buying interest.This is an area we've had on the radar for months, and its reappearance as a viable buy zone reinforces our confidence in this setup. We've been closely monitoring Nosana's price action, especially as it trades back above the 2.7 level, a key level we successfully traded months ago.
Following a period of negative price action that pushed it below this level, Nosana is now reclaiming this zone, a clear signal of renewed demand. This aligns well with our previous profitable trades on Nosana and reaffirms our call to accumulate in this area. With BTC showing potential for consolidation, there's a strong chance capital flow will shift towards quality alts like Nosana, positioning it well for a bid in the near term.
Playbook
Objective: Accumulate Nosana within the 2.75 to 3.19 range, leveraging the current pullback as a high-probability entry point.- Spot accumulation zone: Initiate spot positions between $2.75 and $3.19, building exposure as Nosana consolidates within this key zone.
- Breakout target: Should Nosana break past $4 with sustained demand, we're looking for a move toward $7.9, representing a significant upside opportunity.
Key levels
- $2.75 - $3.19: Primary accumulation zone for spot entries.
- $1.32: Major historical support, with significant demand.
- $4.0: Immediate breakout target and potential consolidation point.
- $7.9: Longer-term target if the momentum continues.
Cryptonary's take
We called the 2.75 to 3.19 buy box on Nosana a key area to watch, and recent price action confirms this as a viable accumulation zone. Our initial analysis identified this range based on previous successful trades, and Nosana's move back into this area underscores the strength of this level. Demand has been clear, with Nosana recently rallying 100% from $2, outpacing many other assets last week- a clear indicator of buying pressure.With capital flow dynamics suggesting a potential bid in alts, Nosana is set up well for further gains if it maintains momentum. As the market continues to favour high-quality alts, Nosana's structure is aligning for potential upside. The retest of this accumulation zone not only validates our analysis but also provides a strategic entry point for those looking to build exposure.
This is the type of setup we are looking for: strong demand, clear levels, and high probability. If Nosana reclaims $3.2, we'll be watching closely for a continued move towards previous highs, potentially capturing a significant rally in the process.
SUI:
Market context
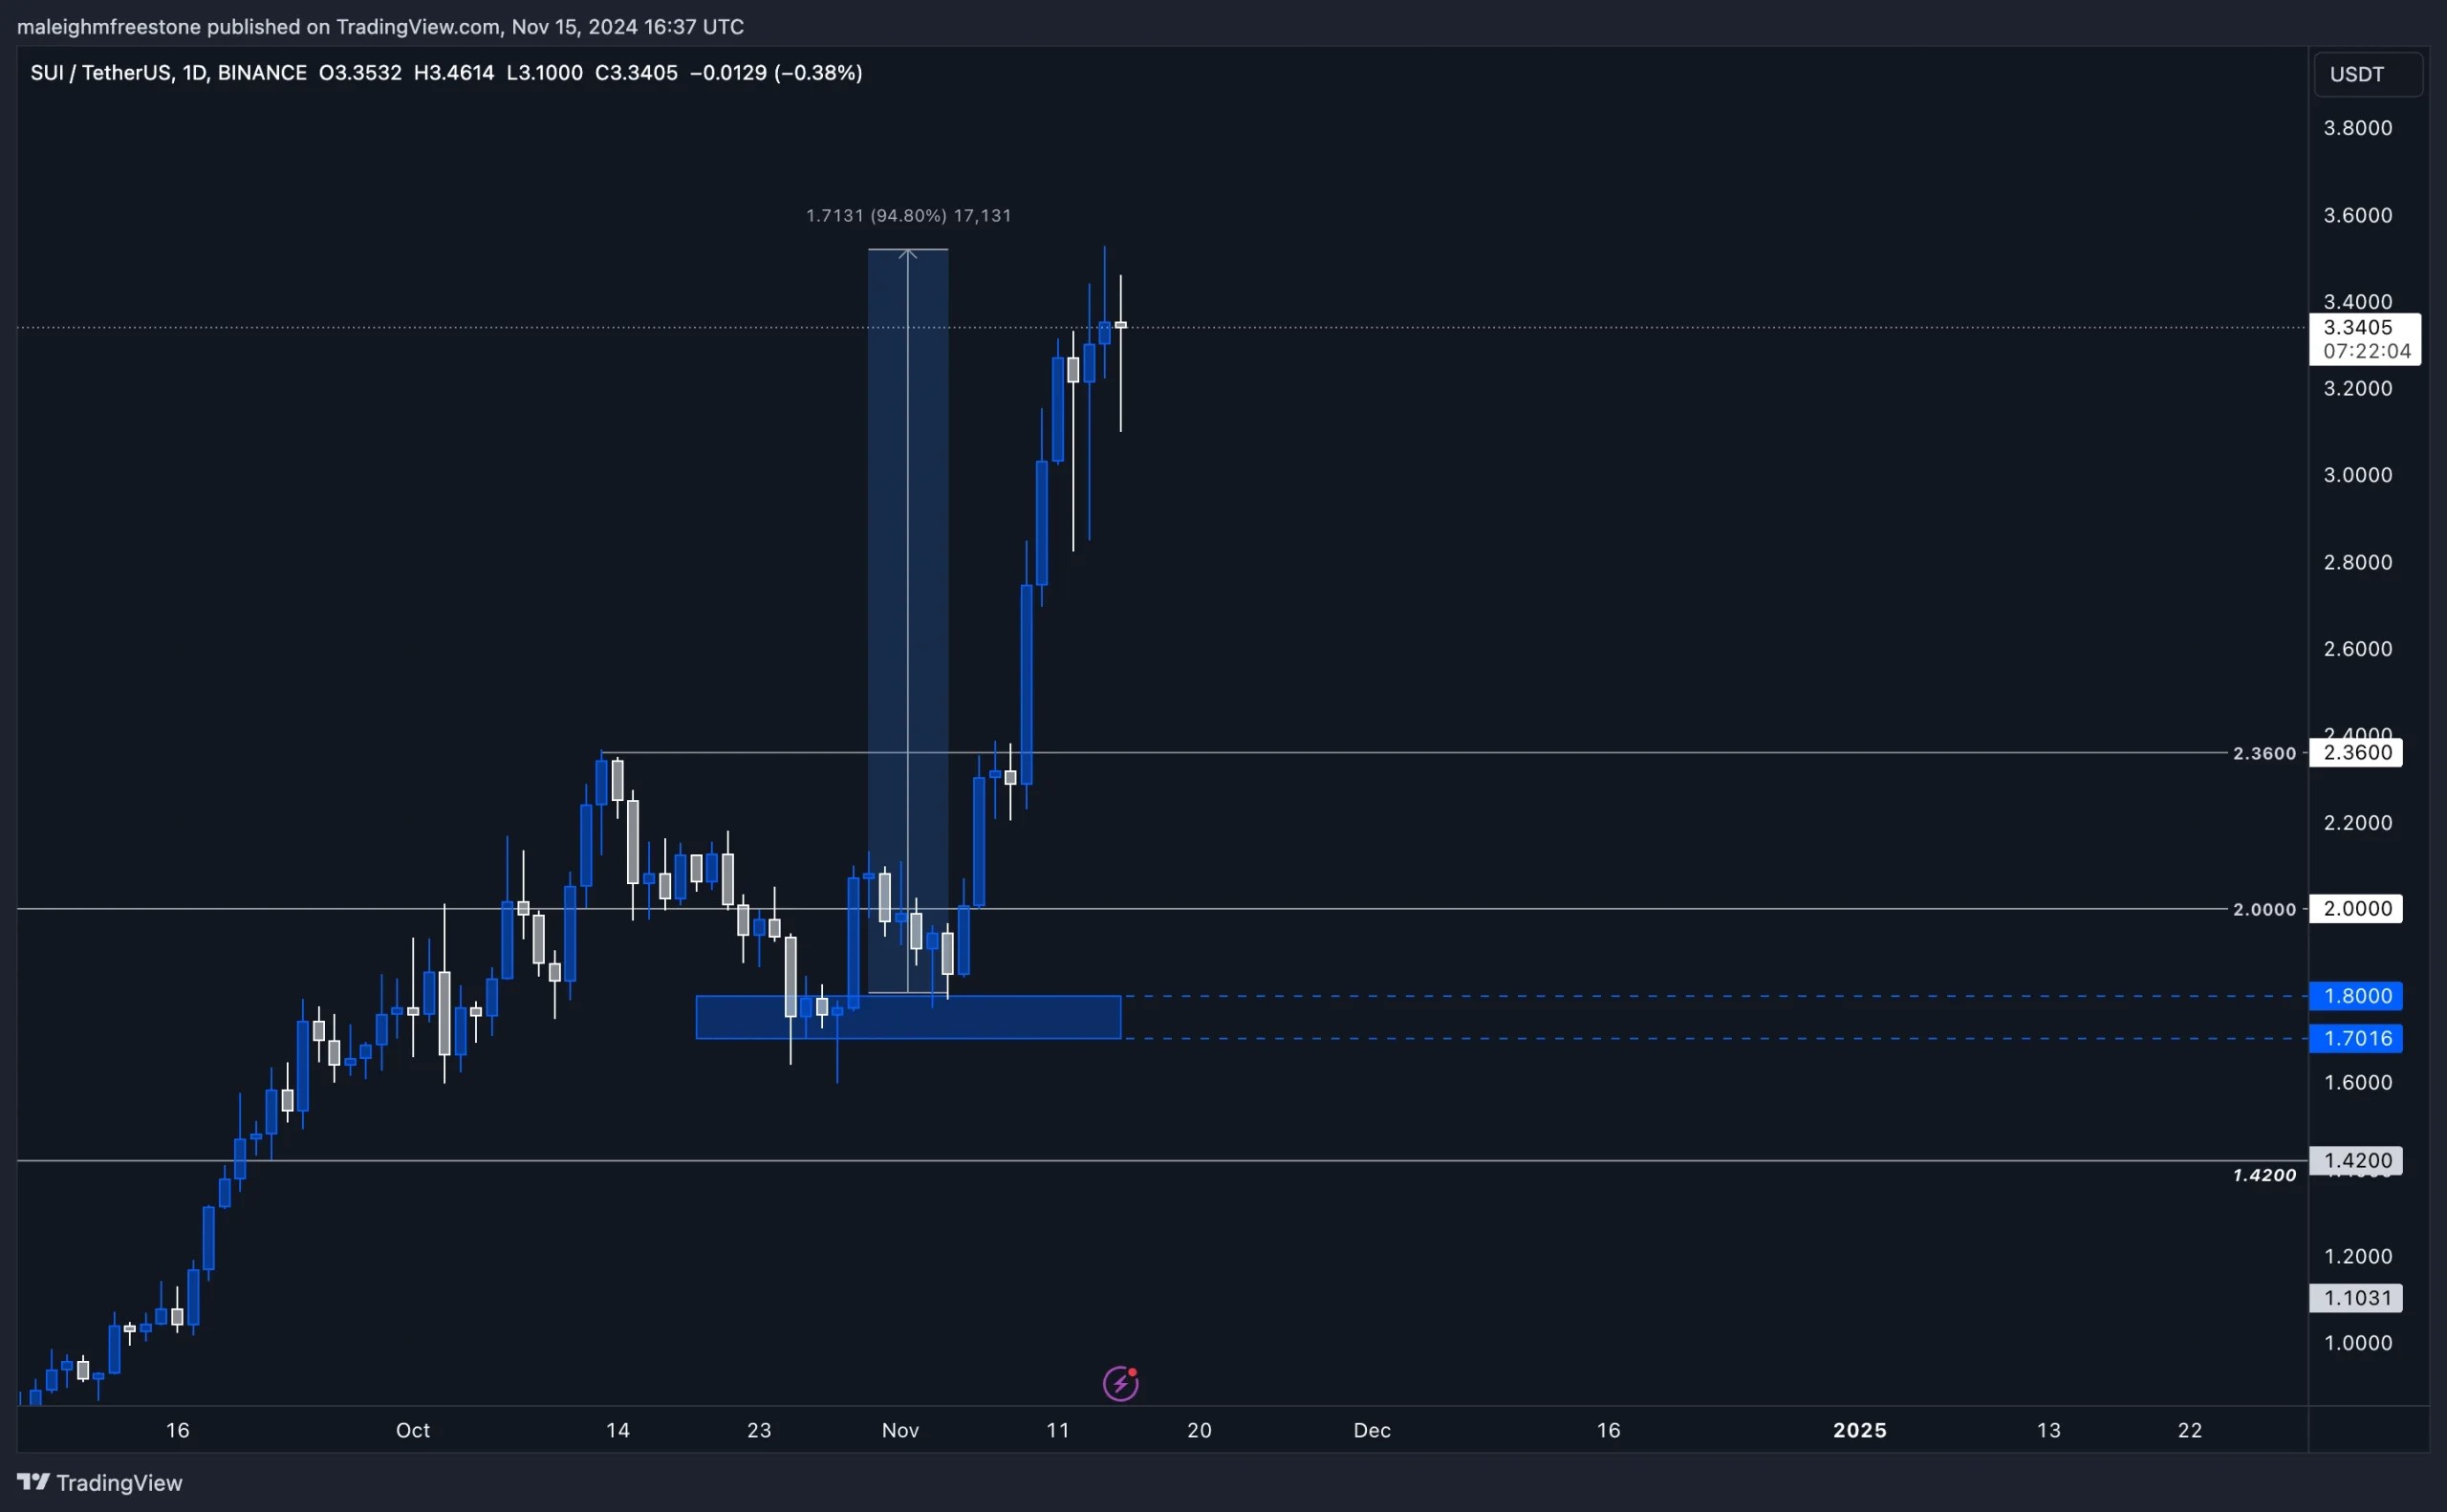
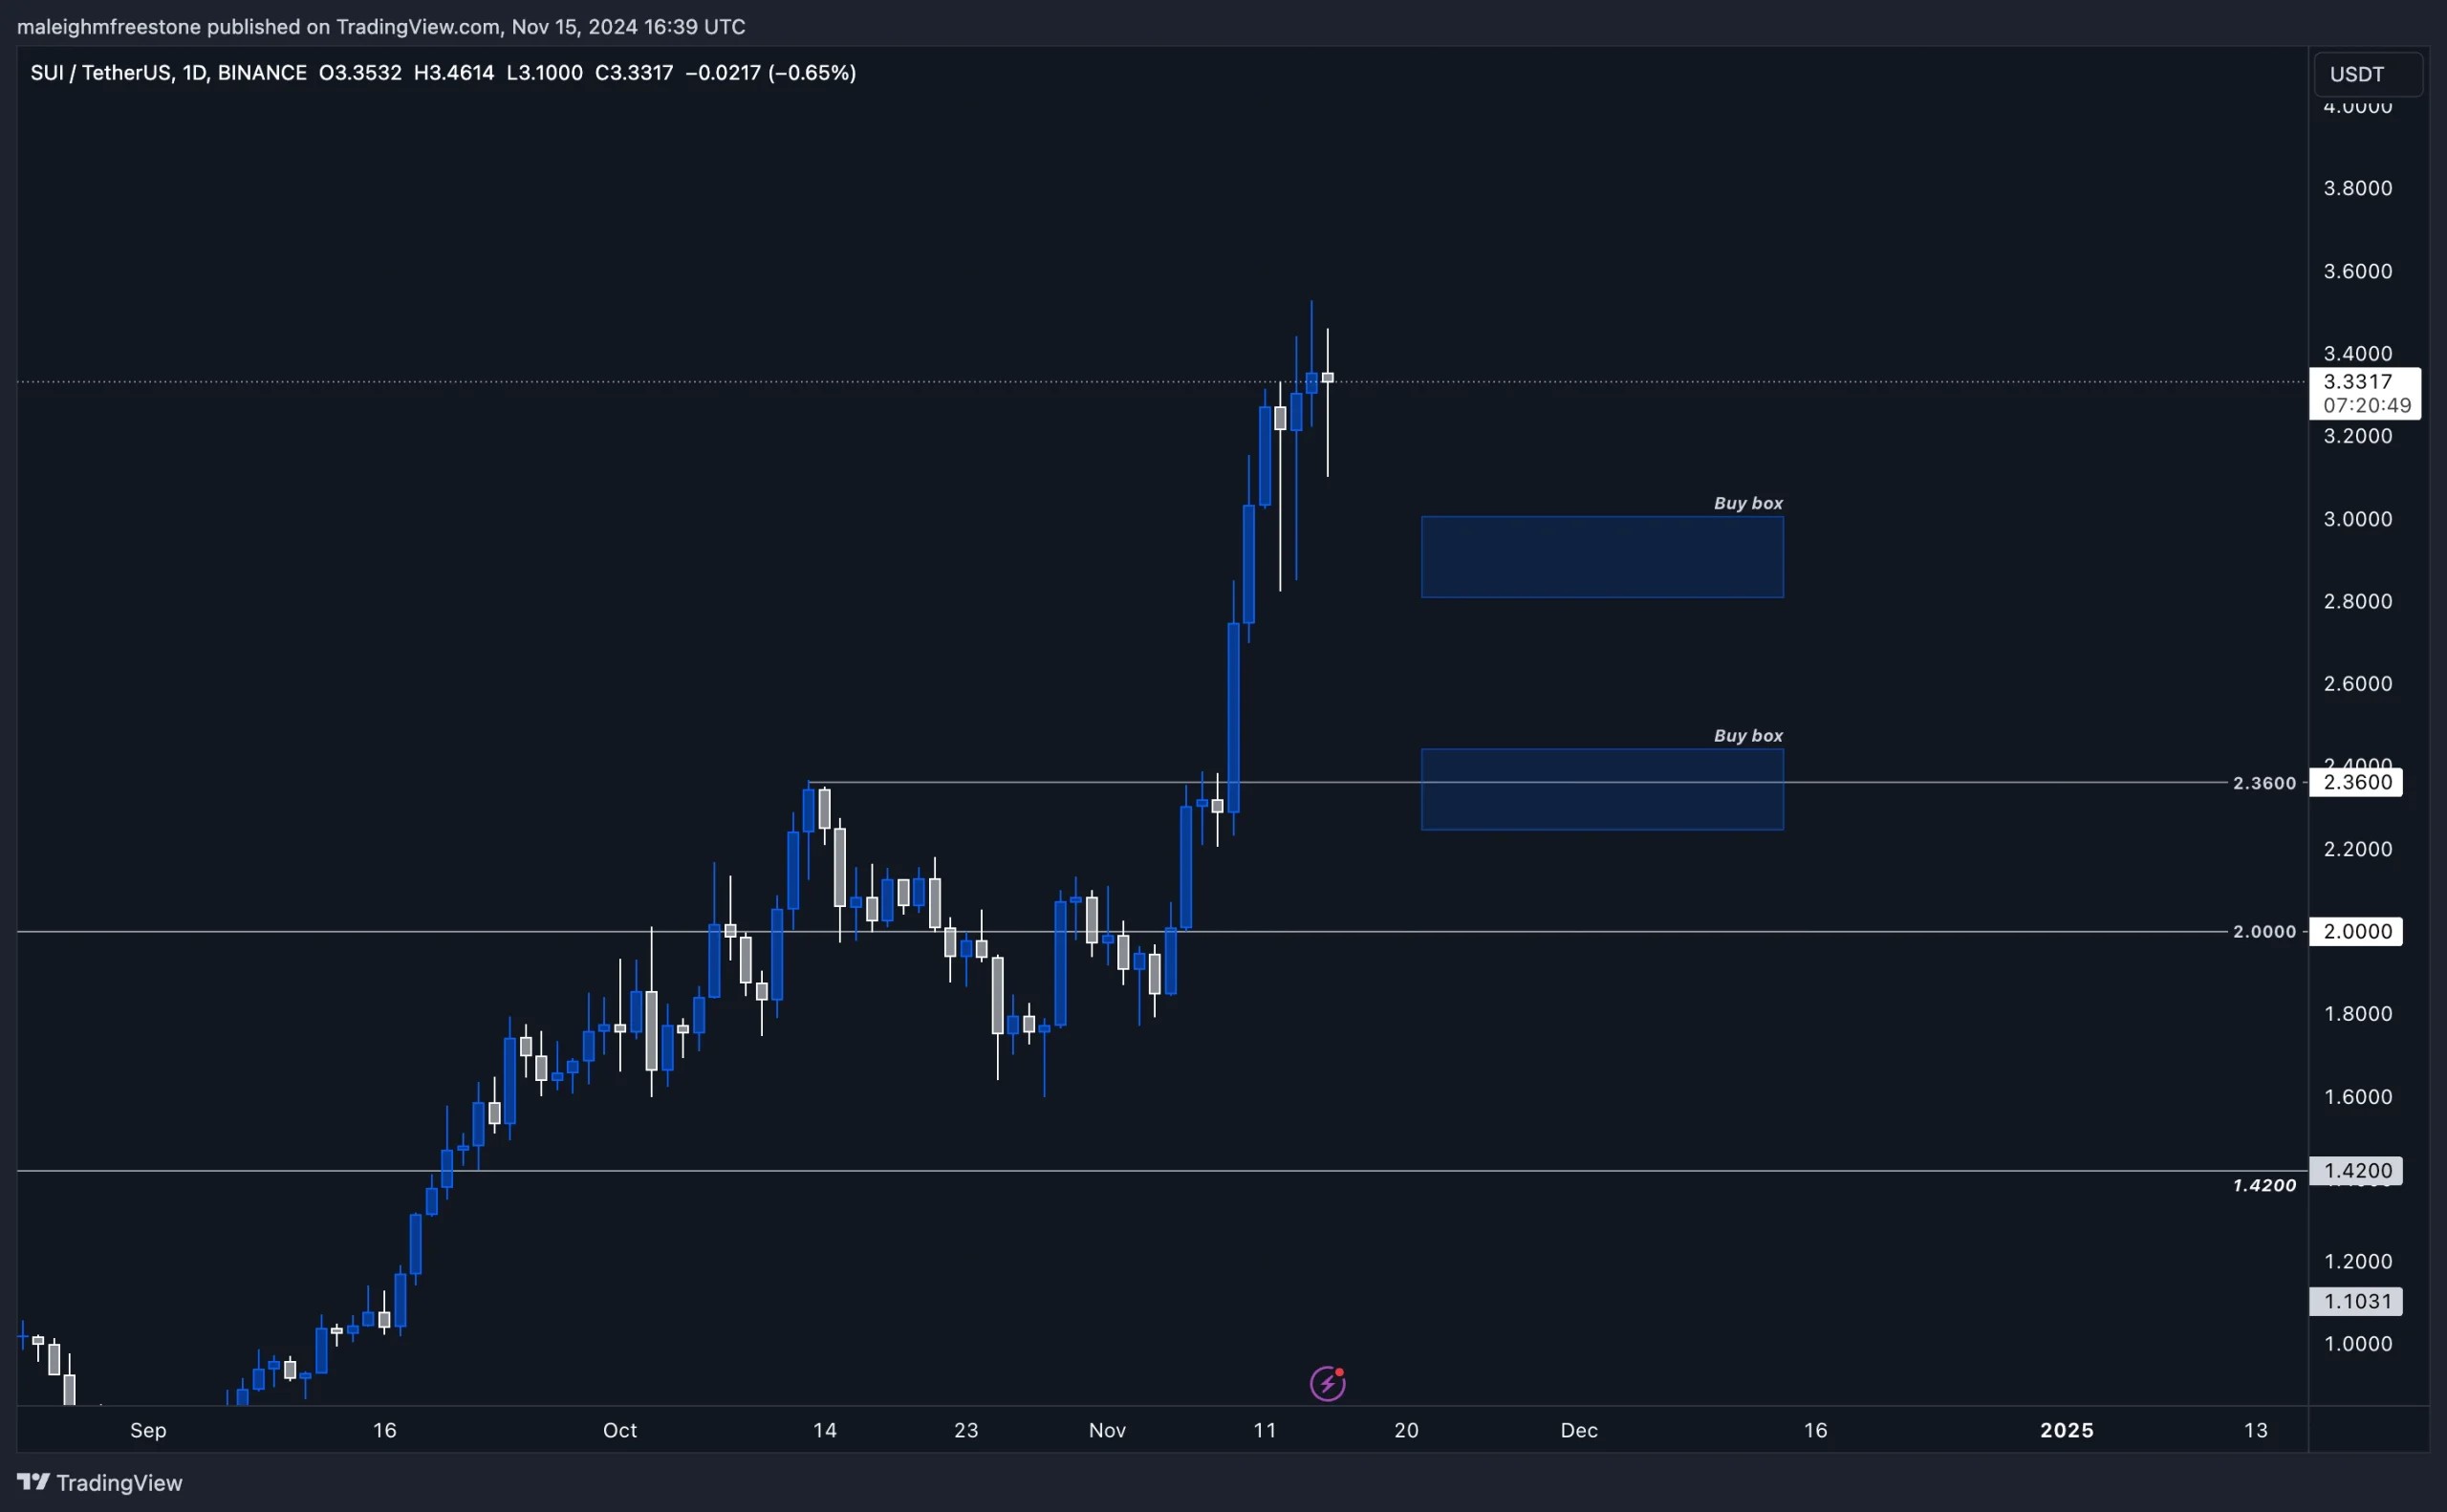
In our last analysis, we pinpointed the 1.8 level as a key support zone for SUI, and the market played out exactly as we anticipated. SUI dipped right into that level, confirmed it with a strong retest, and has since moved 95% to the upside. This is a perfect example of the accuracy we aim for in our setups, proving once again that these levels were spot-on.If you've been following along and positioned yourself within this range, you'd be sitting on solid gains right now. Moving forward, we're eyeing a short-term support zone around the 2.8 to 3.0 area. This level could provide a solid entry for those looking to accumulate, though we should also prepare for the possibility of a pullback to around 2.36. This range will act as near-term support while we continue monitoring for further upside as the trend unfolds.
Playbook & hypothesis
Objective: Accumulate spot positions at the newly established support zones with a focus on capitalizing on any pullbacks for re-entries.- Spot accumulation zone: Look to build positions between $2.8 and $3.0 if SUI consolidates around this area. This level aligns with recent price action and serves as a potential short-term base.
- Potential retest: If we see a pullback, the 2.36 level may provide a secondary entry point, reinforcing the broader bullish structure while preparing for market fluctuations.
- Upside target: Should SUI hold these levels, a continuation of the $3+ area will remain on the cards, with a potential further push if the broader market sees an uptick in altcoin bids.
Key levels
- $2.8 - $3.0: Short-term accumulation zone and current support range.
- $2.36: Backup support if a minor pullback occurs.
- $1.8: Confirmed floor and previous breakout level, underpinning the recent rally.
Cryptonary's take
Our initial setup for SUI was spot on, with the 1.8 level delivering exactly as anticipated. SUI's recent 95% rally from this support zone highlights the strong community backing and demand behind this asset, making it a top performer in recent months.Although it's not part of our core picks, SUI's consistent respect for key levels and its impressive performance make it one to watch. If SUI continues to hold above these support zones, particularly around the $2.8 - $3.0 area, further strength is likely. For those interested in building exposure, focusing on spot accumulation within this range could be a well-timed move, setting up potential gains as we progress further into the cycle.
Recommended from Cryptonary


