Save 23% ($351) & Get a Free 1-1 Call with our Team ⏰ : 0d 2h 59m 43s
PEPE price prediction
Pepe price prediction is driven by the viral nature of its meme-based community, which helped it reach an all-time high of $0.0002639. As a popular meme coin, its price is highly speculative but also full of potential for explosive moves. Stay updated with the latest Pepe price insights to navigate its volatility.

We at Cryptonary provide you with the most accurate price prediction for all sorts of coins. You can also request an on-demand PEPE price prediction by joining our Discord Community.
Our Price Prediction Model
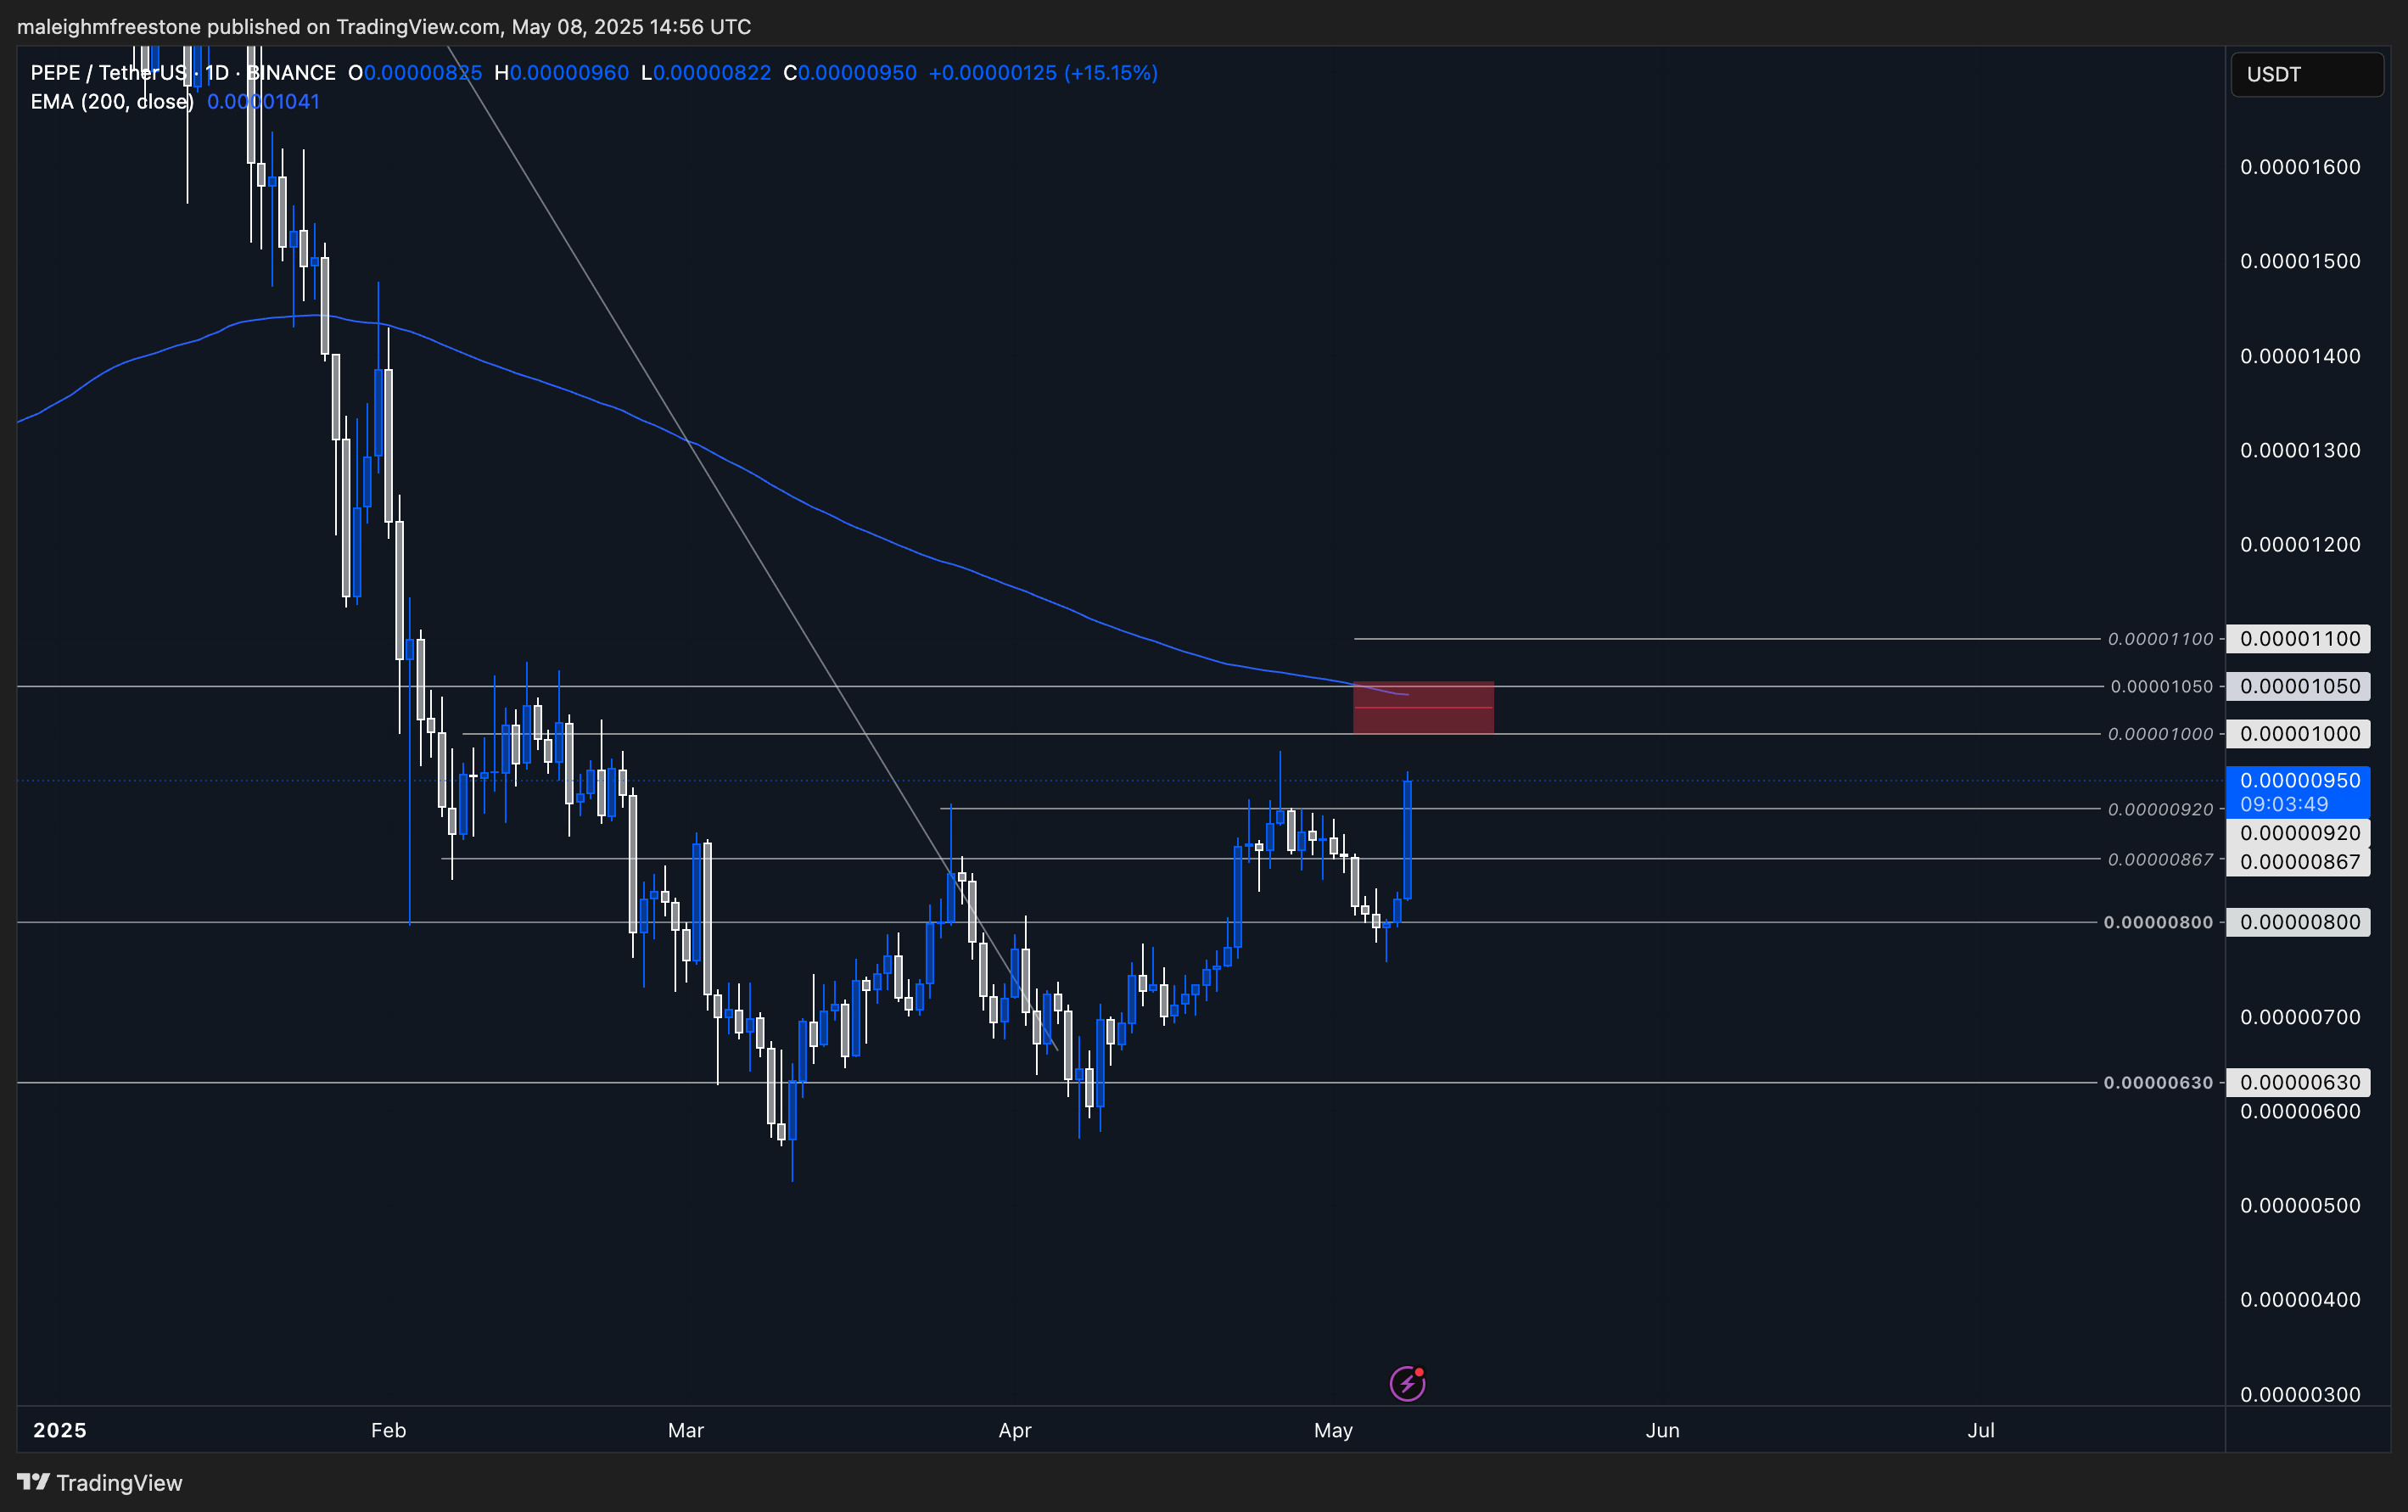


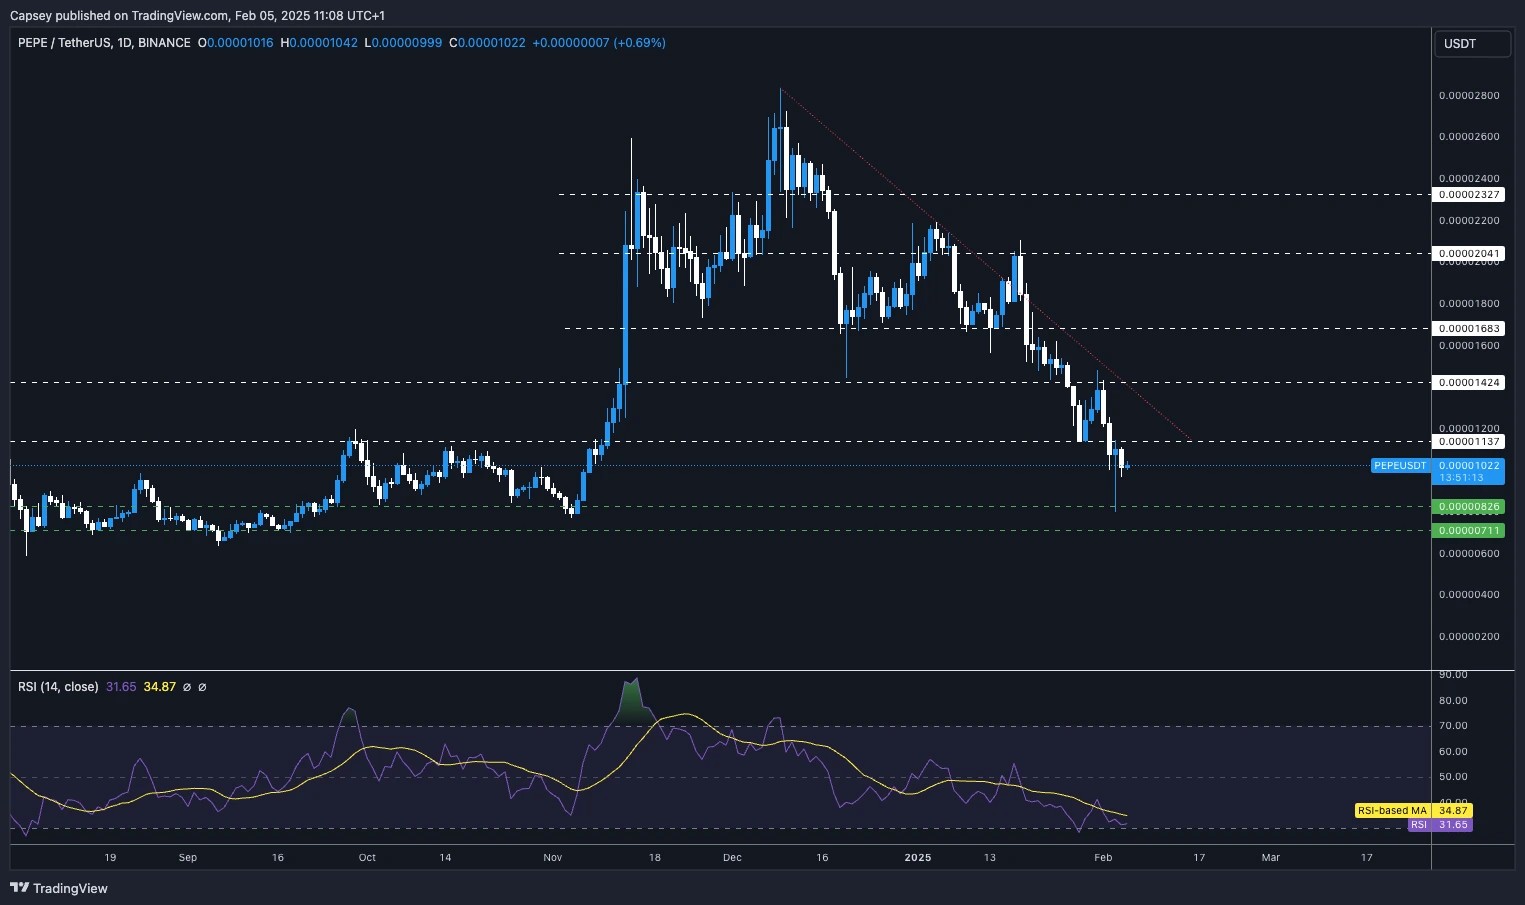

PEPE consolidates above key support levels after a major rally
22 November 2024Overview
$PEPE has maintained strong momentum after its Coinbase listing and a significant rally. It has now entered a consolidation phase, trading sideways above its previous all-time high of $0.0000172, which was set in May 2024. Currently trading at $0.00002, $PEPE has been holding key support levels, showing potential for another move higher.One-hour time frame analysis
● Key levels:- Demand zone: The updated one-hour demand zone ranges from $0.0000187 to $0.0000177. $PEPE has been taking consistent support from this zone for over a week.
- Previous all-time high support: The $0.0000172 level, the previous all-time high, is just below the current demand zone and serves as a secondary support.
- 200 EMA: The one-hour 200 EMA is positioned at $0.0000194, acting as an additional dynamic support.
- $PEPE recently broke out of a short-term downtrend trendline (yellow) in the one-hour time frame, formed after its new all-time high of $0.0000256. This breakout indicates potential for a continuation of its bullish momentum.
- The price is currently holding above both the trendline and the 200 EMA, consolidating within a tight range.
- Bullish continuation: If $PEPE sustains above the one-hour demand zone and breaks above $0.0000215, it could challenge its all-time high of $0.0000256 again in the short term.
- Liquidity grab: If the price dips below the demand zone for a quick liquidity grab, the $0.0000172 support and the previous all-time high could act as a springboard for a recovery.
Cryptonary's take
$PEPE remains a standout performer in the current memecoin cycle, consolidating after a remarkable rally. Its ability to hold the one-hour demand zone and the 200 EMA adds credibility to the bullish structure. While the consolidation phase continues, maintaining support at $0.0000187 and sustaining above the previous all-time high at $0.0000172 is crucial for further upside momentum.On the flip side, a break below these levels might lead to a deeper pullback. However, the overall structure remains positive, with $PEPE showing resilience and potential for further gains in the coming sessions.
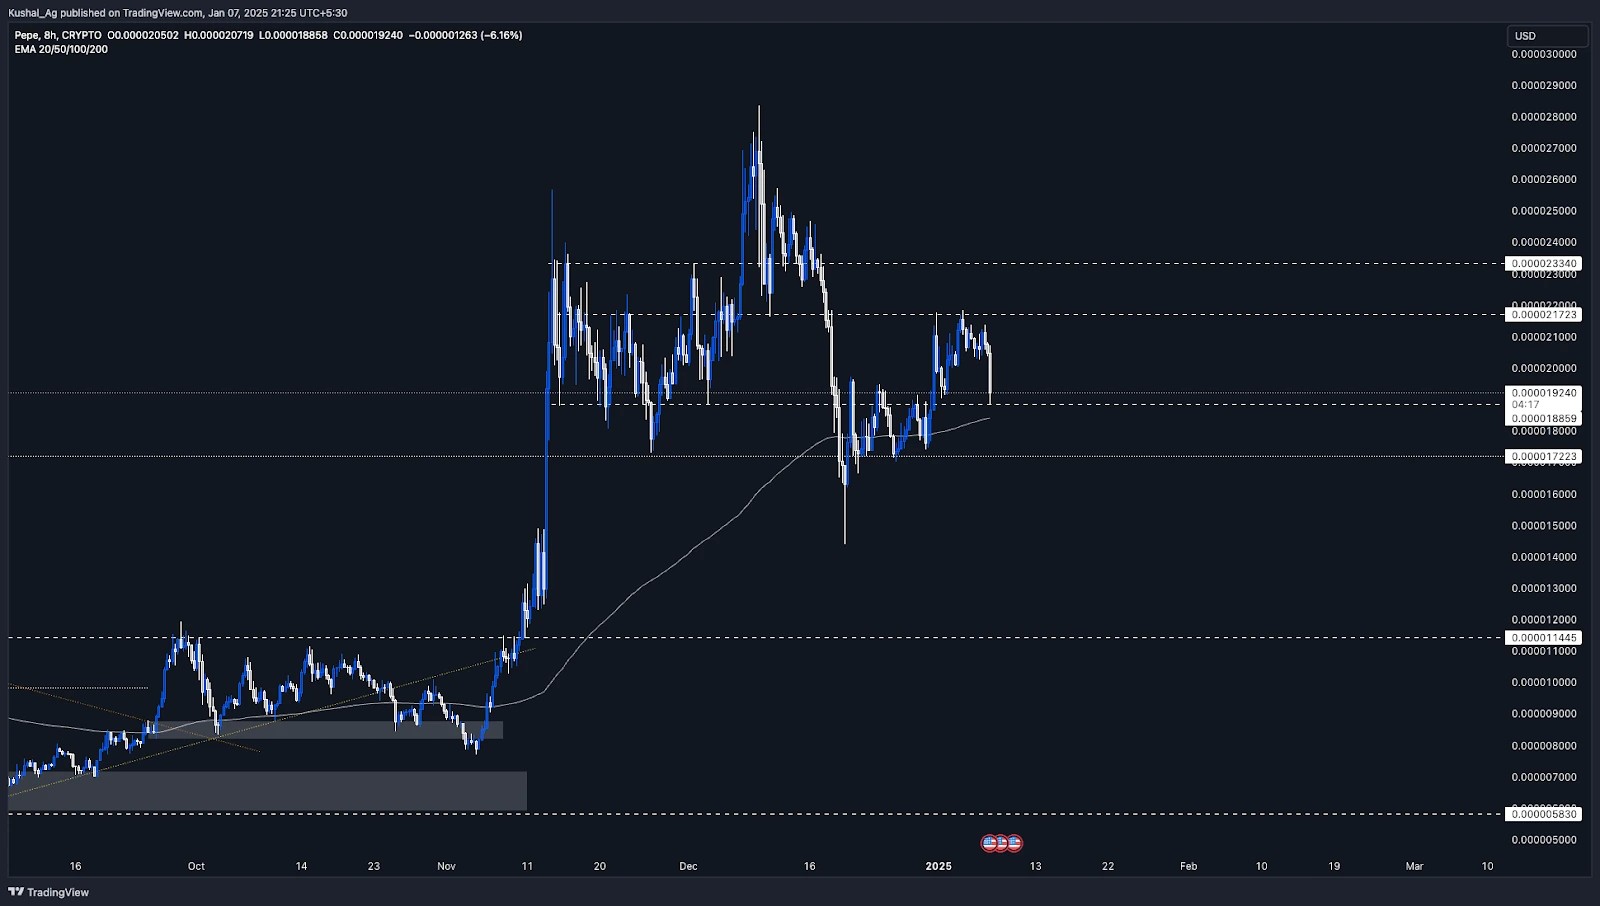
PEPE's rise: Coinbase listing, Market milestones & technical analysis
15 November 2024Overview
$PEPE has taken the crypto world by storm, recently achieving a major milestone with its listing on Coinbase, one of the most prominent cryptocurrency exchanges. This development solidifies $PEPE's status as a leading memecoin, particularly in the ongoing memecoin supercycle. It has now climbed to the 15th spot in cryptocurrency market capitalization, surpassing Bitcoin Cash, and is currently valued at over $9 billion.Over the past week, $PEPE has delivered a staggering 105% gain, demonstrating a strong performance in the Ethereum memecoin space and reinforcing its position as a top asset in the current market cycle.
Daily time frame analysis
On the daily chart, $PEPE recently broke out spectacularly following the Coinbase listing announcement, surging 50% on the news. The 200 EMA had been a crucial support level, complemented by the daily demand zone between $0.0000082 - $0.0000088, which had been highlighted in previous analyses.Despite a brief breakdown below the 200 EMA and the demand zone, $PEPE reversed hard after forming a local bottom at $0.0000077, a clear signal of strong buyer interest. Since reclaiming the $0.0000010 level, $PEPE has gone parabolic, delivering a remarkable 230% rally from its early November low.
Currently trading at $0.000021, $PEPE appears to be stabilising after its recent explosive move. Immediate resistance lies at its ath now $0.0000256, with further upside potential if this level is broken. On the downside, its previous ath at $0.000017 acts as a strong support if PEPE takes a pullback.

Want insights into PEPE price prediction? Read our full analysis to see where PEPE is heading next!
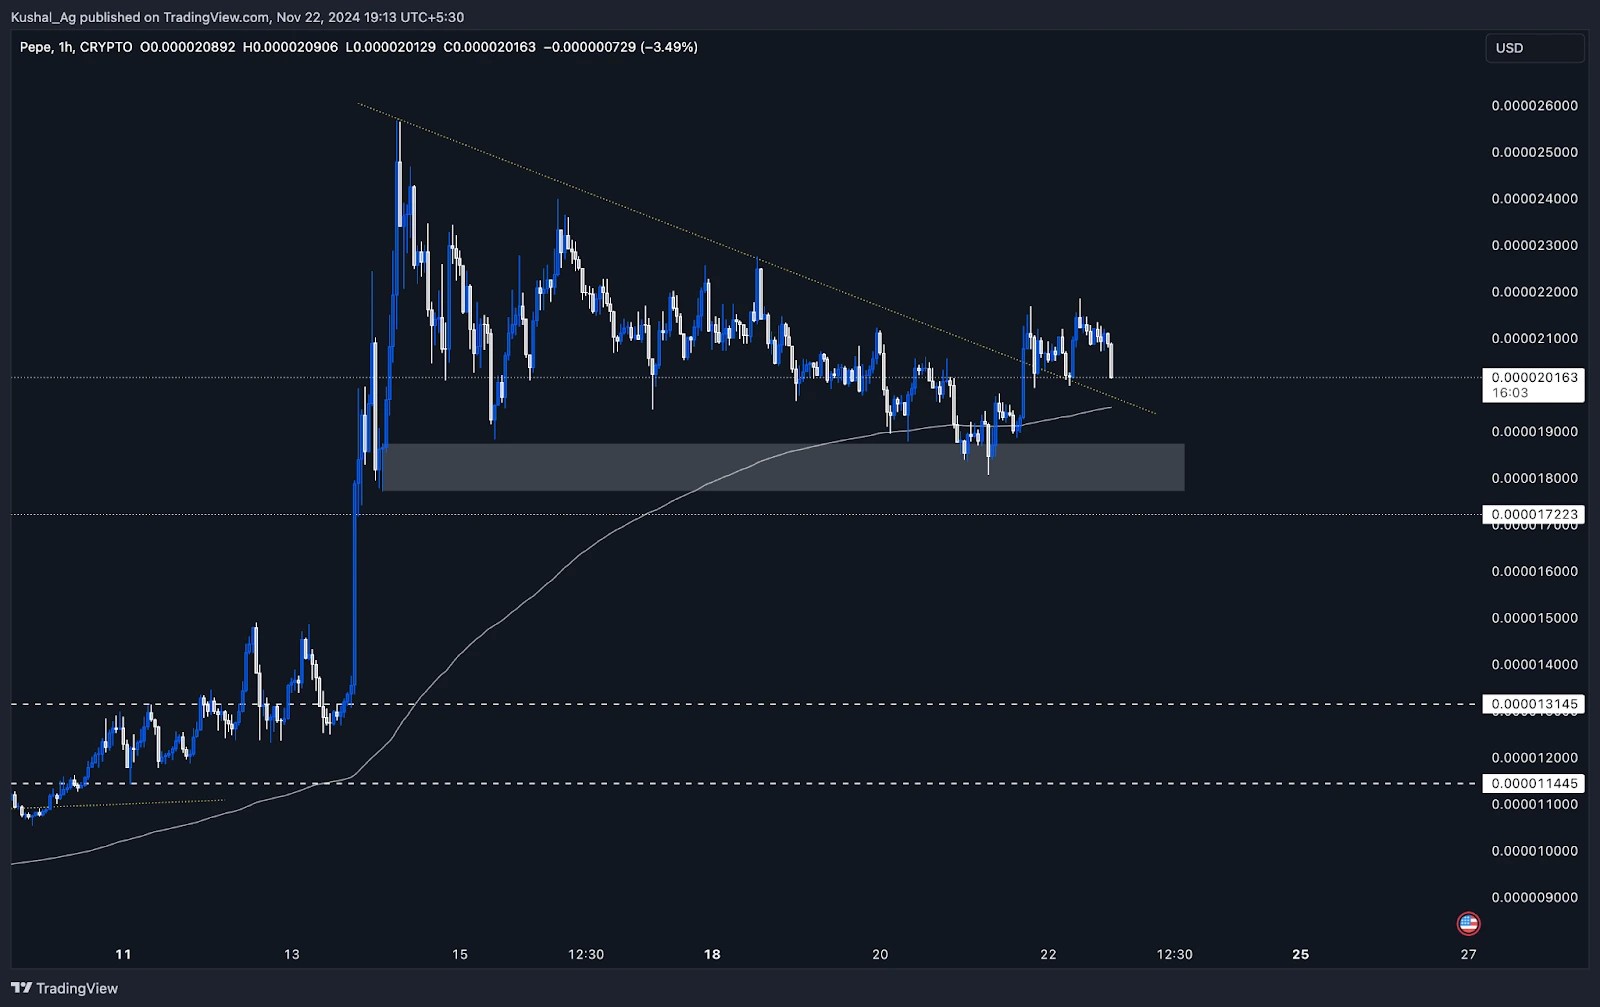
2-hour time frame analysis
Zooming into the 2-hour chart, $PEPE exhibits bullish short-term price action. The asset has consistently held the 20 EMA as support, forming a solid base around this level. Additionally, $PEPE has created a demand zone on the 2-hour time frame, ranging from $0.000019 - $0.000177, and has mitigated it with a wick and taken strong reversal.Significantly, $PEPE has broken out of a short-term downtrend trendline and even retested it successfully, indicating a bullish setup for further upward movement. With the wider market aligning, $PEPE is well-positioned to attempt another push higher, potentially targeting the $0.0000024 resistance level in the near term.
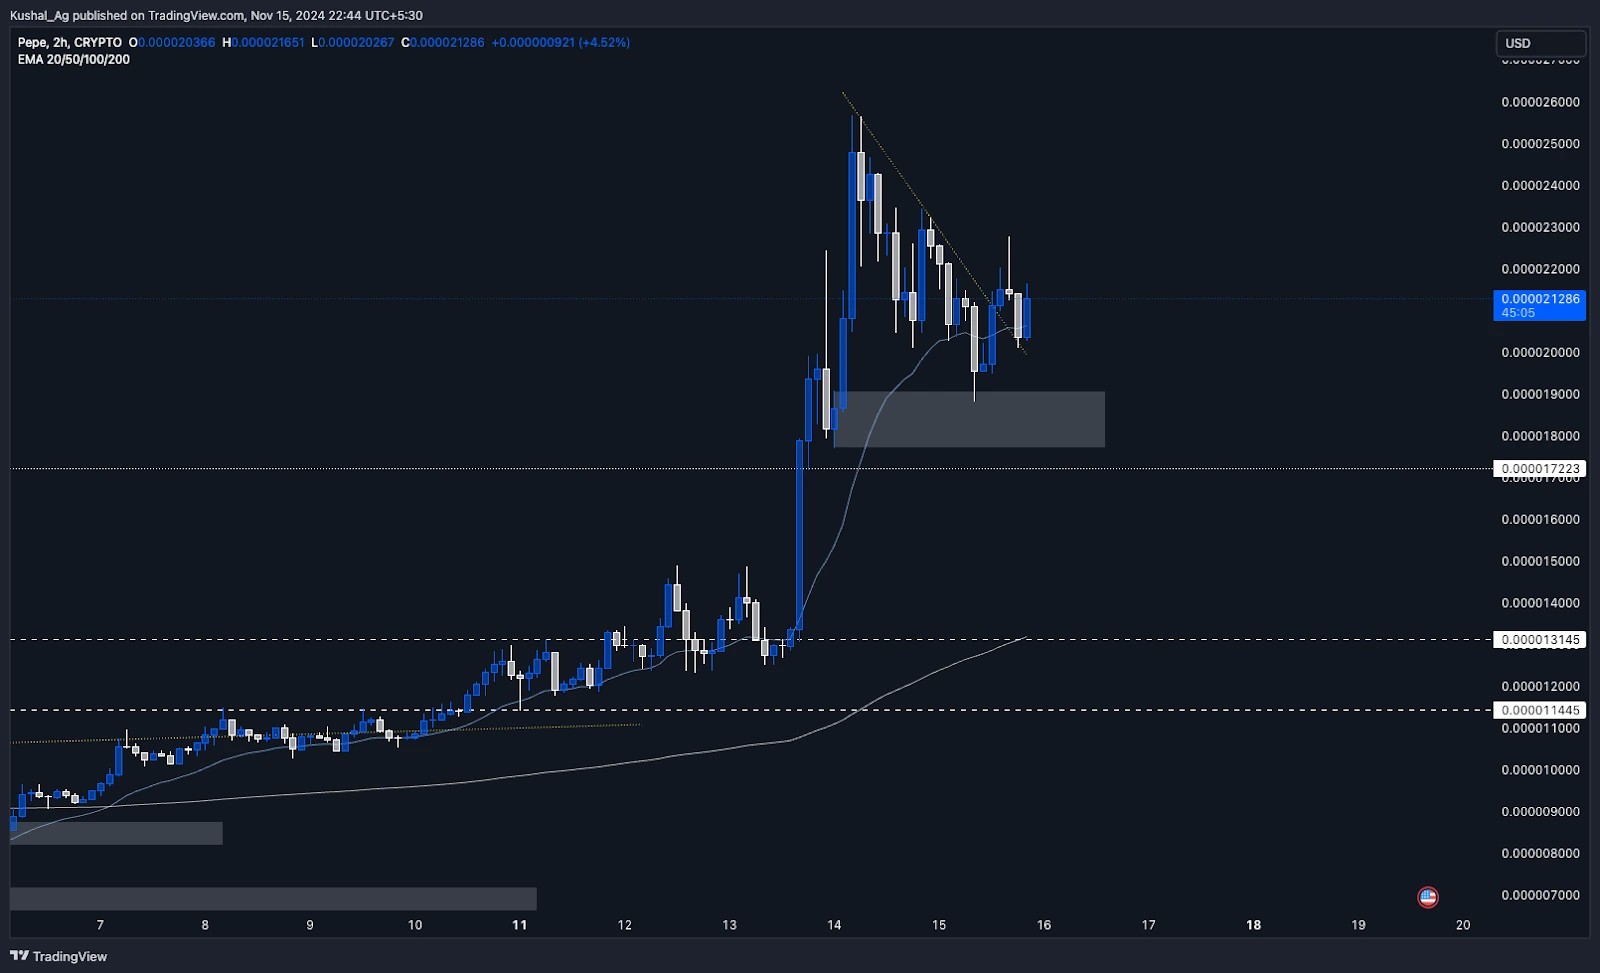
Cryptonary's take
$PEPE continues to prove its dominance in the memecoin space, fueled by its Coinbase listing and significant price movements. Technically, it holds critical support levels while showing consistent strength in both the daily and 2-hour time frames. For short-term traders, the breakout above the 2-hour downtrend and the strong support at the 20 EMA and demand zone provide an interesting momentum-based setup. For long-term holders, $PEPE's bullish market structure, reinforced by its market cap milestones, makes it a standout asset in the ongoing memecoin supercycle.That said, memecoins are inherently volatile, and traders should exercise caution by closely monitoring key support zones like the 2-hour demand zone and the previous ATH. The wider market will play a critical role in sustaining $PEPE's momentum, but for now, it remains a top contender in the crypto space.
The memecoin supercycle is rewriting the rules, offering opportunities that could redefine your investment strategy. Discover why this moment is a game-changer for crypto enthusiasts.
Can PEPE reclaim the trendline for the bullish move?
28 October 2024Pepe ($PEPE) remains stable at 200 EMA support, providing a fresh opportunity for upside if the trendline is reclaimed. Discover the key targets and support levels in today’s analysis.
Disclaimer: This is not financial or investment advice. You are responsible for any capital-related decisions you make, and only you are accountable for the results.
Overview
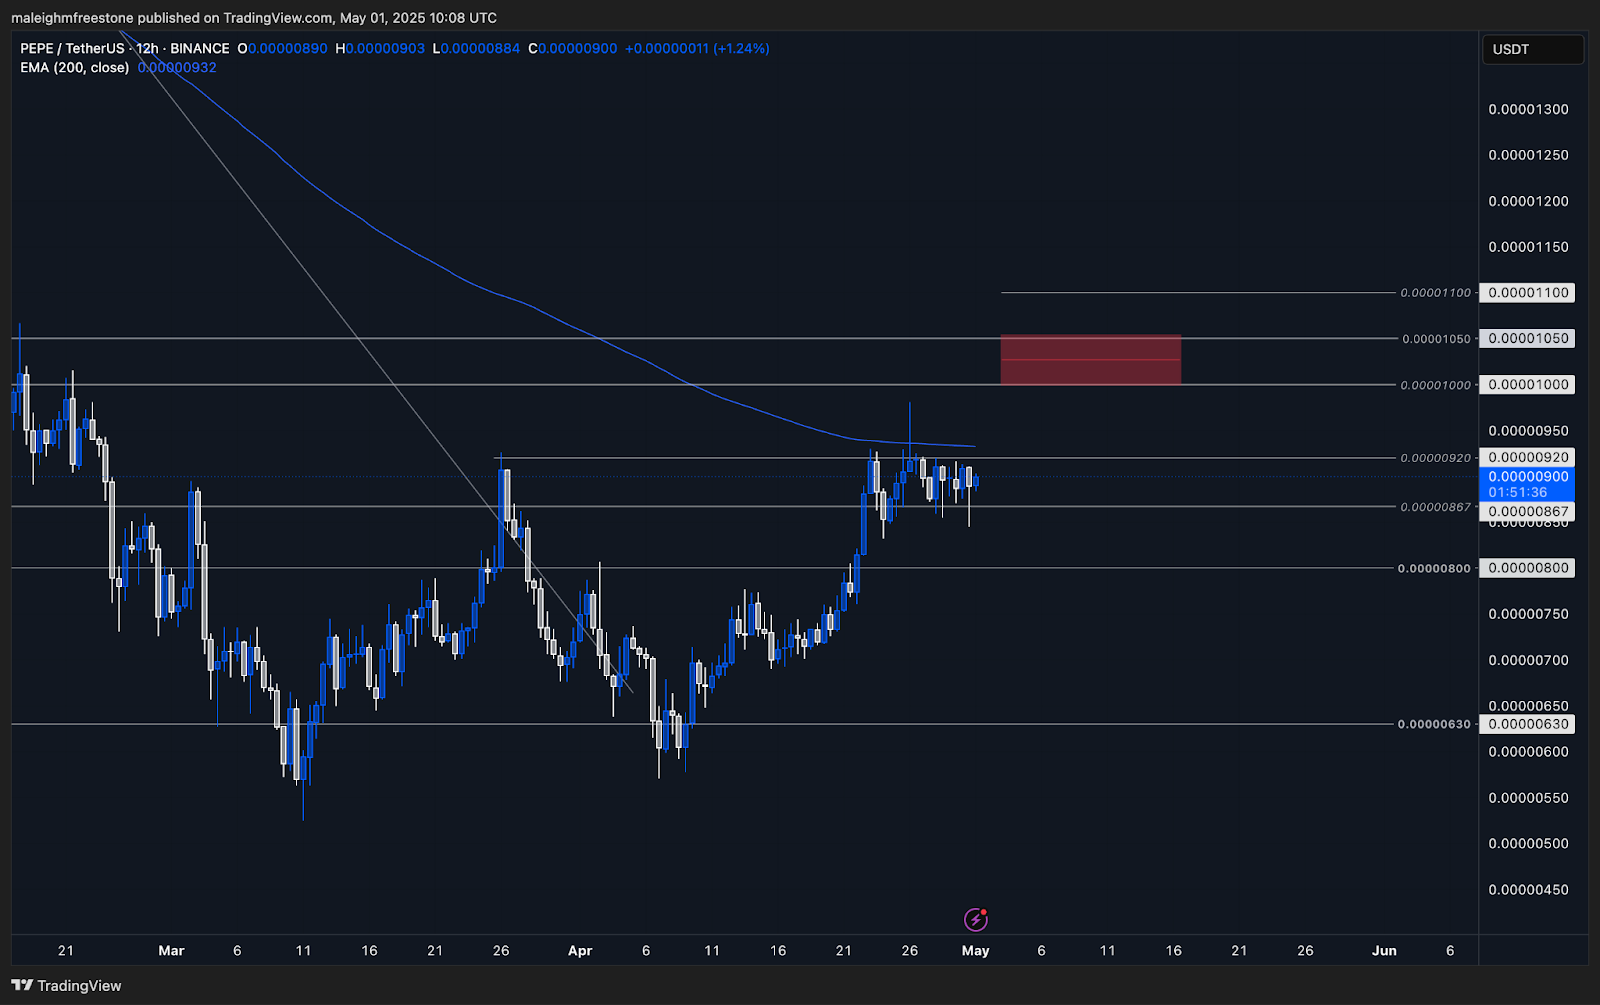
Pepe ($PEPE) has been trading within a critical range over the past week. In our last analysis, we noted that the price was at $0.0000096 and highlighted the potential for a breakdown to the lower demand zone and the 200 EMA on the daily timeframe. This forecast played out as expected, with $PEPE breaking down to touch the $0.00000845 level, perfectly aligning with the daily demand zone (grey box) and the 200 EMA, where it found support.Daily timeframe analysis
Since our last review:- Price Reaction: $PEPE took support exactly at the 200 EMA, trading around $0.00000845 within the daily demand zone marked by the grey box. This confluence of support levels has held up well, preventing further downside.
- Trendline Reversal: The next focus is on whether $PEPE can reclaim the yellow trendline above, which it previously lost. Reclaiming this trendline is essential for shifting momentum back to the upside. If successful, it could signal a push higher, potentially breaking the $0.000011 resistance level.
- Resistance Levels: If $PEPE manages to break above the trendline and sustain the upward momentum, the next target on the daily timeframe would be the $0.000013 level.
- Support Levels: If the 200 EMA support breaks down, the next significant support zone for $PEPE is the lower macro support, marked by another daily demand zone. This area will be crucial for maintaining the overall bullish structure.

Cryptonary's take
The analysis from last week played out perfectly, with $PEPE reacting strongly to the expected levels. The 200 EMA and daily demand zone have proven to be reliable supports, but for a sustained move higher, $PEPE needs to reclaim the yellow trendline.It's currently trading at a discounted level, providing a fresh opportunity for those considering a position. However, monitoring the price action around these key levels is essential before expecting any further upside.
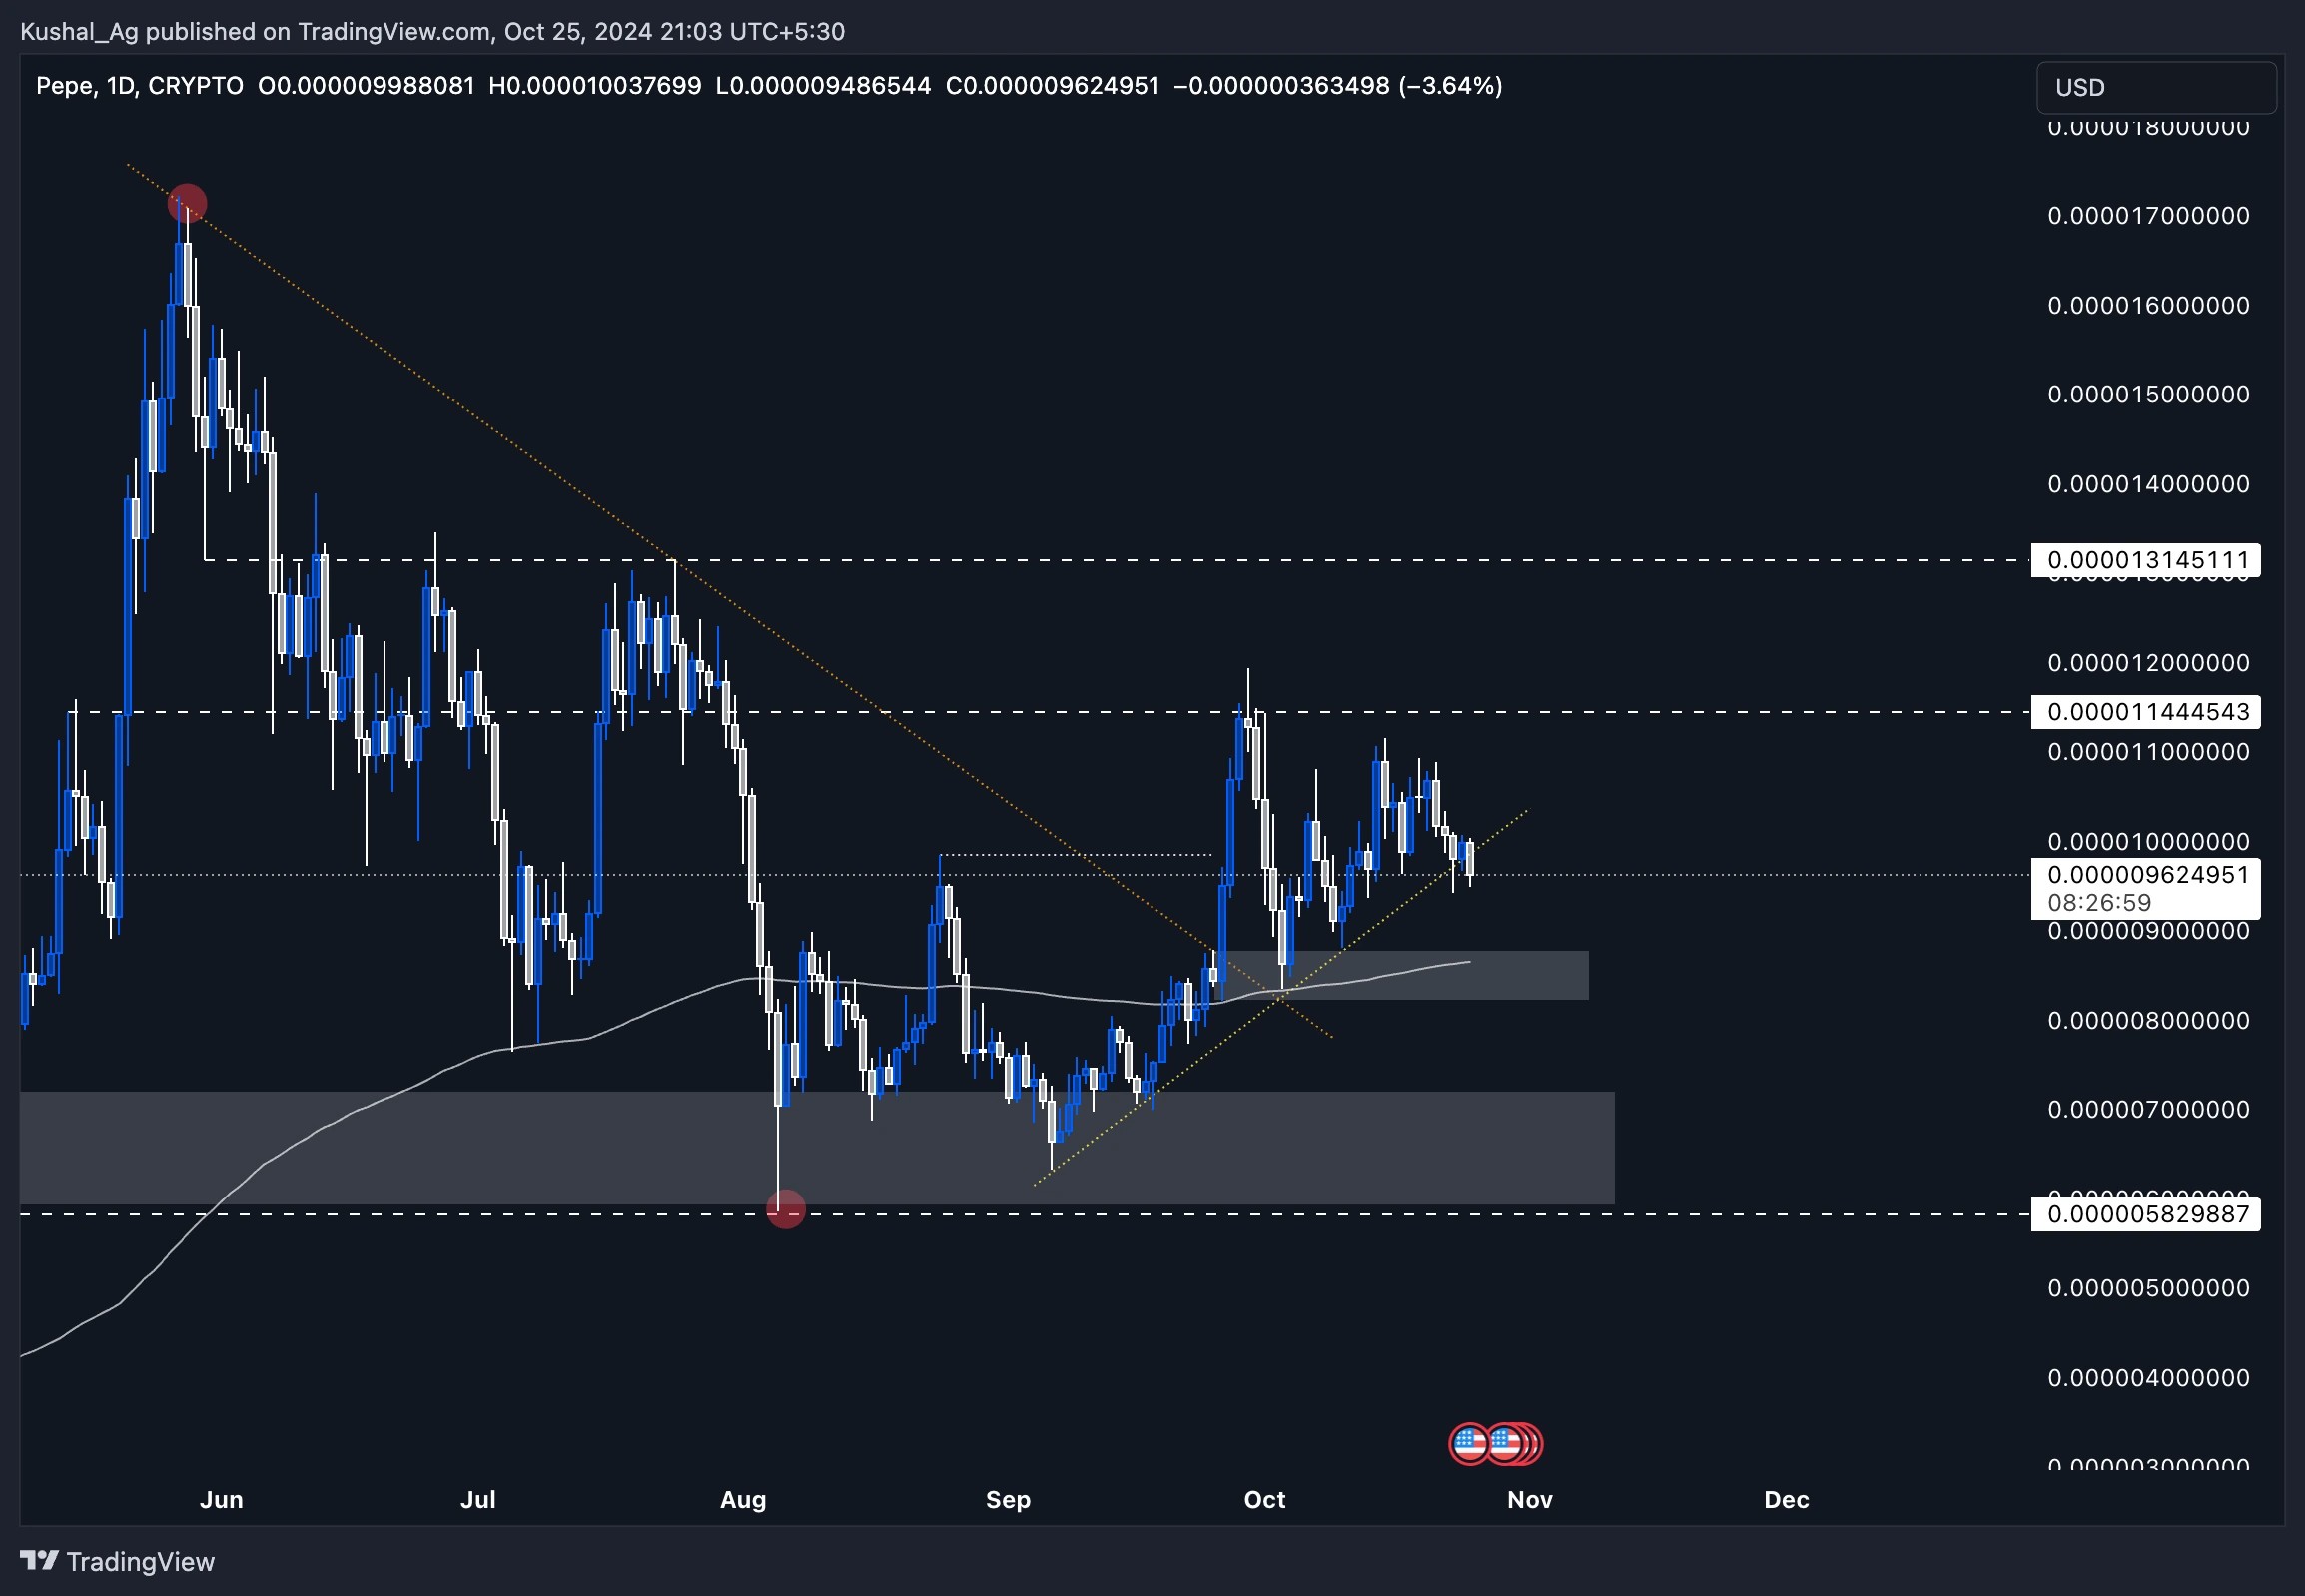
Will a $0.0000114 rejection lead to a dip?
25 October 2024PEPE consolidates near $0.0000096 with resistance at $0.0000114. Will it hold the trendline support or test deeper levels?
Overview
Pepe ($PEPE) remains one of the more active meme coins in terms of both trading volume and market interest. As the broader market consolidates, $PEPE also appears to be in a consolidation phase, forming a tight price structure. Currently trading around $0.0000096, the price is consolidating after rejecting the $0.0000114 resistance level, which has kept the asset in a range for the past few weeks.Daily timeframe analysis
During the daily timeframe, we can observe that Pepe has maintained support above a newly marked yellow-dotted trendline. This trendline appears to be a critical level where many traders are taking long positions, making it a potential liquidity zone.Typically, when an asset relies on such trendlines for extended periods, we can sometimes see a quick breakdown for a "liquidity grab," where the price briefly dips to capture stop-losses, allowing larger traders to accumulate before potentially reclaiming the trend.
Key observations
- Daily demand zone: The primary daily demand zone sits between $0.0000082 and $0.0000087, which also aligns with the 200 EMA on the daily at $0.0000086. This confluence of the 200 EMA and demand zone creates a strong support area.
- Secondary demand zone: A larger daily demand zone extends from $0.000006 to $0.0000072. This zone represents deeper support should the price break below the initial demand area.
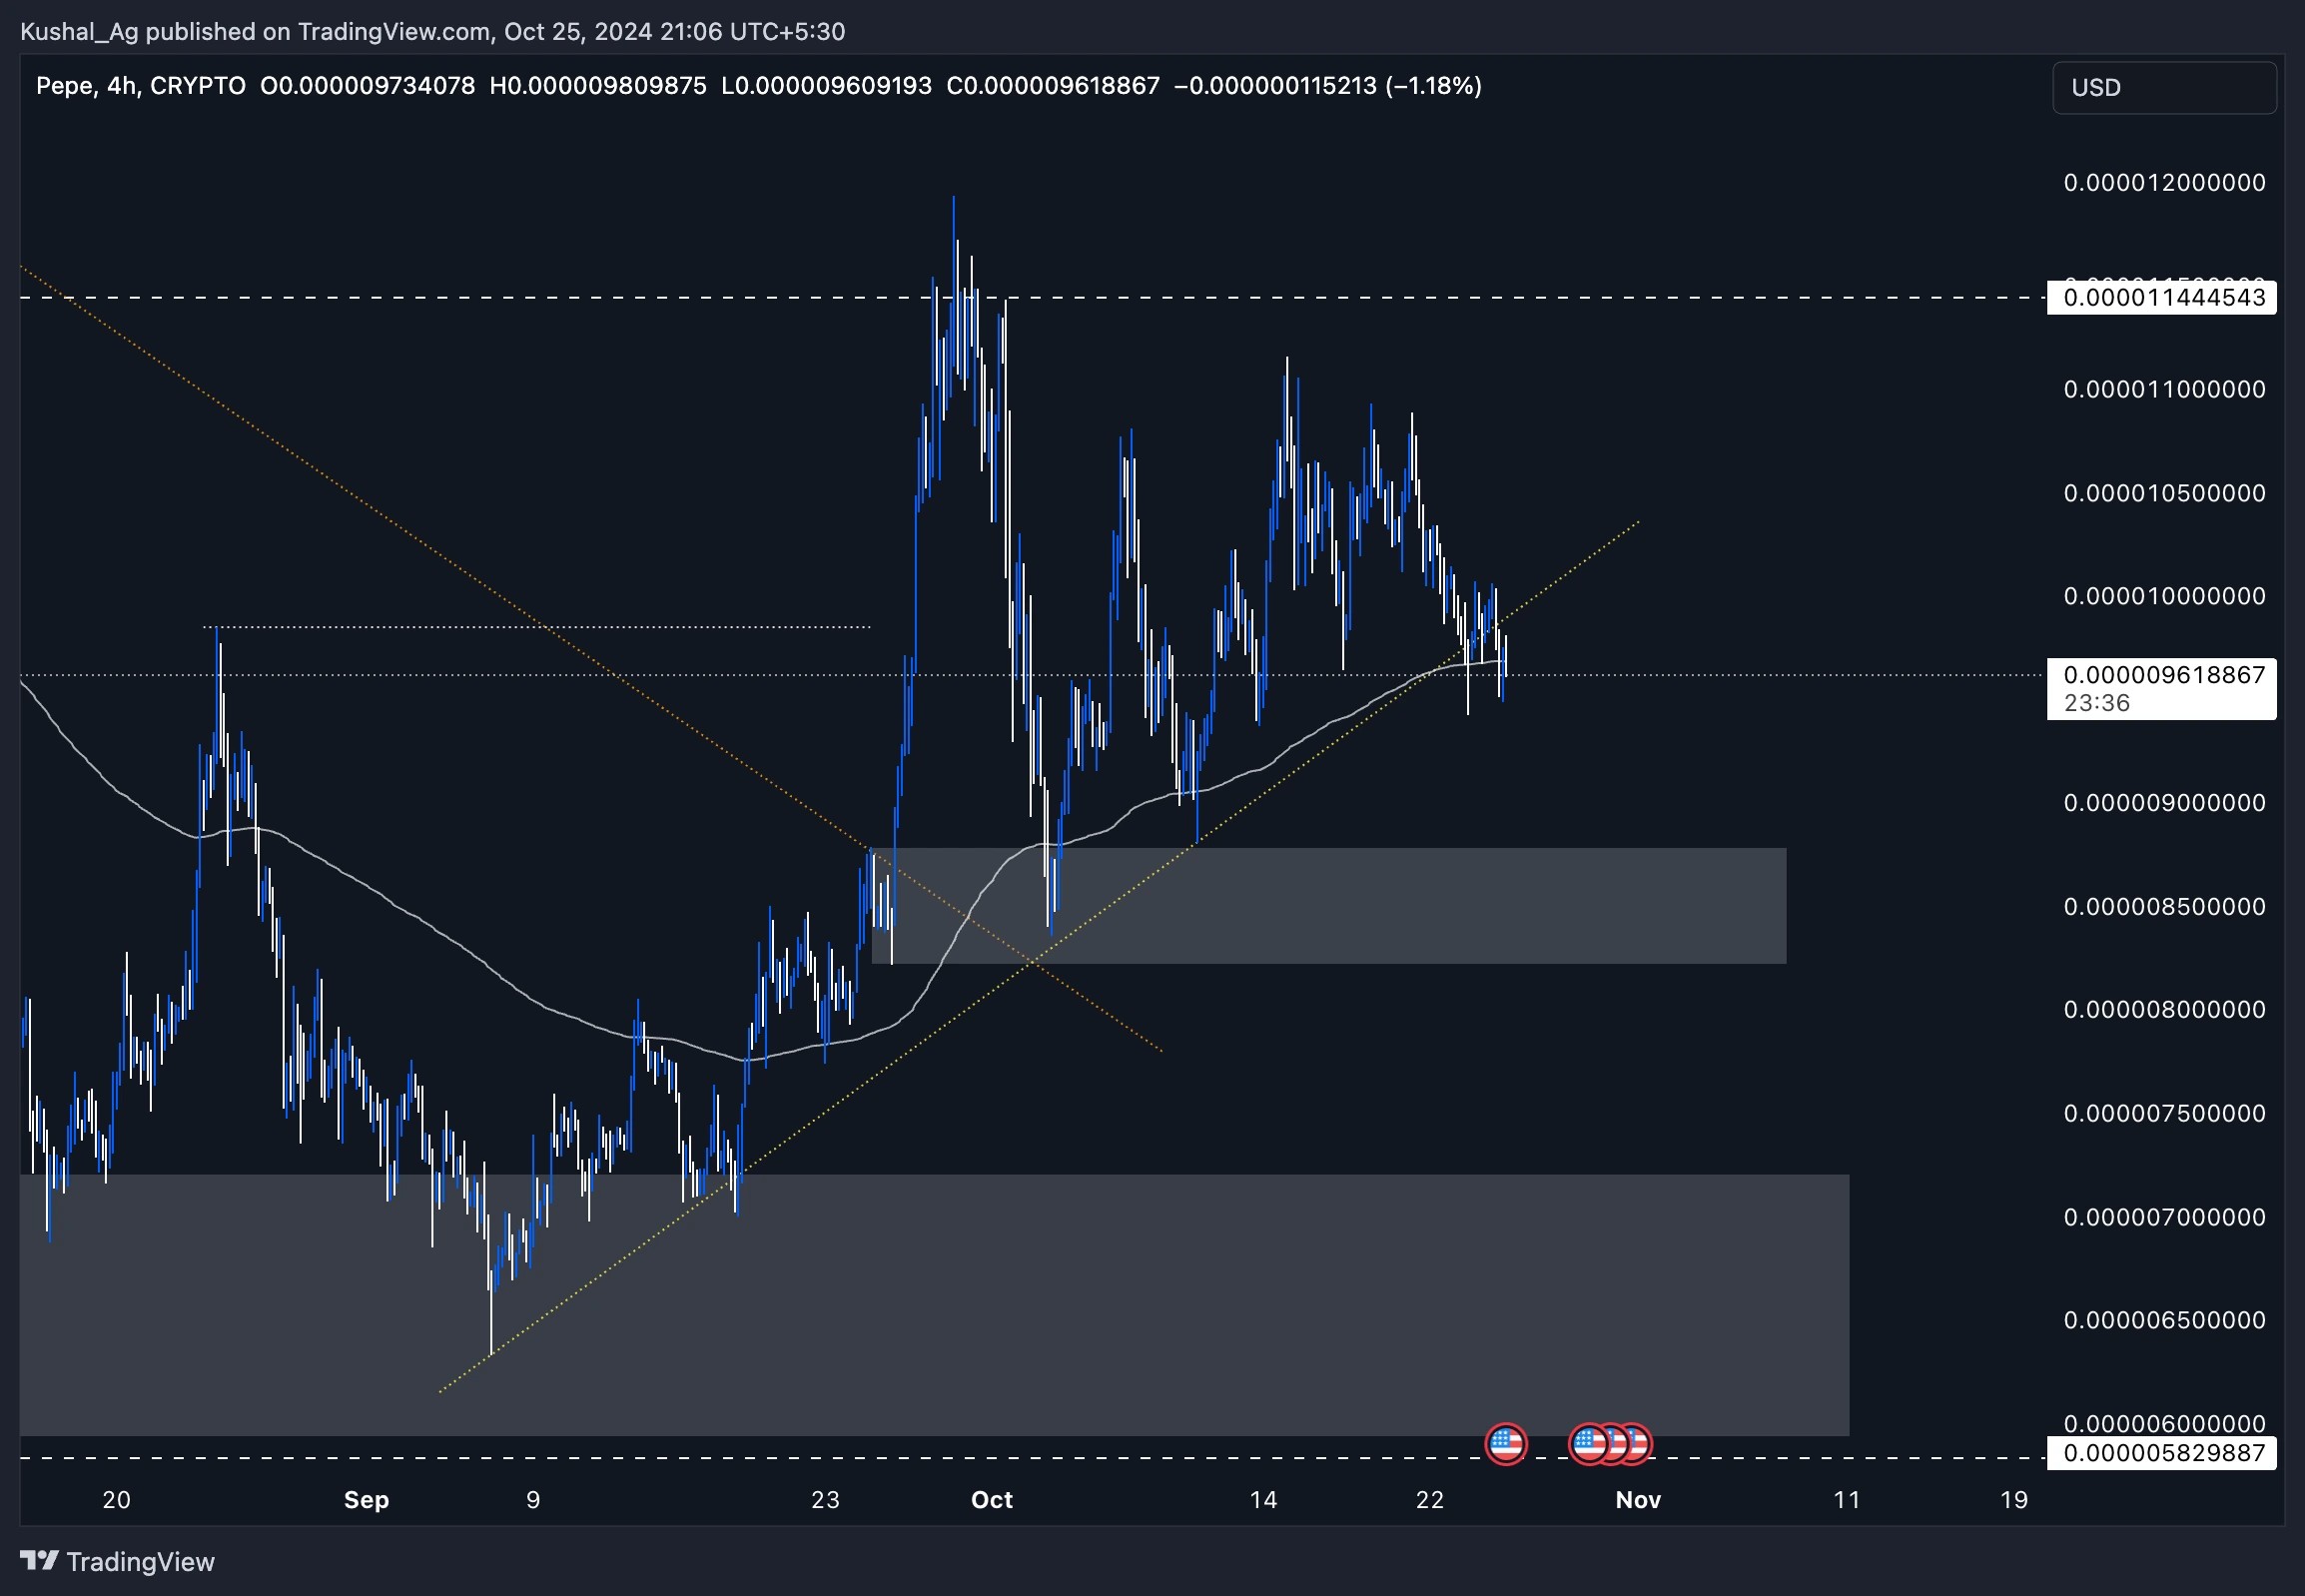
4-hour timeframe analysis
On the 4-hour timeframe, the yellow dotted trendline and 200 EMA (at $0.0000096) are more prominent. This trendline has acted as support for Pepe, and the 200 EMA currently coincides precisely with the asset's trading price.Key observations
- 200 EMA on the 4-hour: If the price holds above the 200 EMA on this timeframe, the likelihood of a deeper liquidation event decreases. However, if the 200 EMA fails to hold, the price may revisit lower support zones, as discussed in the daily timeframe.
- Trendline significance: A breakdown below this trendline on the 4-hour could trigger a temporary dip as the price seeks support from the daily demand zone.
Cryptonary's take
Pepe remains interesting from a technical perspective as it consolidates within a defined structure. The presence of multiple confluences ranging from the demand zones to the 200 EMA on both daily and 4-hour timeframes suggests a substantial support base. While this structure provides a favourable setup, maintaining a cautious, neutral stance is wise, given the unpredictable nature of meme coins.A sustained move above the 200 EMA in the 4-hour timeframe could signal potential upside momentum, while a breakdown might offer opportunities for re-entry in the demand zones.
Can PEPE break through the $0.000013 resistance next?
8 October 2o24As PEPE consolidates within a crucial demand zone, all eyes are on the $0.000013 resistance. Will the meme coin manage to push through?
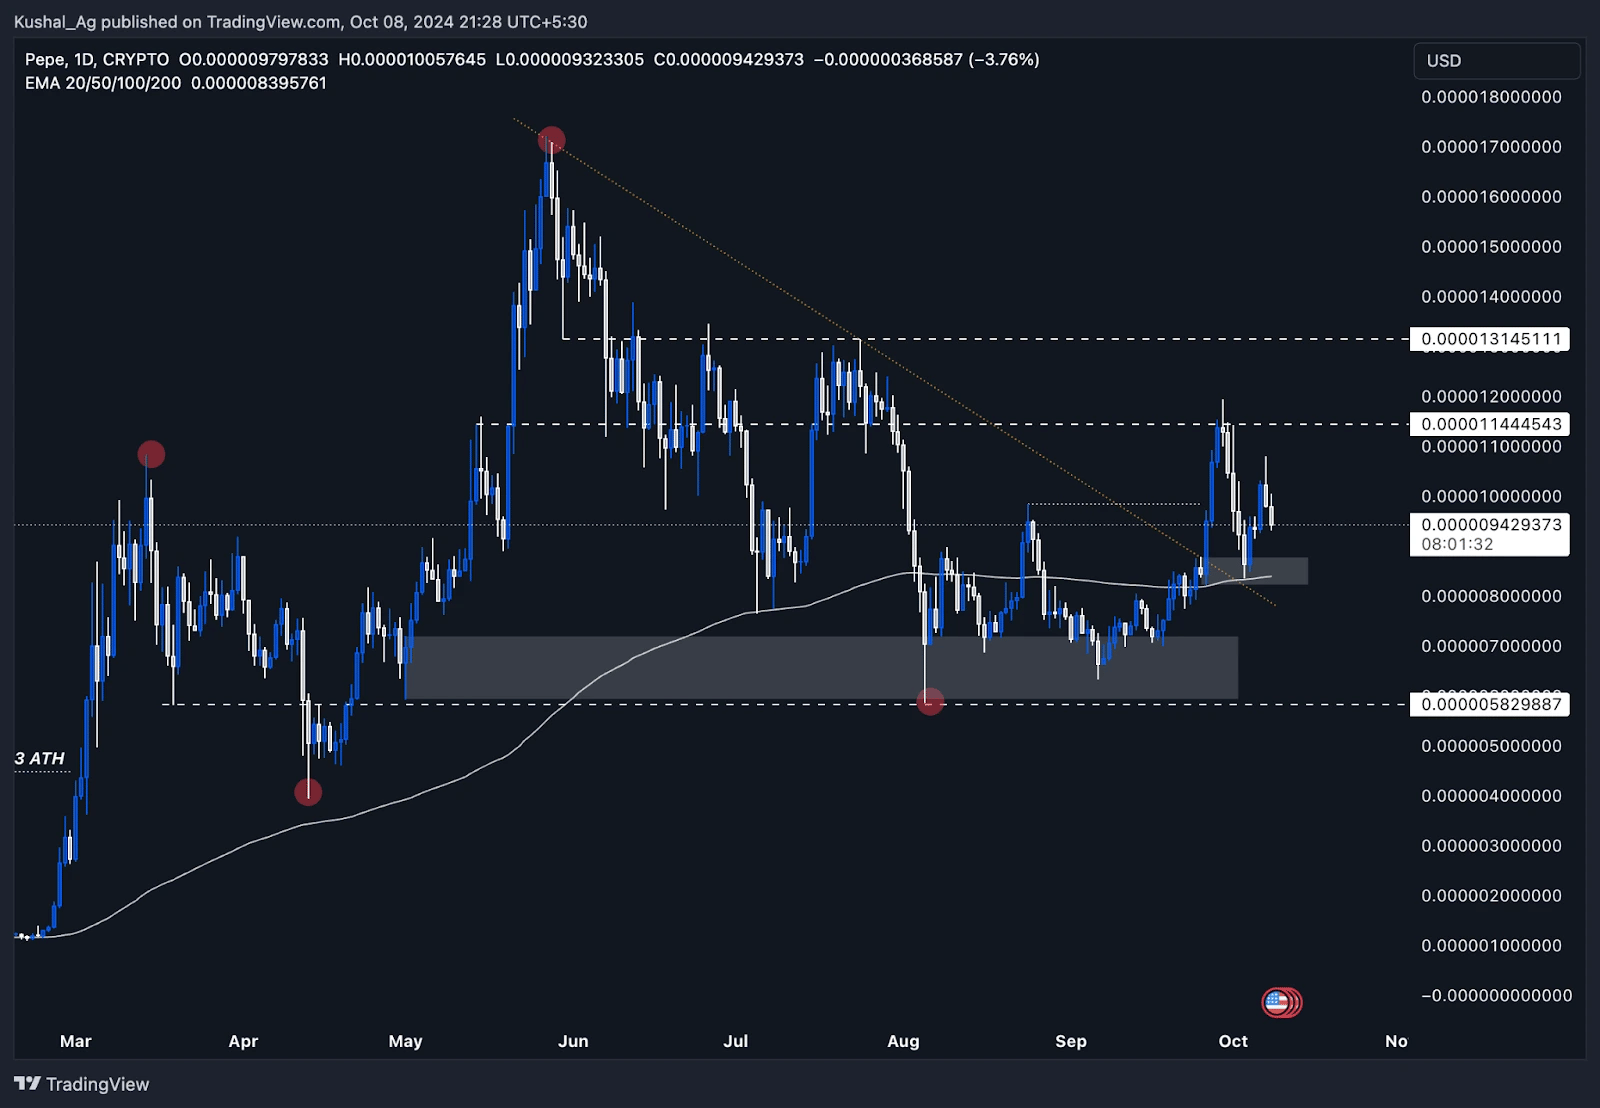
Overview
The broader meme coin sector continues to ride a wave of speculation and enthusiasm, with $PEPE standing out as one of the prominent players in this space. As the broader market begins to heat up, meme coins like $PEPE are gaining momentum once again.A key technical development on the daily chart shows $PEPE making a bullish shift in structure, which could lead to significant upside potential in the near term. This analysis will focus on $PEPE's performance across the daily and 4-hour timeframes, where crucial price levels and trendline breaks are shaping the next big move.
Daily timeframe analysis
Recently, $PEPE broke out from its downtrend trendline in late September, as denoted by the orange dotted line on the chart. This breakout was accompanied by a strong 35%+ swing to the upside, highlighting renewed momentum within the asset. However, despite this bullish move, the price faced resistance around the $0.000011 level, which it failed to close above, marking a key level to watch going forward.Currently, $PEPE is showing solid support around the $0.0000085 area, a level confluenced by the 200 EMA and a strong daily demand zone. The 200 EMA has proven to be a significant technical indicator, holding the price up and serving as a base for potential future rallies. This daily demand zone still remains intact, providing a crucial layer of support that could serve as a springboard for the next leg up.
Key levels:
- Support: $0.0000085 (200 EMA)
- Resistance: $0.000011 (short-term resistance), $0.000013 (next major resistance)
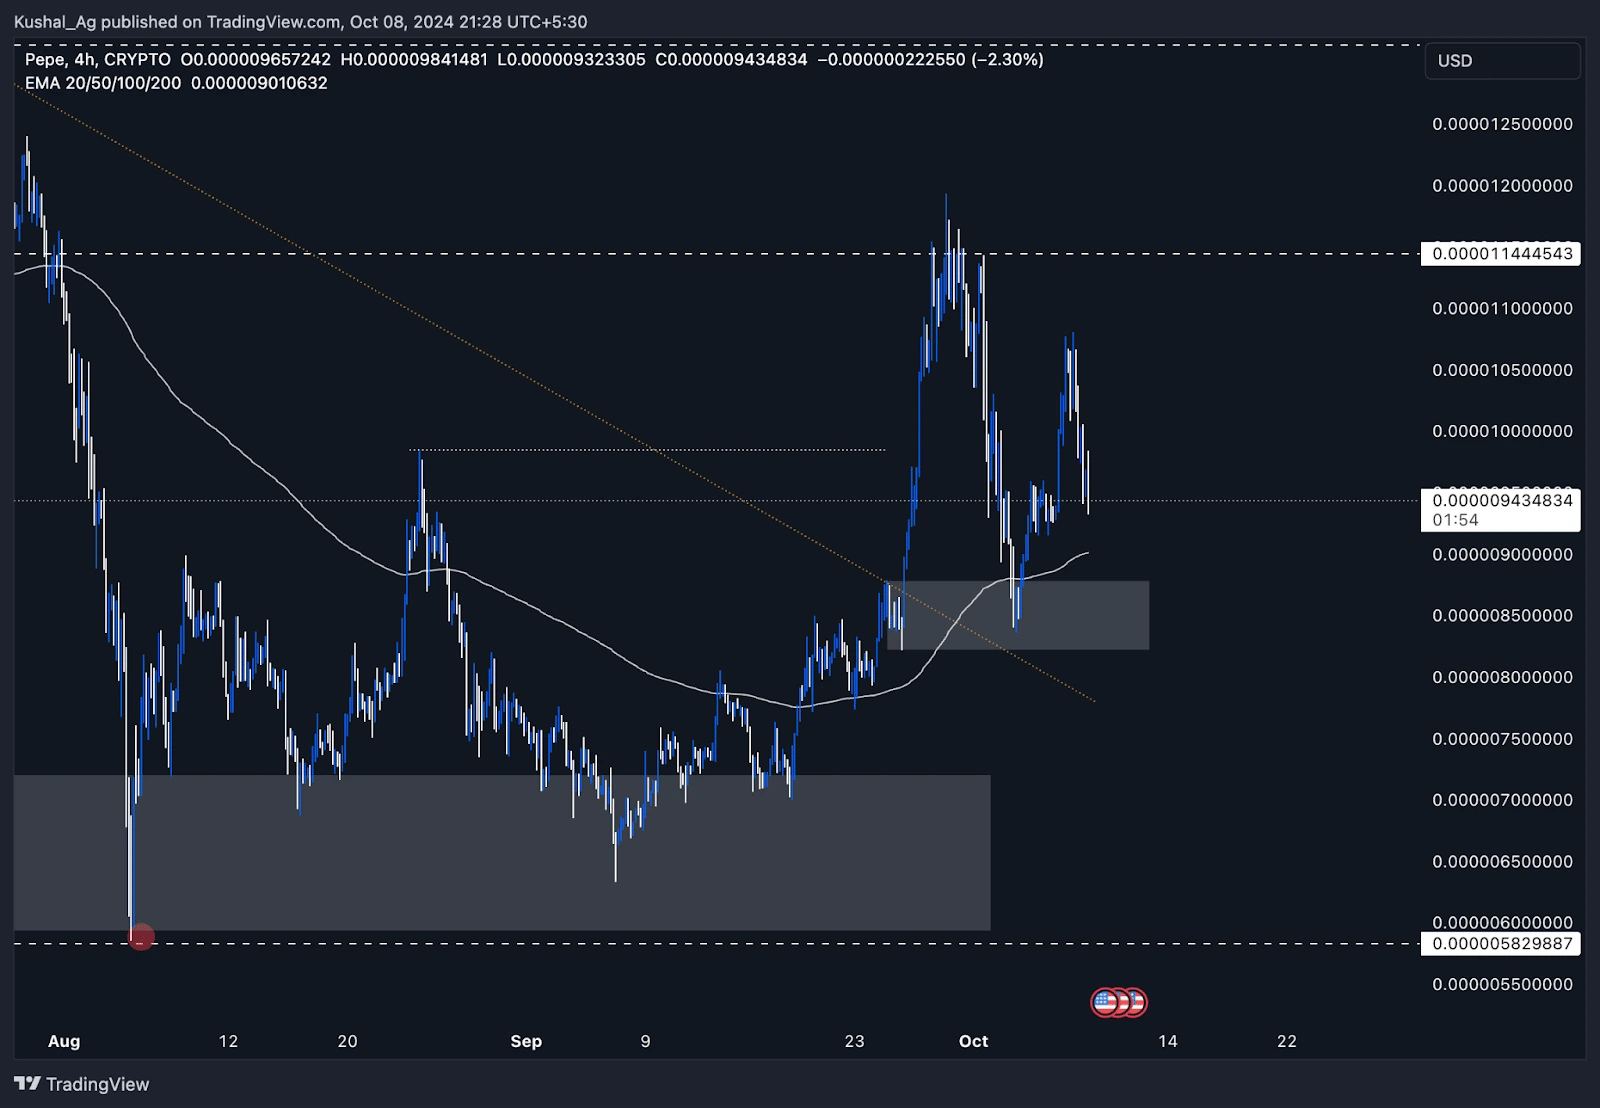
4-Hour timeframe analysis
On the 4-hour chart, $PEPE has been consolidating between the $0.0000082 and $0.0000088 range, which also aligns with the 200 EMA on this timeframe.During its breakout from the trendline in September, $PEPE printed an impulsive move, breaking previous swing highs, thus confirming a bullish structure on this lower timeframe. Price is currently retesting the 4-hour demand zone created in this breakout, which is marked by the grey box.
This demand zone (0.0000082 - 0.0000088) is a strong area where buyers previously stepped in, and it could serve as a key accumulation zone for long-term holders looking to capitalise on the recent pullback. Price has already tested the 200 EMA on this timeframe, and the confluence of the demand zone with this technical indicator gives this setup a favourable risk/reward ratio for long entries.
If the price can successfully hold above this demand zone and break past the immediate resistance at $0.000011, the next targets would be the $0.000013 resistance and the ATH beyond that.
Key levels:
- Support: $0.0000082 - $0.0000088 (4H demand zone)
- Resistance: $0.000011 (short-term resistance), $0.000013 (next major resistance)
Cryptonary's take
$PEPE is showing significant strength across both daily and 4-hour timeframes, positioning itself as a meme coin to watch in the near term. With the recent breakouts from key trendlines, support zones holding strong, and positive confluence between multiple technical indicators, $PEPE could see a substantial upside if it manages to break above the $0.000011 and $0.000013 resistances.That said, the inherent volatility of meme coins like $PEPE should not be underestimated. Investors need to proceed with caution, as these assets can experience sharp market corrections just as easily as they rally.
Is the 0.50595 - 0.50890 range key?
30 September 2024
The key level we're focusing on with Pepe is around 0.50595. Since its inception, Pepe has experienced a significant bullish surge, particularly notable in its early days. Despite the downside market of 2023, Pepe showed resilience, even though it trended bearishly for a period.
In October, in line with broader market movements, Pepe saw a decent surge, pumping up 160% from the lows. This was followed by a 50% retracement before setting a swing in February of this year with an impressive 1000% rally, underscoring the huge demand for this asset, especially within this cycle. After this, on March 11th, Pepe retraced 64% from 0.401091 before launching into a new surge of around 328%.
Following this, the price retraced another 64-65%, dropping back down to 0.50595, a key level we've discussed in previous analyses. Since the swing high that resulted in the 328% move around May 27th, Pepe has been in a relatively positive corrective bearish move.
This price action is not negative; it's actually quite healthy. On the downside, we've seen some strong bullish rebounds. For example, from 0.50765, Pepe had a 68% recovery bounce before selling off back to the previous swing low. Now, we're trading between 0.50765 and 0.50890, which we're identifying as our accumulation zone.
This is where we plan to build spot positions, given the asset's potential to deliver substantial gains due to its meme coin nature, volatility, and speculative attractiveness. Zooming out, Pepe's historical chart is one of the most bullish in the space. Despite the sometimes bearish sentiment since the beginning of the year, the higher time frame price action and structure have remained strong and well-respected.
Disclaimer: This is not financial or investment advice. You are responsible for any capital-related decisions you make, and only you are accountable for the results.
Market mechanics
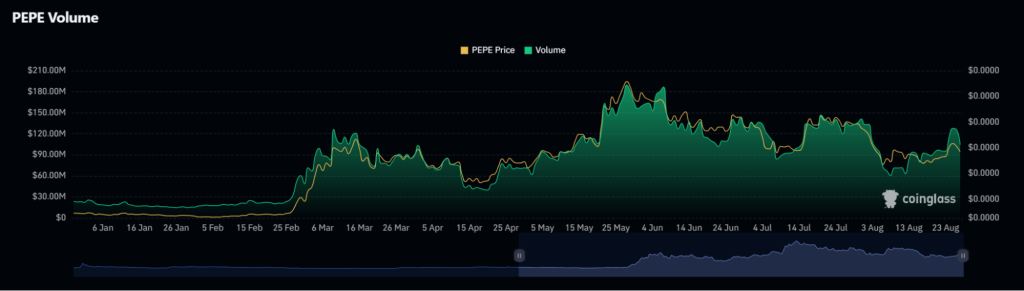
We won't delve too deeply into market mechanics, as there's no strong influence from either side currently. However, it's worth noting that the volume on Pepe ramped up over the weekend, which is an interesting development. Volume had been relatively flat, but we recently saw an increase from $63 million to $127 million in volume, which indicates that market heat may be returning. This is particularly relevant in our accumulation zone, as this increased volume could help build the momentum needed to push prices higher.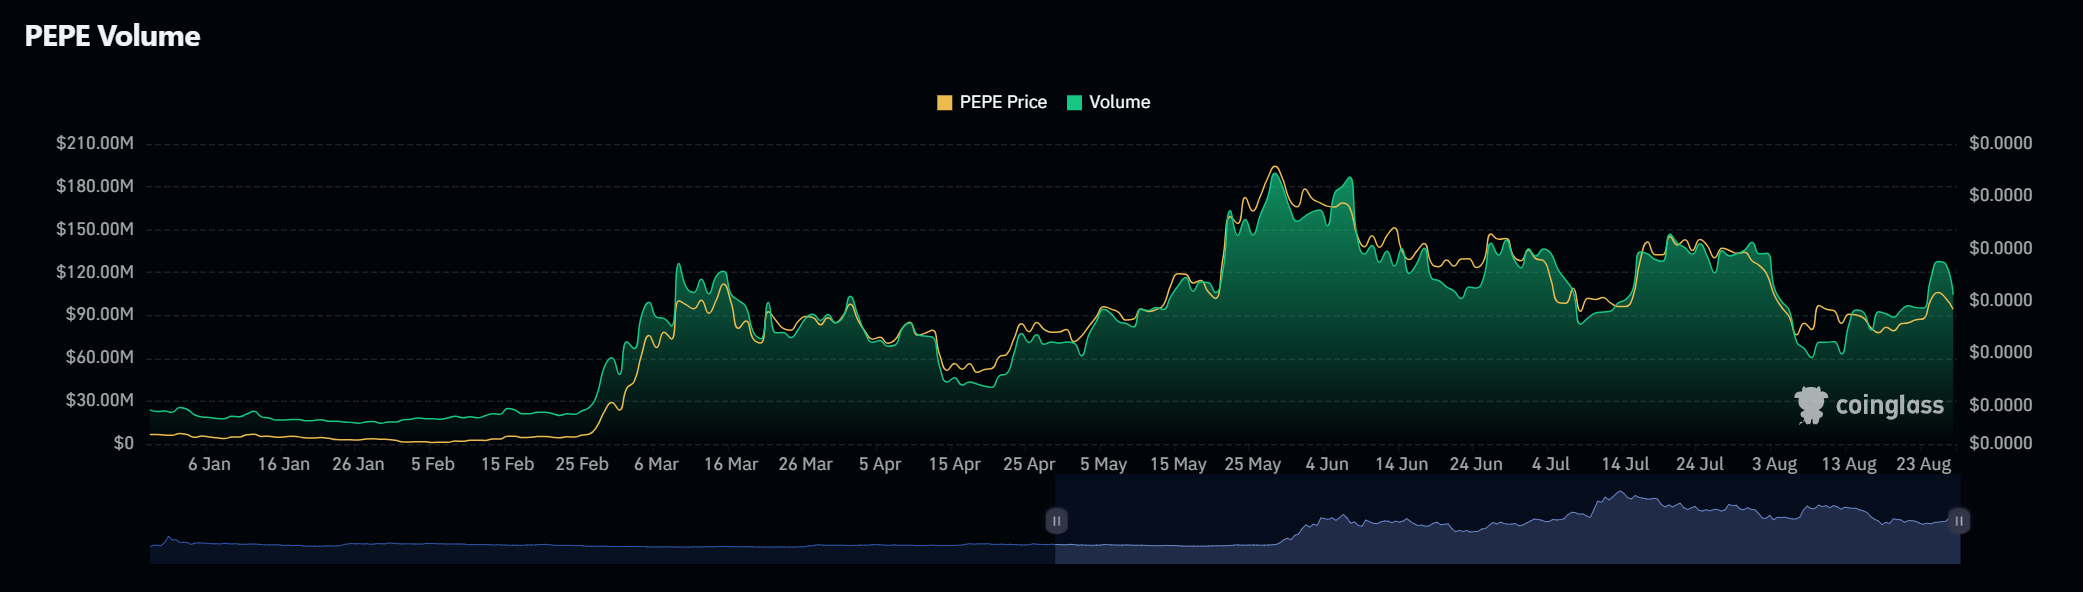
Playbook
Hypothesis: Pepe's price action suggests that the current zone between 0.50765 and 0.50890 is a critical accumulation area. The historical patterns, particularly the recent 350% move from the low in April, show that Pepe has the capability to repeat such performance, making this a prime area to start building positions.Key levels
- 0.50595
- 0.50890
Risk management
Spot Accumulation: Target accumulation within the 0.50595 - 0.50890 range to minimize risk.
Cryptonarys take
Given the market mechanics, including the increased volume and the resilience of Pepe's price action, accumulating within the 0.50595 - 0.50890 range appears to be a solid strategy. If the market follows historical patterns, we could see substantial gains, making this a great opportunity to build positions in this accumulation zone.Will the Bulls break resistance soon?
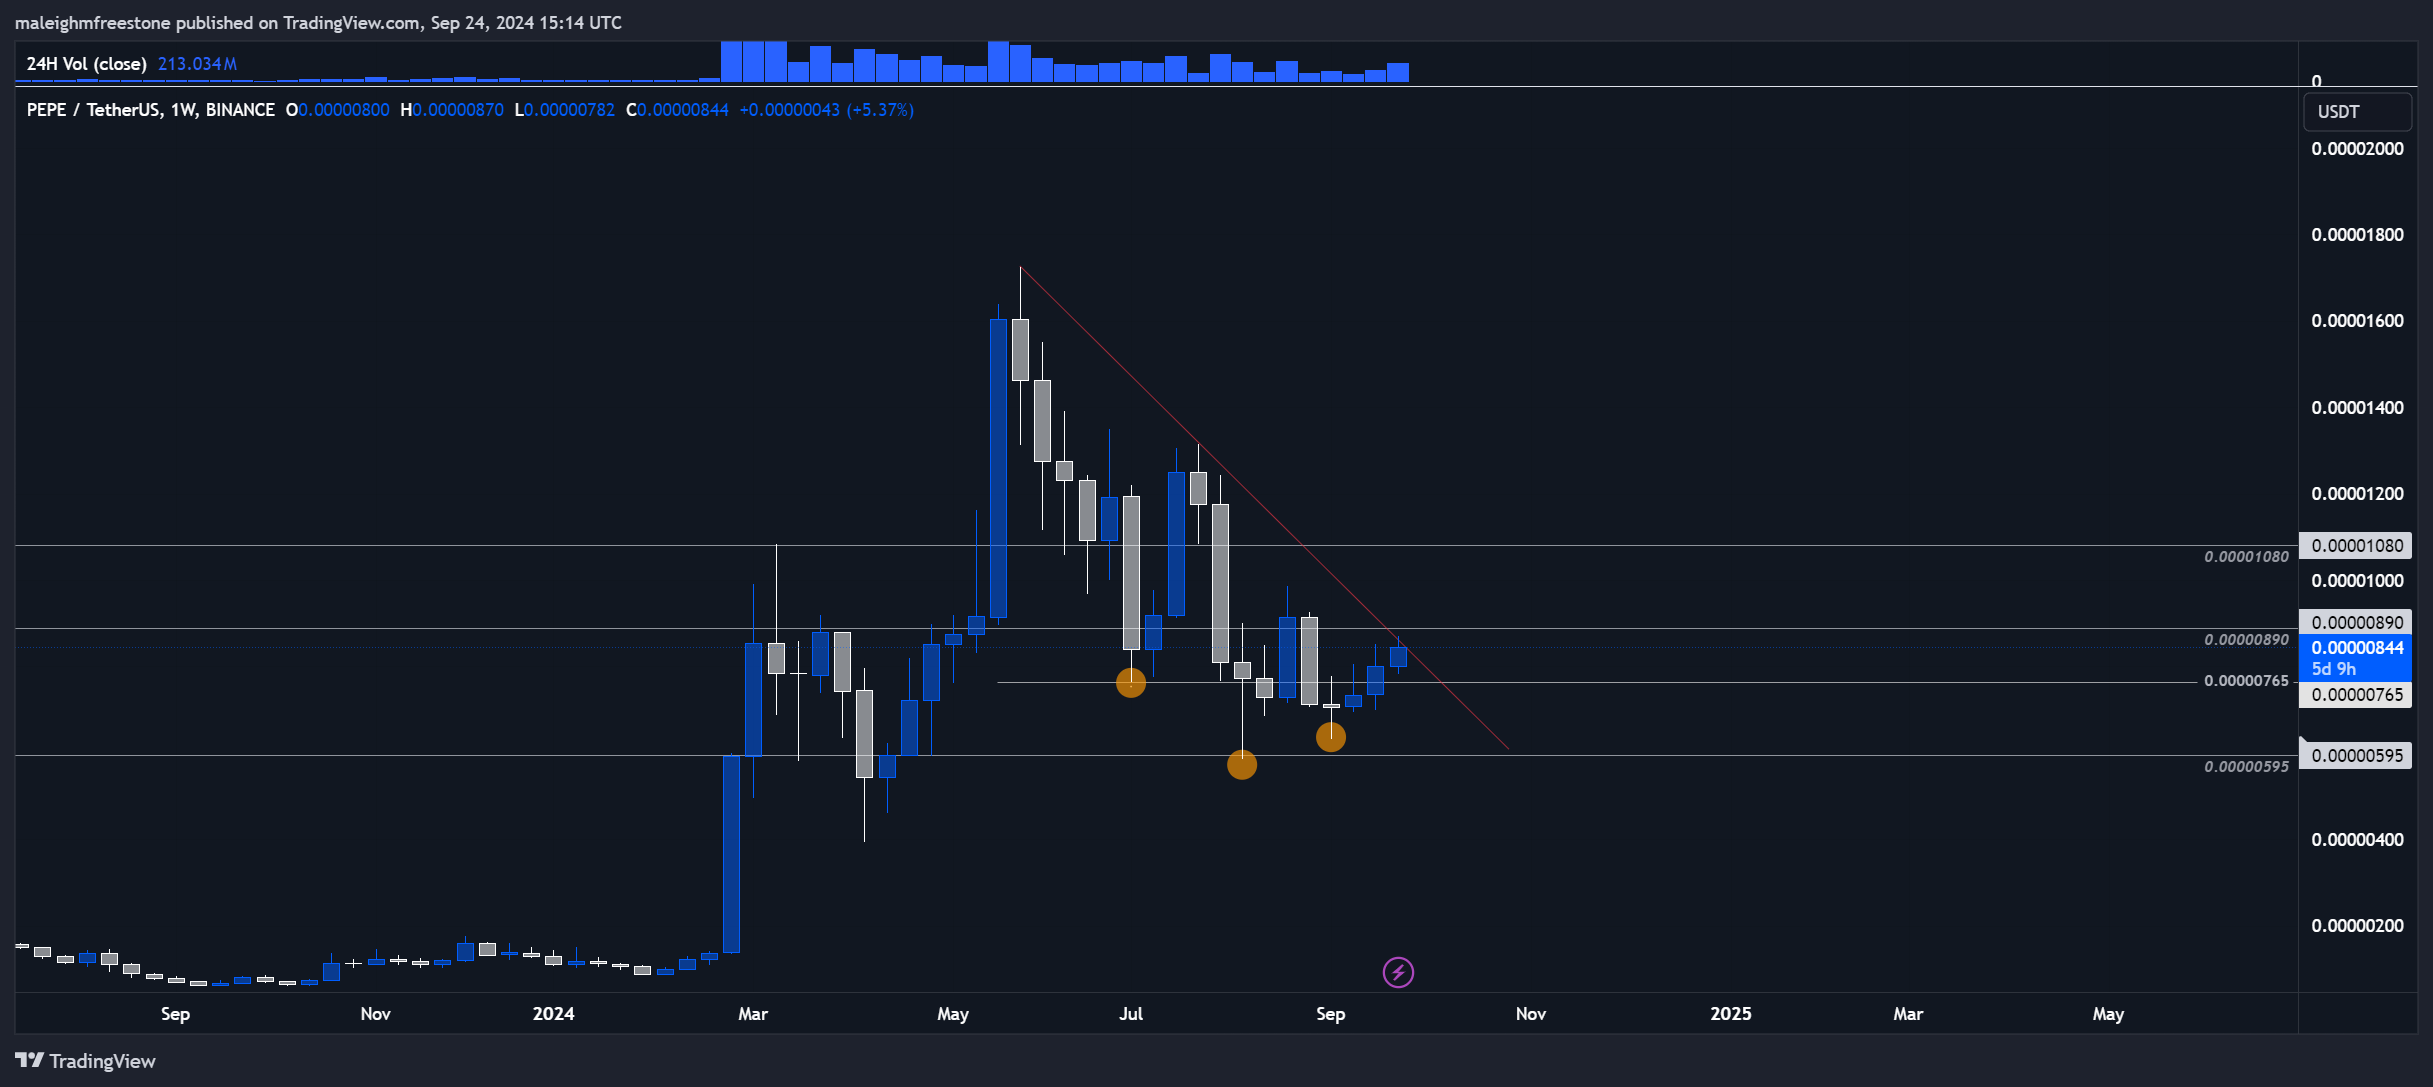
24 September 2024Following our last analysis, we haven't seen a ton of movement just yet, but there are a few key developments worth noting, especially in the monthly timeframe. When we look at the broader market context, we can see that from February to May, Pepe made a 1,900% move to the upside- a significant gain compared to other assets in the space.
After this, we had a retracement that brought us to the 61.8% Fibonacci level, which is where we're currently trading. Importantly, we've seen a strong reaction at this level. This Fibonacci region has aligned perfectly with a three-pin formation, which is essentially an inverted head and shoulders pattern, one of the strongest reversal signals. We've highlighted this on the chart, as seen with the red-orange circles.
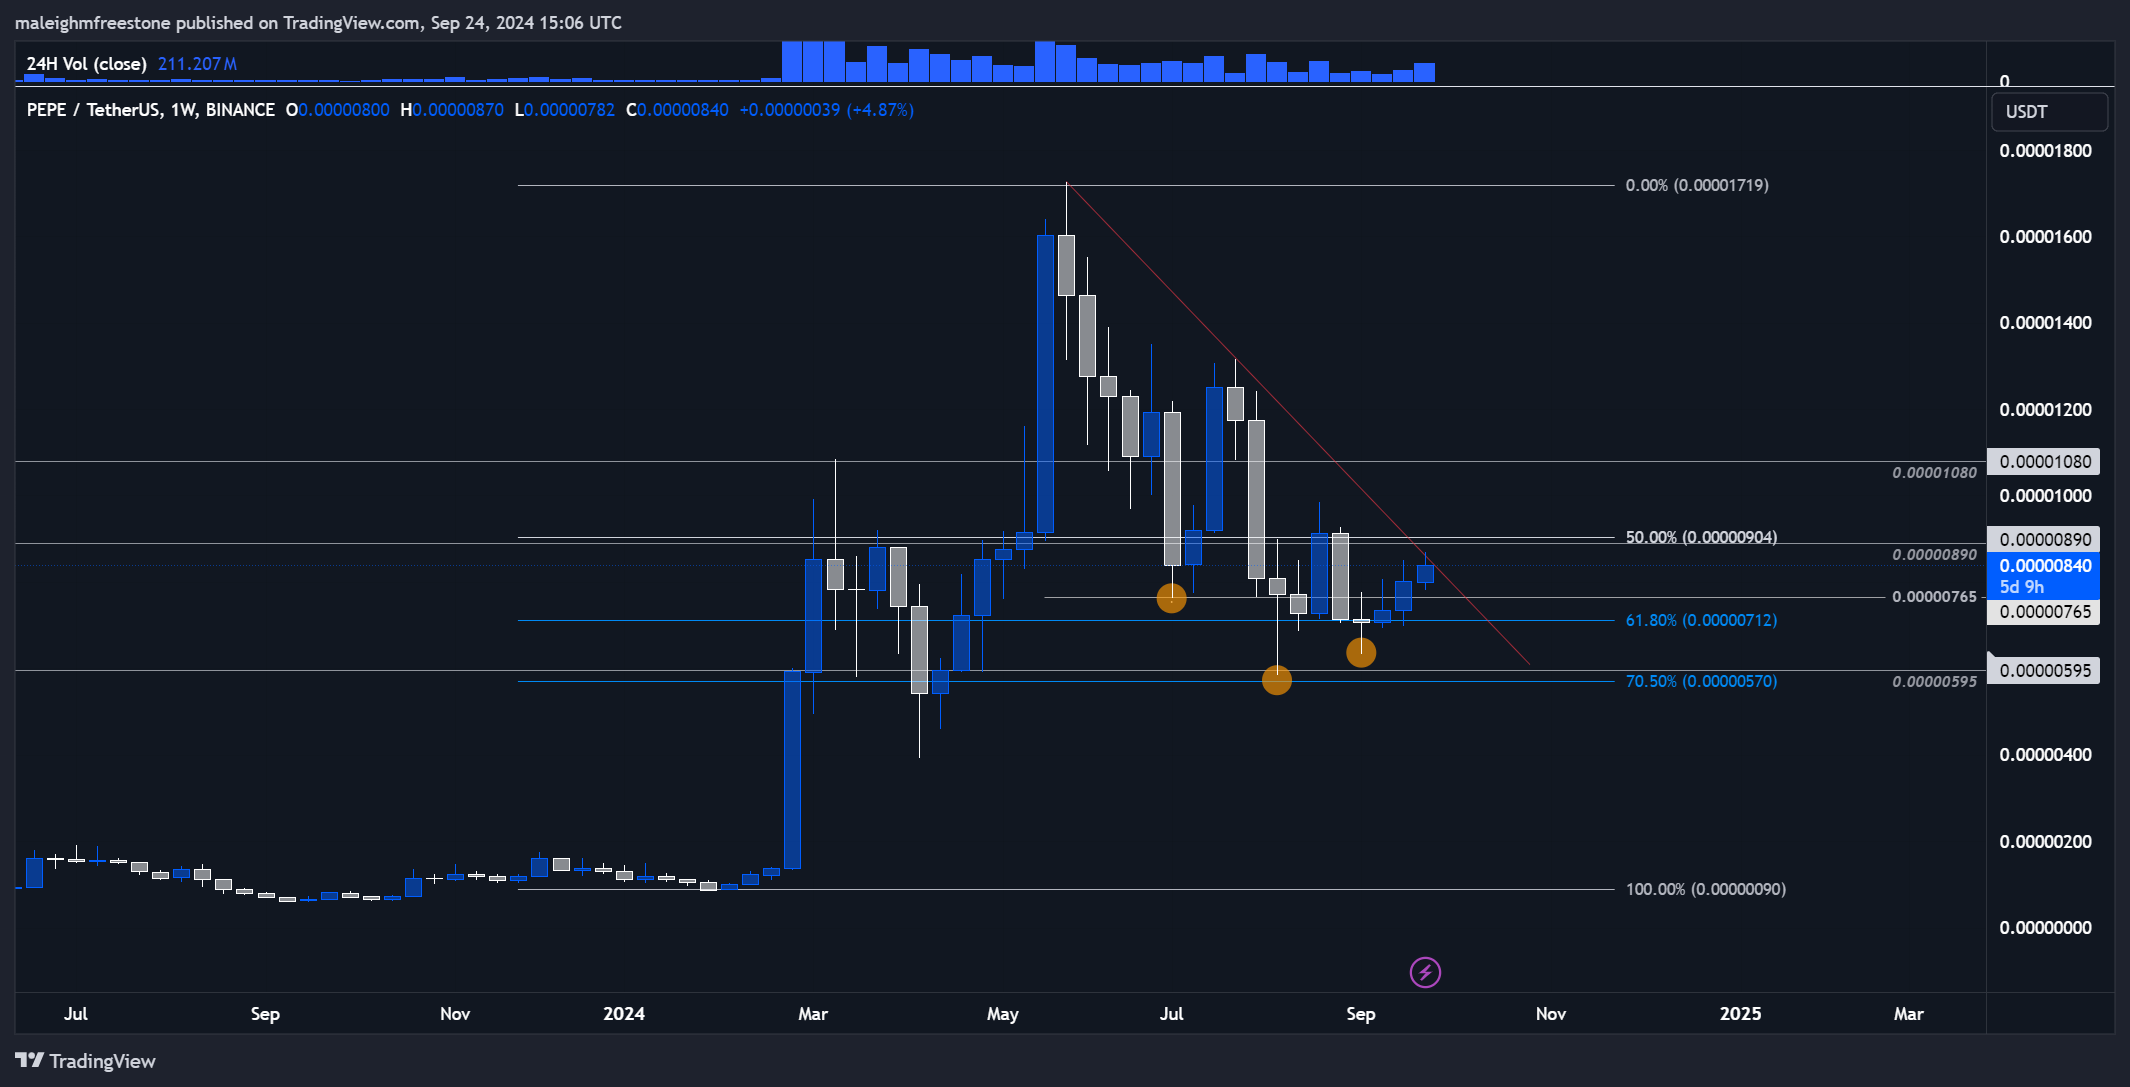
Zooming into the weekly timeframe, we can see a clean, rounded bottom forming. The weekly time frame also reflects a healthy corrective move, with bulls pushing back against the previous bearish momentum. Additionally, we've drawn attention to a red diagonal resistance level, which we're testing right now. A breakout above this level could be a key signal for upward movement.
Playbook
The current zone is ideal for spot accumulation within these price regions. Although we're not invested in Pepe, it's hard to ignore how strong this asset has been, especially considering its price action this year. Pepe remains a serious contender for this cycle.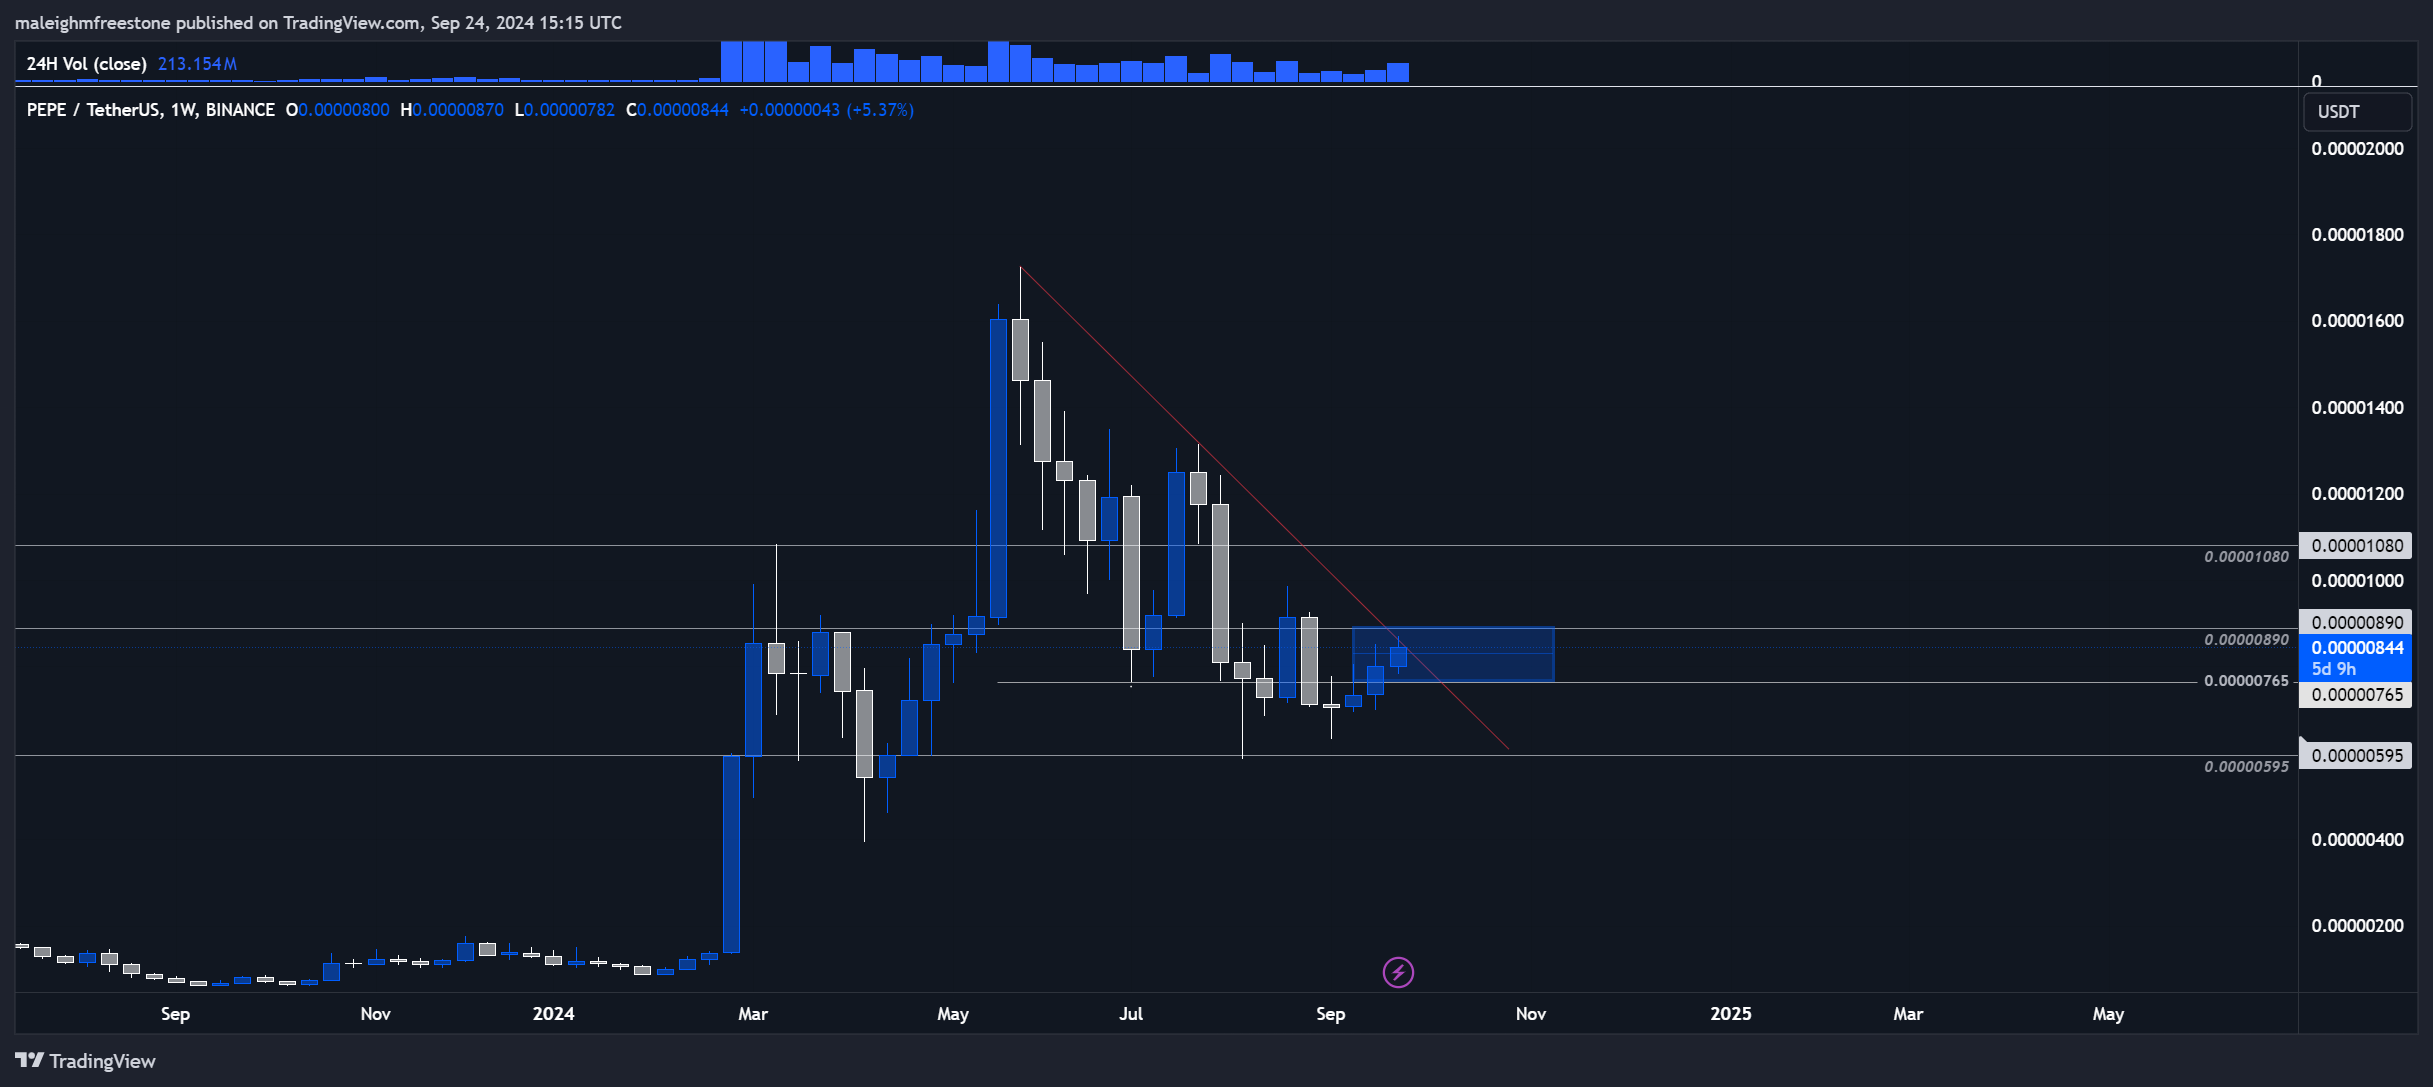
Cryptonarys take
Again, just a reminder-while Pepe has been a standout asset in terms of strength and bullish price action, this isn't something we are invested in. However, when we compare this price action across the board, we see that it's a real player when we look at the technicals.Is it time to accumulate PEPE?
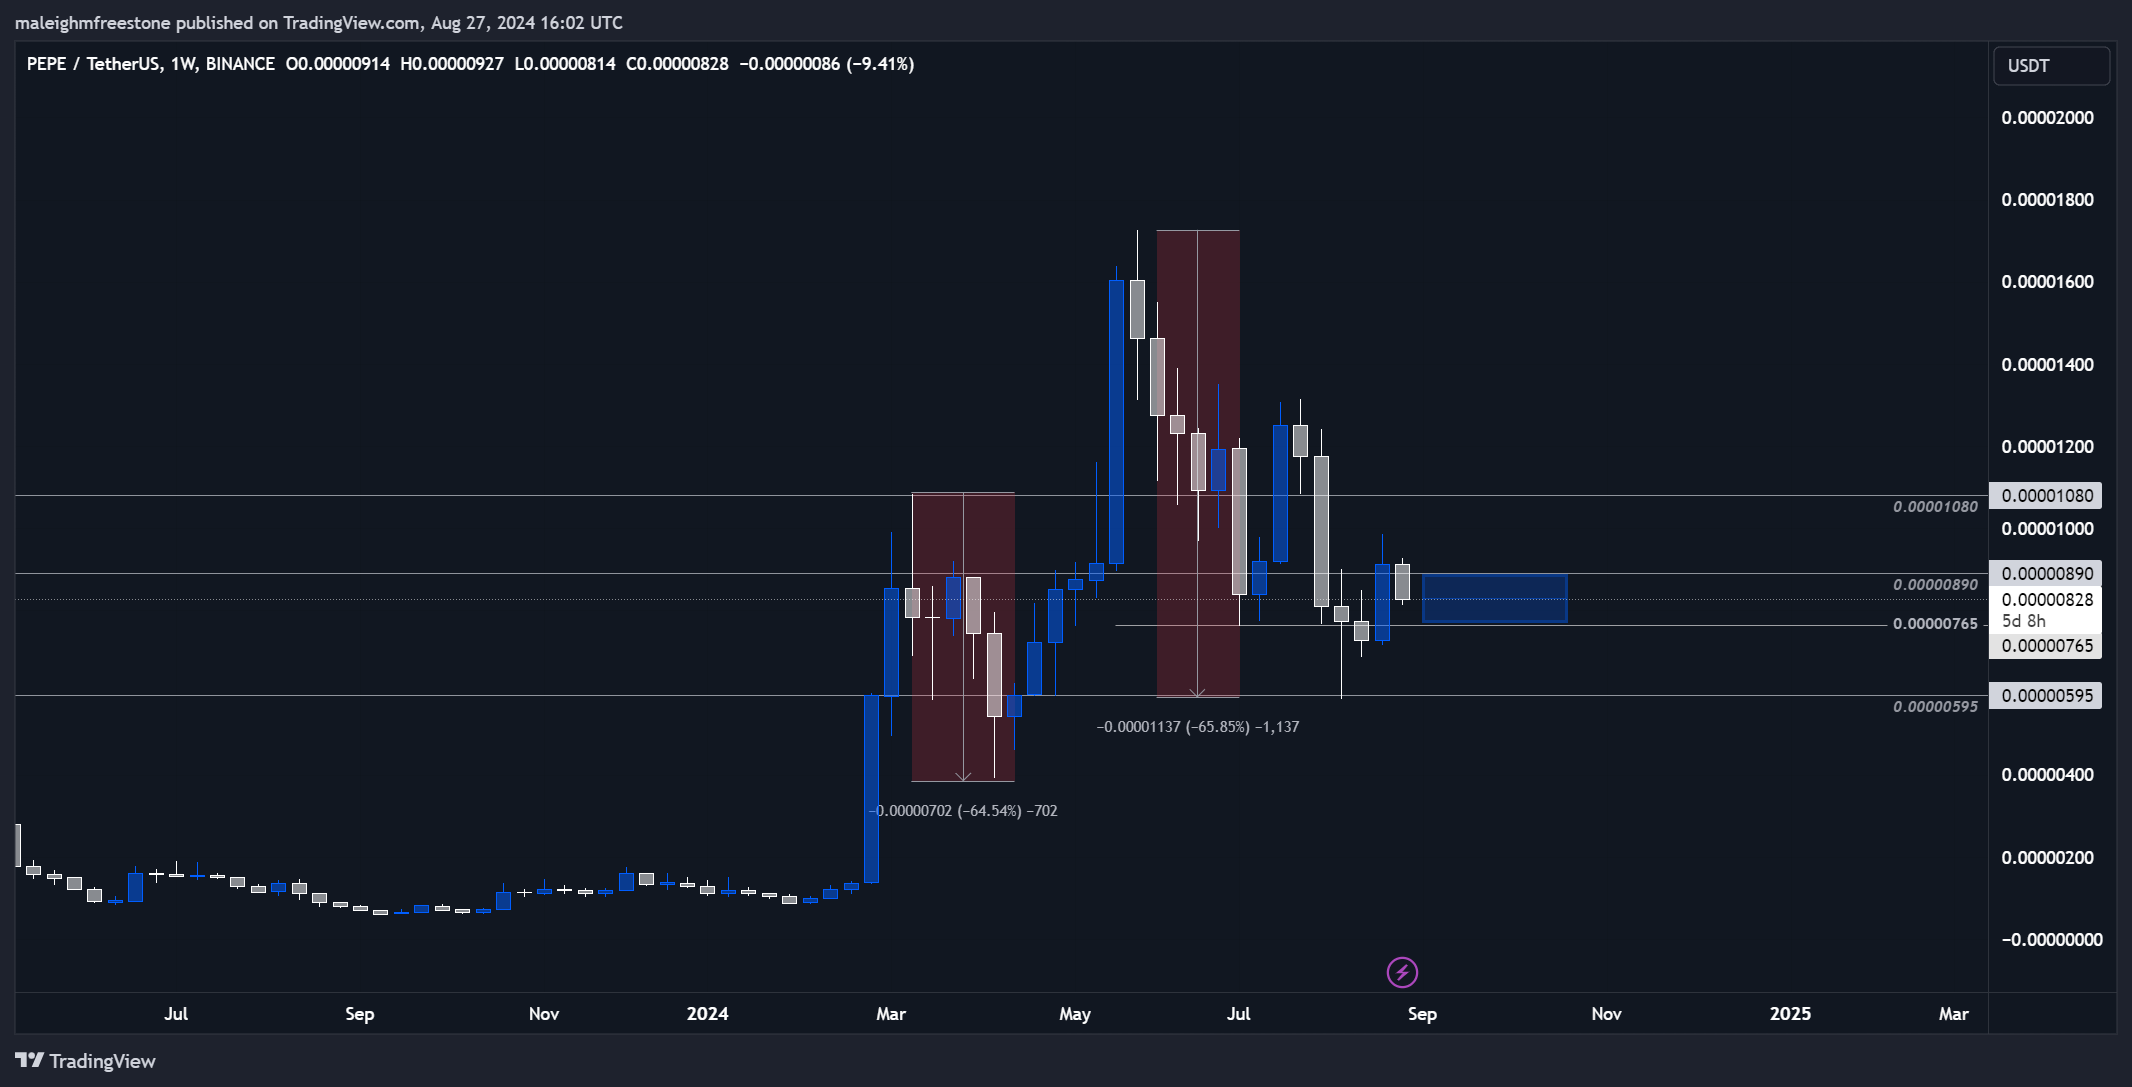
27 August 2o24Since its inception, Pepe has experienced a significant bullish surge, particularly notable in its early days. Despite the downside market of 2023, Pepe showed resilience despite trending bearishly for a period. Now, this coin seems to be getting ready to break out.
Market context
The key level we’re focusing on with Pepe is around $0.00000595.In October 2023, in line with broader market movements, Pepe saw a decent surge, pumping up 160% from the lows. This was followed by a 50% retracement before setting a swing in February with an impressive 1000% rally, underscoring the huge demand for this asset, especially within this cycle. After this, on March 11th, Pepe retraced 64% from $0.00001091 before launching into a new surge of around 328%.
Following this, the price retraced another 64-65%, dropping back to $0.00000595, a key level we discussed in previous analyses. Pepe has been in a relatively positive corrective bearish move since the swing high that resulted in the 328% move around May 27th.
This price action is not negative; it’s actually quite healthy. On the downside, we’ve seen some strong bullish rebounds. For example, from $0.00000765, Pepe had a 68% recovery bounce before selling off back to the previous swing low. Now, we’re trading between $0.00000765 and $0.00000890, which we’re identifying as our accumulation zone.
This is where we plan to build spot positions, given the asset’s potential to deliver substantial gains due to its meme coin nature, volatility, and speculative attractiveness.

Zooming out, Pepe’s historical chart is one of the most bullish in the space. Despite the sometimes bearish sentiment since the beginning of the year, the higher time frame price action and structure have remained strong and well-respected.
Market mechanics
We won’t delve too deeply into market mechanics, as there’s no strong influence from either side currently.However, it’s worth noting that the volume on Pepe ramped up over the weekend, which is an exciting development. Volume had been relatively flat, but we recently saw an increase from $63 million to $127 million, which indicates that market heat may be returning.
This is particularly relevant in our accumulation zone, as this increased volume could help build the momentum needed to push prices higher.
Playbook
- Hypothesis: Pepe’s price action suggests that the current zone between $0.00000765 and $0.00000890 is a critical accumulation area. The historical patterns, particularly the recent 350% move from the low in April, show that Pepe has the capability to repeat such performance, making this a prime area to start building positions.
- Key levels: $0.00000595|$0.00000890
- Risk management: Spot Accumulation: Target accumulation within the $0.00000595 - $0.00000890 range to minimise risk.

Cryptonary’s take
Given the market mechanics, including the increased volume and the resilience of Pepe’s price action, accumulating within the $0.00000595 - $0.00000890 range appears to be a solid strategy.If the market follows historical patterns, we could see substantial gains, making this a great opportunity to build positions in this accumulation zone.
Is the 0.50595 - 0.50890 range key?
27 August 2o24The key level we're focusing on with Pepe is around 0.50595. Since its inception, Pepe has experienced a significant bullish surge, particularly notable in its early days. Despite the downside market of 2023, Pepe showed resilience, even though it trended bearishly for a period.
In October, in line with broader market movements, Pepe saw a decent surge, pumping up 160% from the lows. This was followed by a 50% retracement before setting a swing in February of this year with an impressive 1000% rally, underscoring the huge demand for this asset, especially within this cycle. After this, on March 11th, Pepe retraced 64% from 0.401091 before launching into a new surge of around 328%.
Following this, the price retraced another 64-65%, dropping back down to 0.50595, a key level we've discussed in previous analyses. Since the swing high that resulted in the 328% move around May 27th, Pepe has been in a relatively positive corrective bearish move.
This price action is not negative; it's actually quite healthy. On the downside, we've seen some strong bullish rebounds. For example, from 0.50765, Pepe had a 68% recovery bounce before selling off back to the previous swing low. Now, we're trading between 0.50765 and 0.50890, which we're identifying as our accumulation zone.
This is where we plan to build spot positions, given the asset's potential to deliver substantial gains due to its meme coin nature, volatility, and speculative attractiveness. Zooming out, Pepe's historical chart is one of the most bullish in the space. Despite the sometimes bearish sentiment since the beginning of the year, the higher time frame price action and structure have remained strong and well-respected.
Market mechanics
We won't delve too deeply into market mechanics, as there's no strong influence from either side currently. However, it's worth noting that volume on Pepe ramped up over the weekend, which is an interesting development. Volume had been relatively flat, but we recently saw an increase from $63 million to $127 million in volume, which indicates that market heat may be returning. This is particularly relevant in our accumulation zone, as this increased volume could help build the momentum needed to push prices higher.
Playbook
Hypothesis: Pepe's price action suggests that the current zone between 0.50765 and 0.50890 is a critical accumulation area. The historical patterns, particularly the recent 350% move from the low in April, show that Pepe has the capability to repeat such performance, making this a prime area to start building positions. Key levels- 0.50595
- 0.50890
Risk management:
Spot Accumulation: Target accumulation within the 0.50595 - 0.50890 range to minimize risk.
Cryptonarys take
Given the market mechanics, including the increased volume and the resilience of Pepe's price action, accumulating within the 0.50595 - 0.50890 range appears to be a solid strategy. If the market follows historical patterns, we could see substantial gains, making this a great opportunity to build positions in this accumulation zone.Will PEPE hold above support?
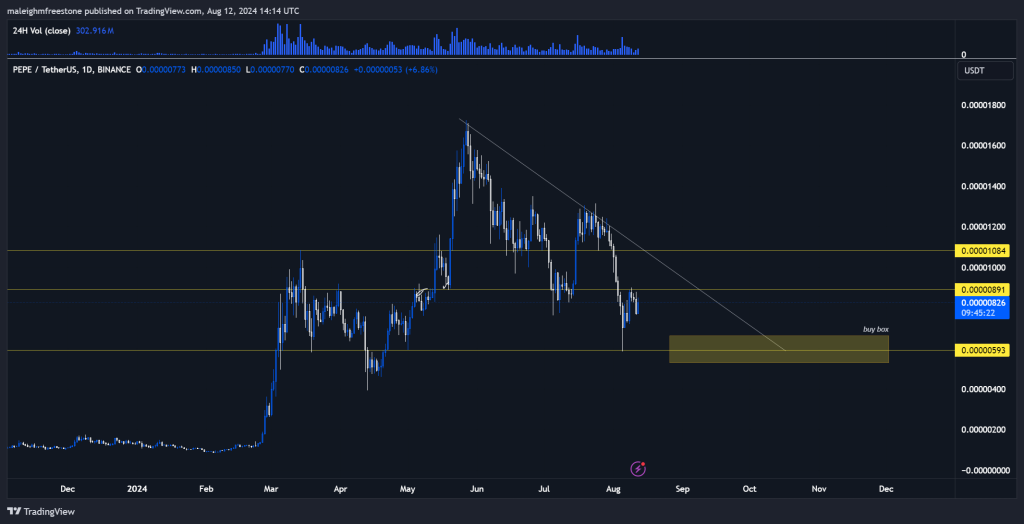
12 August 2o24Pepe (PEPE) is currently in a consolidation phase after a significant decline.
Please note: The video above is set to start at the 0-minute mark, featuring an in-depth technical analysis of Pepe (PEPE).
The price stabilised in a critical support zone between $0.00000593 and $0.00000891. This range is particularly important as it aligns with previous demand areas where buyers have historically shown interest. The recent price action suggests that Pepe might be gearing up for a potential reversal, making this an area of interest for long-term investors.
Our analysis indicates that if Pepe can hold above this support zone and begin to show signs of strength, such as forming higher lows or seeing an increase in buying volume, it could signal the beginning of a nice move, which correlates nicely with ETH and that projection.
 What is PEPE: Pepe (PEPE) is a meme-based cryptocurrency inspired by the popular internet meme Pepe the Frog. It aims to leverage the power of internet culture and community engagement to create a unique and entertaining crypto asset.
How to buy: Via Centralized Exchange (CEX):
- Choose a CEX like Binance, ByBit, or Kraken.
- Create and verify your account.
- Deposit funds.
- Navigate to the PEPE trading section and complete your purchase.
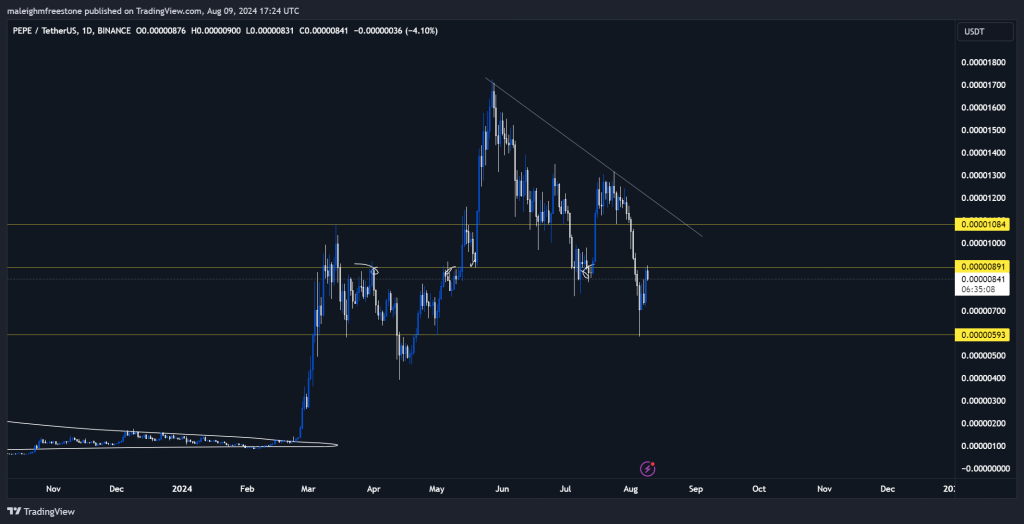
Pepe (PEPE) shows potential for significant moves with current retracement levels. Get insights into potential significant moves and key levels.
Please note: The video above is set to start at 4 minutes and 45 seconds, featuring an in-depth technical analysis of Pepe (PEPE)
- Hypothesis: Pepe remains one of the most attractive charts in the crypto space. The asset has shown consistent, sustainable swings to the upside and downside. We are particularly interested in the 61.8% retracement level at $0.00000593, which presents a strong buy opportunity. Given the strength of meme coins in the current market narrative, Pepe's dominance and potential for significant moves cannot be ignored.
- Key level: $0.00000593
- The play: Accumulate within the identified buy box. This could be done through spot buys or by employing a strategy similar to ETH's, using light leverage to maximise the potential upside. Given Pepe's volatility, it's crucial to only risk capital that you are comfortable with, but the risk-reward at this level appears favourable.
Disclaimer: This is not financial or investment advice. You are responsible for any capital-related decisions you make, and only you are accountable for the results.
Pepe (PEPE) price prediction today: Will it hit $0.001?
9 August 2o24We explore the potential price movements of Pepe (PEPE) and how it mirrors other major assets like Ethereum.
Please note: The video above is set to start at the 12-minute mark, featuring an in-depth technical analysis of Pepe (PEPE).
Pepe, on the other hand, is showing a similar pattern to Ethereum, making it an attractive alternative for those who might want to diversify their trades. The asset has retraced and bounced, and with a 50% clear move in sight, there's a compelling opportunity to enter with low-risk exposure. Utilising 2x leverage on a structure-based stop-loss could provide a high reward with controlled risk, making it a strategic play for those looking to capitalise on short-term market moves.
Is a breakout imminent?
7 August 2o24Pepe's bullish price action suggests potential for significant gains.
Please note: The video above is set to start at the 12:34 minute mark, featuring an in-depth technical analysis of Pepe (PEPE).
Pepe's chart is one of the most bullish among the assets discussed, showing aggressive swings and strong buying interest. The price action features very strong candles followed by consolidating movements, indicating that buyers are consistently stepping in to support higher prices. The asset has shown a pattern of significant upward movements followed by periods of consolidation, making it a prime candidate for both short-term trades and long-term holds.
The bullish price action in Pepe, characterised by strong upward movements and consolidations, suggests that it could continue to see significant gains. This pattern of behaviour indicates a healthy market where buyers are willing to step in and support the price, leading to sustained upward trends. Investors should consider building positions in Pepe, especially during periods of consolidation, to capitalise on potential future gains.
Educational breakdown
Understanding the characteristics of bullish price action is essential for identifying strong investment opportunities. Pepe's chart, with its aggressive swings and strong buyer interest, exemplifies a robust market structure. By recognising these patterns, investors can make informed decisions about when to enter and exit positions, maximising their returns. This approach emphasises the importance of technical analysis and market sentiment in identifying and capitalising on bullish trends.
Ride the Next Big Crypto Wave 🚀
PEPE’s price action shows the explosive potential of meme coins—just like early Bitcoin and Dogecoin. The key to winning in crypto is spotting trends before they take off. That’s where Cryptonary comes in.📊 Expert market insights 📈 Real-time updates on top crypto picks 💰 Proven strategies for massive gains
Join Cryptonary today and take control of your financial future. Try it risk-free for 7 days! ⬇️
Recommended from Cryptonary


