Save 23% ($351) & Get a Free 1-1 Call with our Team ⏰ : 0d 2h 59m 44s
Price prediction for ETH, SOL, BTC, WIF, and POPCAT
Crypto markets continue to fluctuate as BTC hits resistance and ETH lags behind. SOL remains range-bound with breakout potential, WIF approaches overbought territory, and POPCAT makes headlines with a massive breakout above $1.

Disclaimer: This is not financial or investment advice. You are responsible for any capital-related decisions you make, and only you are accountable for the results.
BTC:
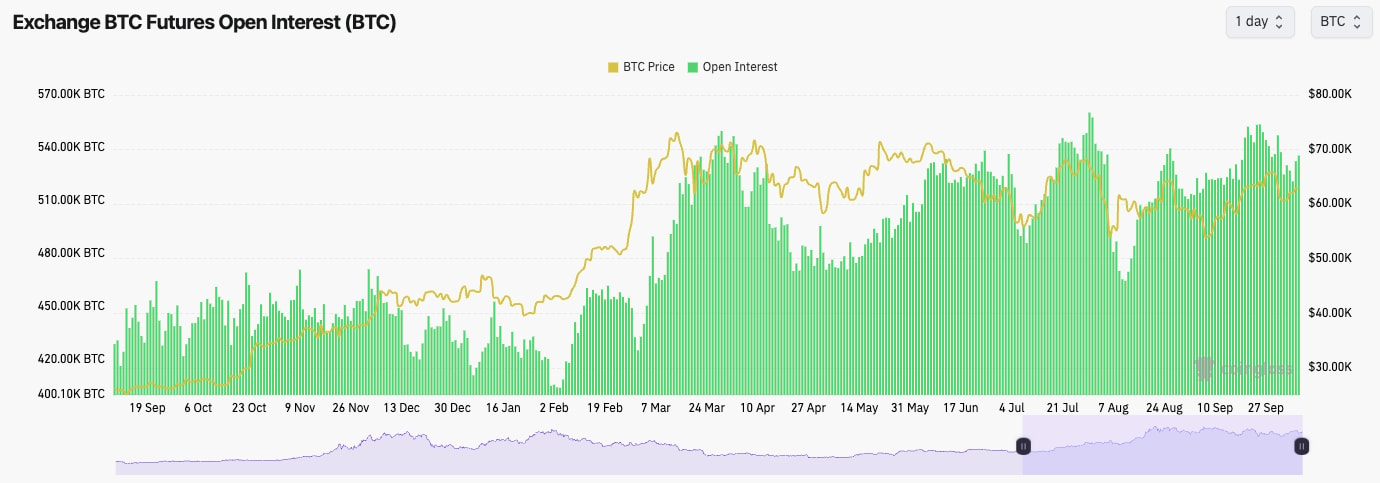
- Interestingly, Funding Rates have been positive, but they've fluctuated, as Traders have tried Shorting local tops, only to then be blown out of their Shorts just a few hours later, driven by a Spot bid.
- Open Interest is up over the last day but still not at levels that would suggest it's overheated to the upside.
- Overall, BTC isn't overheated here, and from a mechanic's perspective, it could continue to grind higher.
Technical analysis
- After BTC printed the higher high, it pulled back to close to our support area (the Yellow box).
- Price has since bounced from this support area and retested the horizontal resistance of $63,400, where price continues to struggle to climb back above.
- In terms of support, the area between $60k and $62k is likely strong support. We consider the bullish structure to be intact as long as the price remains above $57k.
- On the upside, $63,400 is the local horizontal resistance, with $68,900 being the major resistance beyond that.
- The RSI has reset but is beneath the Moving Average.

- Next few days prediction: Neutral ($62k to $64k range)
- Next 7 days prediction: Bullish
- Next 7 days price target: $66k
Cryptonary's take
Price may be subdued in the run-in to Thursday's inflation data. A positive print (lower inflation) will likely help Bitcoin, and risk assets generally break to the upside, while a negative print (higher inflation) will likely negatively impact Bitcoin. It's possible we will see a few days of chop between $62k and $64k until Thursday's inflation data. We're expecting the inflation data to come in line, and Bitcoin potentially reacts positively to this.ETH:
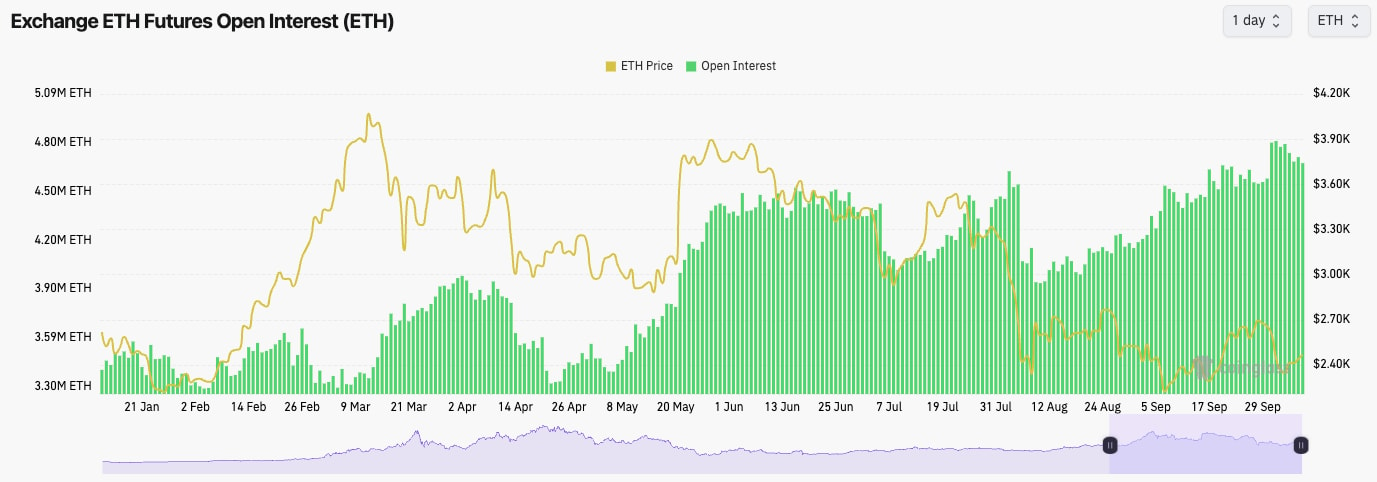
- Like BTC, ETH's Funding Rate has been positive but fluctuated.
- Open Interest kicked up a week ago, but it has downtrended slightly since ETH dropped from $2,700.
Technical analysis
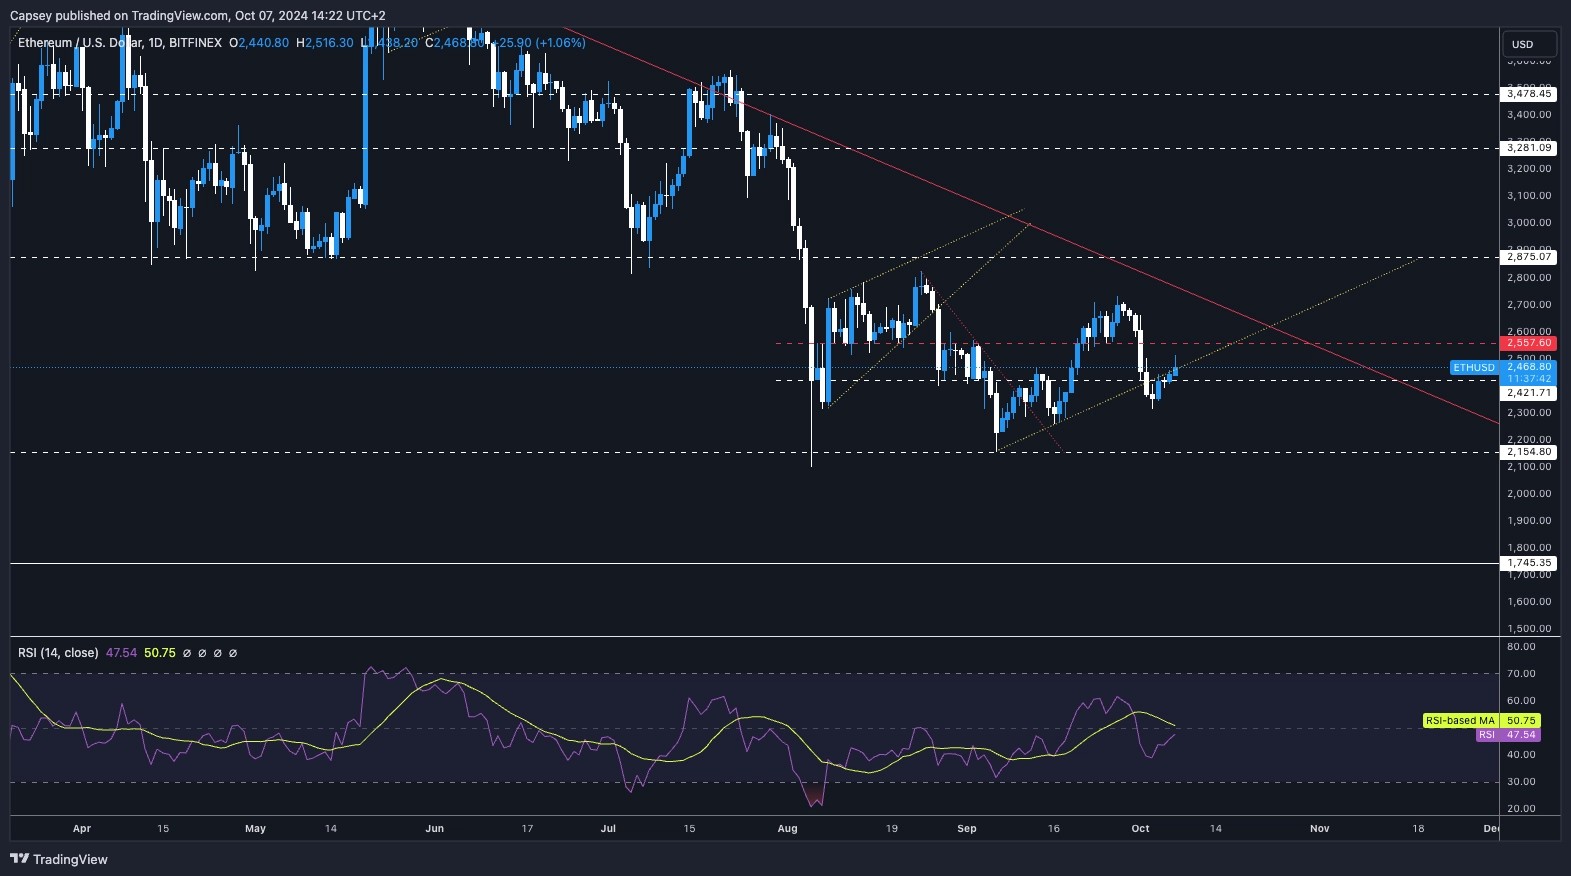
- Price-wise, ETH continues to struggle and is not showing strength against other assets.
- Having lost the horizontal level of $2,557, ETH broke below its local uptrend and is now battling to reclaim it.
- To the downside, there is local support at $2,420 that we expect to hold. The major support is at $2,150; we don't expect that to be retested.
- To the upside, the clear level to reclaim back above is $2,557, with the major resistance beyond that at $2,875.
- The RSI is back to middle territory but beneath the Moving Average.
- Next few days prediction: Neutral ($2,300 to $2,557 range)
- Next 7 days prediction: Neutral-to-bullish
- Next 7 days price target: $2,557 to $2,700 range reclaim
Cryptonary's take
ETH just continues to underperform, and with other Majors (BTC and SOL) having reclaimed some supports and now in better areas of their price ranges, ETH still struggles beneath $2,557, with its better/upper range being between $2,557 and $2,875.Until ETH can break out of $2,557 and also break out of the main downtrend line (red line), the case for continuing to hold ETH against other assets is becoming a harder argument. We expect ETH to chop between $2,300 and $2,557 over the next few days. If we see positive inflation data on Thursday, this may help ETH break out above $2,557.
SOL:
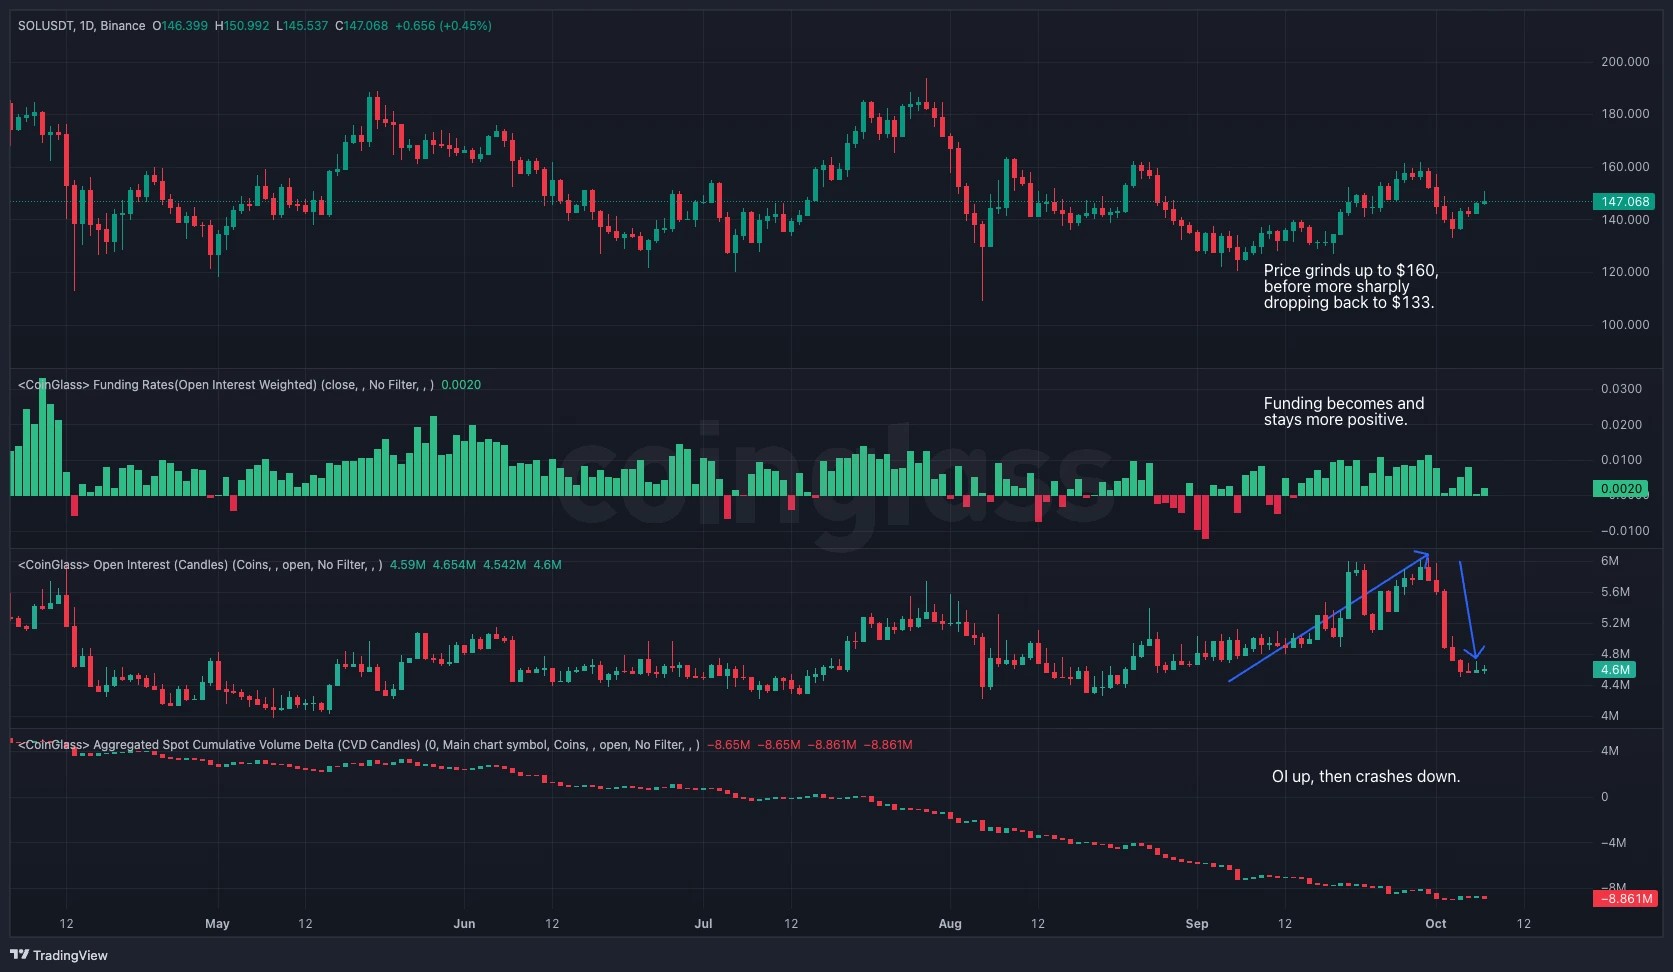
- As the price increased to $160, Open Interest increased considerably as Funding increased. But, this wasn't followed by a Spot bid, which led to an over 20% decrease in OI as late Longs were flushed out.
Technical analysis
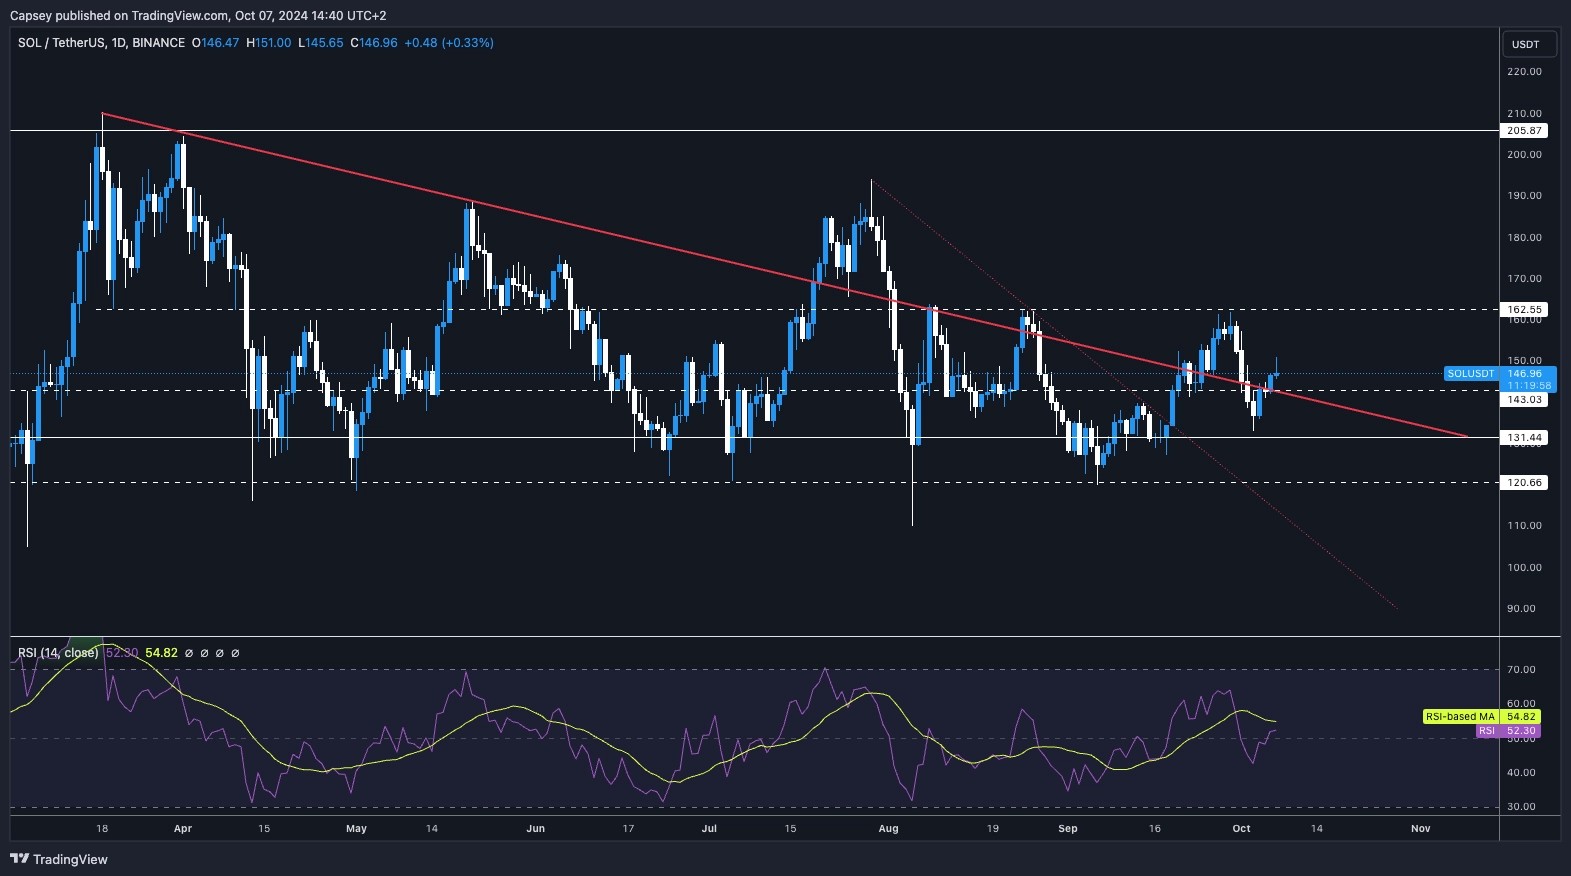
- SOL is still in its range between $120/$131 support to $162 resistance.
- However, SOL is now back above its main downtrend line and above the local horizontal resistance of $143.
- To the upside, the local resistance is $162, and the more major resistance is $185.
- To the downside, we expect $120 to $131 to continue to act as a strong support zone for price.
- The RSI is similar to BTC and ETH's, back in middle territory but beneath its Moving Average.
- Next few days prediction: Neutral ($137 to $162)
- Next 7 days prediction: Bullish
- Next 7 days price target: $162
Cryptonary's take
In all fairness, SOL itself has been quite boring recently, yet the ecosystem continues to see great gains, particularly in the Meme space. Our expectation is that over the coming days and weeks, SOL might remain range-bound, but we expect once SOL breaks out of $162, that'll be the bullish reversal that'll send the price back to $200.We're expecting further chop over the coming days, but in this higher range, between $143 and $162. If the Inflation data is positive, that might be enough to see SOL breakout of $162, but we'd at least a retest of $162 on positive Inflation data.
WIF:
- WIF is one we call perfectly. We expected a pullback to the $1.96 to $2.20 zone (check prior Market Direction). WIF pulled back to $196 and bounced perfectly from that level.
- The price has broken out of the main downtrend line, and it's back above $2.20, and it is now resetting the prior highs at $2.60.
- Beyond the current price, $3.05 is the more significant horizontal resistance.
- On the downside, we'd expect $1.96 to $2.20 to continue to be a strong support zone, but the likelihood is that $2.20 would be enough support on its own.
- On the Daily, the RSI is close to overbought territory, and it has put in a bearish divergence (higher high in price and lower high on the oscillator).

- Next few days prediction: Neutral ($2.20 to $2.70)
- Next 7 days prediction: Bullish
- Next 7 days price target: $3.05
Cryptonary's take
RSI aside, WIF looks very bullish. However, it may be the case that the bearish divergence needs to be reset, meaning that WIF may need a small period of consolidating in the mid-$2s. However, it's possible the chart and market structure overrides the bearish divergence on the RSI here. Therefore, we're constructive.We'd be looking to add WIF on any major pullbacks. Over the coming days, we may see some consolidation in the mid-$2s, with prices potentially breaking out beyond Thursday if we see positive Inflation data on Thursday.
POPCAT:
- Another that was called perfectly in the last Market Direction; 'we would expect that if the wider market moves back up to the recent highs, this might provide POP with the ammunition needed to break higher and finally substantially clear back above $1.00. Positive labour market data on Friday could give us this.
- POP held fantastically beneath $1.00, ranging for two weeks between the mid $ 0.80 and $1.05. Friday's positive labour market data was the catalyst we needed to see POP finally break above $1.10 and go into price discovery.
- Charting-wise, we're now in a new range.
- The RSI is very overbought on the Daily timeframe, printing 78. The last time we saw this was when the price broke above $0.02.
- When a large move like this happens in a 'Blue Chip Meme, 'it's normal to see traders profit-take and, therefore, price potentially pull back a tad.
- In terms of downside, we're used to huge moves, but we'd expect $1.00 to hold as new support. We'd also be somewhat surprised to see this level even be retested again.

- Next few days prediction: Bearish ($1.20 to $1.40)
- Next 7 days prediction: Neutral
- Next 7 days price target: $1.40
Cryptonary's take
In terms of calling POP here, it's difficult as it's in price discovery. Despite indicators being overbought, if the market runs again, the price could just continue into the $1.60 to $1.80 range, although we'd expect this to be a local top for the time being if this were to happen.But, indicators are overbought here, so it's possible we see a pullback from current prices as traders book profits. This wouldn't convince us to sell Spot bags, though, as we think mid and long-term, there's a long way to go here.
Recommended from Cryptonary


