Save 23% ($351) & Get a Free 1-1 Call with our Team ⏰ : 0d 2h 59m 43s
Shiba Inu (SHIB) price prediction
Shiba Inu price prediction varies a lot due to its meme roots and big community, but it still reached an all-time high of $0.00007157. As it seeks to rival Dogecoin, Shiba Inu’s price trends remain unpredictable, and understanding its movements is crucial for potential investors.
We at Cryptonary provide you with the most accurate price prediction for all sorts of coins, including Shiba Inu. You can also request an on-demand SHIB price prediction by joining our Discord Community.
Our price prediction model
We take a different route from others, avoiding automated methods as they often lead to incorrect predictions. Accurately predicting the price of a cryptocurrency involves considering a variety of factors.
That’s why our team of Cryptonary analysts thoroughly research each cryptocurrency, offering you a well-detailed price prediction based on technical analysis. This helps you make better-informed decisions for maximising your profits. Our predictions rely on solid technical analysis rather than general opinions or market sentiment. Additionally, we provide services like:
- Market updates: Shared several times a week, focusing on key macroeconomic indicators.
- Market directions: Insights into current market conditions and trends.
- On-demand analysis: Tailored analysis of specific coins, provided on request.
Now, let’s dive into our Shiba Inu price prediction.
Shiba Inu Struggles in Key Range
19 February 2025Overview
Shiba Inu ($SHIB) failed to hold above the $0.000016 level and remains inside a broader downtrend. The asset continues to respect the orange downtrend trendline, which dictates price action in the daily timeframe. Currently, Shiba Inu is trading inside a defined range, struggling to reclaim lost support.For now, SHIB is caught between $0.000016 as resistance and $0.000011 as a major support level, which is where the price wicked last time before bouncing back. Whether it can hold within this range or break below will dictate its next move.
Analysis & key levels
- Support levels:
- $0.0000135 - $0.0000128: A minor support zone where price could consolidate.
- $0.000011: A major historical support, where SHIB last bounced from.
- Resistance levels:
- $0.000016: The first hurdle for SHIB to break.
- $0.0000175 - $0.000018: A stronger resistance confluenced by the downtrend trendline.
- Market structure:
- Still in a downtrend as long as the price stays under the orange trendline.
- Breaking above $0.000016 would be the first sign of reversal, but confirmation would require a move beyond $0.000018.
Potential scenarios
- Bullish scenario:
- SHIB bounces inside the range and reclaims $0.000016, leading to a potential breakout above $0.0000175.
- A break above the downtrend trendline could open doors to higher price targets.
- Bearish scenario:
- SHIB fails to hold current prices and falls at the bottom of the range.

Cryptonary's take
Shiba Inu is currently in a tight spot, trading inside a key range, but still respecting its downtrend structure. The reaction around $0.000011 - $0.000012 will be crucial in determining the next move. For now, there is no sign of a trend reversal. A break above $0.000016 is needed for any upside potential while losing $0.000011 could bring further downside pressure.We remain neutral/bearish for now, keeping an eye on how the rice reacts around these critical levels.
SHIB battles resistance for breakout
07 February 2025Overview
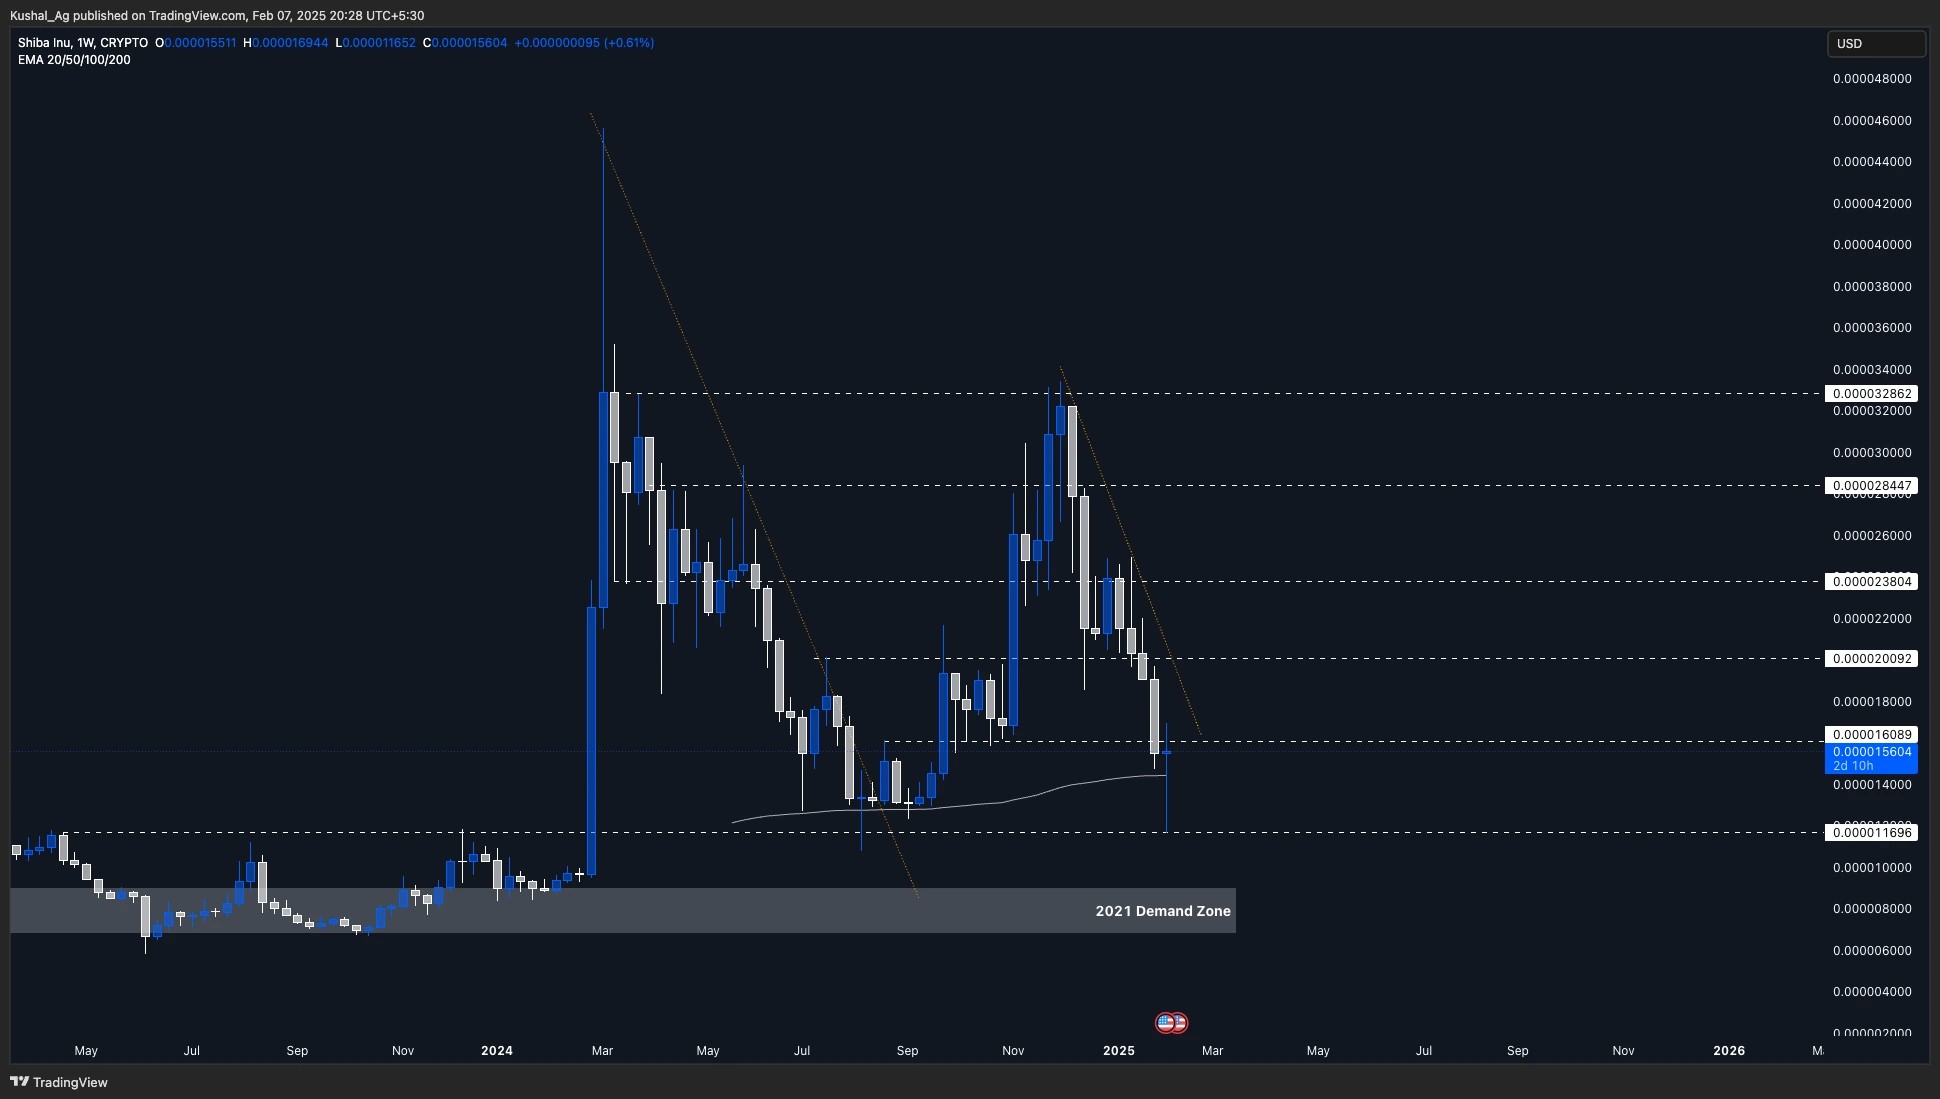
Shiba Inu ($SHIB) has experienced a significant retracement from its December 2024 highs of $0.0000328, now trading around $0.0000156. The 65% decline has brought SHIB back to key long-term support levels, where it has started to show signs of recovery. On the weekly time frame, SHIB is currently testing crucial technical levels, particularly the 200 EMA, which previously acted as a launchpad for a major rally.Analysis & key levels
Support levels:- $0.0000144 (200 EMA - Weekly): Historically, this level has been a strong support zone, with SHIB bouncing 160% the last time it traded around this area in July-August 2024.
- $0.0000116: This level acted as the recent local bottom, from which SHIB saw a strong wick reaction.
- $0.0000160: SHIB is currently attempting to reclaim this level, which is acting as immediate resistance.
- $0.0000200: If SHIB successfully breaks above $0.0000160, it will enter a wider range, where the next major resistance sits at $0.0000200.
- Orange downtrend line: SHIB has been trading below a long-term downtrend resistance, which aligns closely with the $0.0000200 resistance zone. A breakout above this will be a key bullish signal.
Potential scenarios
- Bullish case: If SHIB reclaims $0.0000160, it could range between $0.0000160 - $0.0000200 before attempting a breakout above the downtrend trendline. Holding above this range could open up a move toward higher levels.
- Bearish case: If SHIB fails to reclaim $0.0000160, it may retest the $0.0000144 (200 EMA - Weekly). Losing this level would shift focus toward the $0.0000116 support zone. A break below this could bring the 2021 demand zone into play.
Cryptonary’s take
SHIB is currently testing long-term support areas while consolidating below key resistance zones. The strong reaction from $0.0000116 suggests solid buyer interest, but reclaiming $0.0000160 and breaking the downtrend resistance is essential for a bullish continuation.While Bitcoin’s dominance and overall market sentiment will influence SHIB’s next move, holding above the 200 EMA on the weekly time frame remains crucial. If SHIB can flip key resistance levels, a reversal could be on the horizon.
SHIB seeks recovery
28 January 2025Overview
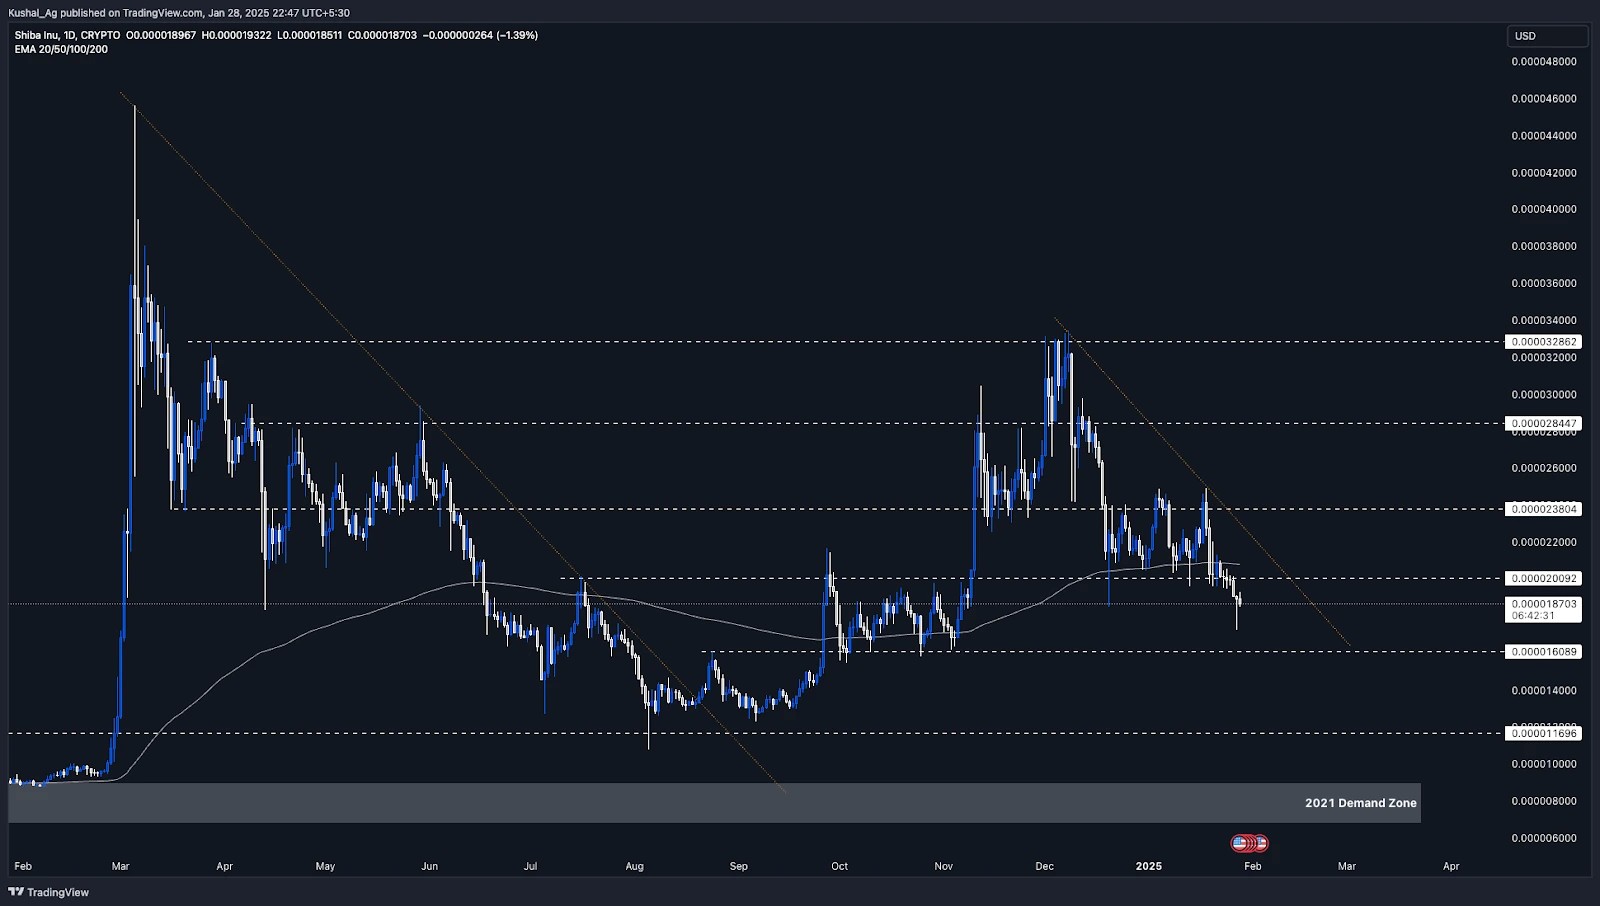
Shiba Inu has broken down below key support levels on the daily time frame, including $0.00002 and the 200 EMA, and is currently trading at $0.0000198. SHIB is now trading within the range of $0.000016 to $0.00002, indicating increasing downward pressure as it struggles to reclaim lost support.Analysis
- Current price action:
- SHIB is trading above the $0.000016 support zone, a critical level that has historically provided a base for price bounces.
- The break below the 200 EMA adds bearish weight, signalling a potential continuation of the current downtrend if support levels fail.
- Trend formation:
- A descending orange trendline highlights SHIB's pattern of lower highs and lower lows, reinforcing the bearish structure.
- Breaking above this diagonal resistance would indicate a shift in sentiment and pave the way for recovery.
- Key levels:
- Supports:
- $0.000016: Immediate support; losing this level could lead to further decline.
- Resistances:
- $0.00002: Immediate resistance level that needs to be reclaimed to neutralize bearish momentum.
- $0.0000238: A critical level to flip for bullish continuation in the medium term.
- Supports:
Potential scenarios
- Bullish case:
- If SHIB holds above $0.000016 and manages to break the orange diagonal trendline, we might see a recovery, followed by an attempt to reclaim $0.0000238.
- Bearish case:
- Failure to hold the $0.000016 support zone could lead to further downside, potentially testing deeper levels below $0.0000119.
Cryptonary's take
Shiba Inu is currently in a pivotal phase, with key supports being tested and bearish momentum prevailing. For SHIB to regain investor confidence, it must break above the descending trendline and reclaim the 200 ema on the daily timeframe for the least, signalling a potential trend reversal.SHIB hold pivotal levels amid volatility
21 January 2025Overview
Shiba Inu ($SHIB) has been consolidating within a defined range over the past 30 days. This consolidation is supported by the 200 EMA on the daily time frame, which provides a solid floor for the price action. Currently trading at $0.000021, Shiba Inu is positioned at a critical level where any breakout or breakdown could lead to significant price movement.Analysis
Current price action
- Consolidation phase: SHIB has been trading sideways for approximately a month, holding well above the 200 EMA, which is currently at $0.0000208. This suggests the asset is trying to build a base for a potential move.
- Important levels:
- Support levels: The $0.000020 level is a strong immediate support zone. Below this, SHIB has significant support at $0.000016, which would come into play if the 200 EMA fails to hold.
- Resistance levels: On the upside, resistance lies at $0.0000238, with further resistance at $0.0000284 and $0.0000328.
- Important levels:
Potential market drivers
- Technical strength: Holding above the 200 EMA often indicates bullish potential, provided the price doesn't dip below this key level for an extended period.
- Sentiment: As the broader market attempts recovery, meme coins like Shiba Inu could see renewed interest, especially if Bitcoin and Ethereum maintain their upward trajectories.
Key zones
Support
- $0.0000208 (200 EMA on the daily)
- $0.000020
- $0.000016
Resistance
- $0.0000238 (Immediate resistance)
- $0.0000284
- $0.0000328

Cryptonary's take
Shiba Inu ($SHIB) is at a pivotal juncture, consolidating above the 200 EMA while maintaining its status as a leading meme coin by market cap. With a solid base forming at $0.000020, SHIB presents an interesting setup for both bulls and bears. A break above $0.0000238 could trigger a rally toward $0.0000284 and higher. Conversely, losing support at $0.000020 might lead to a retest of lower levels near $0.000016.For now, patience is key as SHIB continues to consolidate. The next significant move will likely depend on broader market sentiment and whether SHIB can reclaim its bullish momentum.
SHIB eye critical support zones
7 January 2024Overview
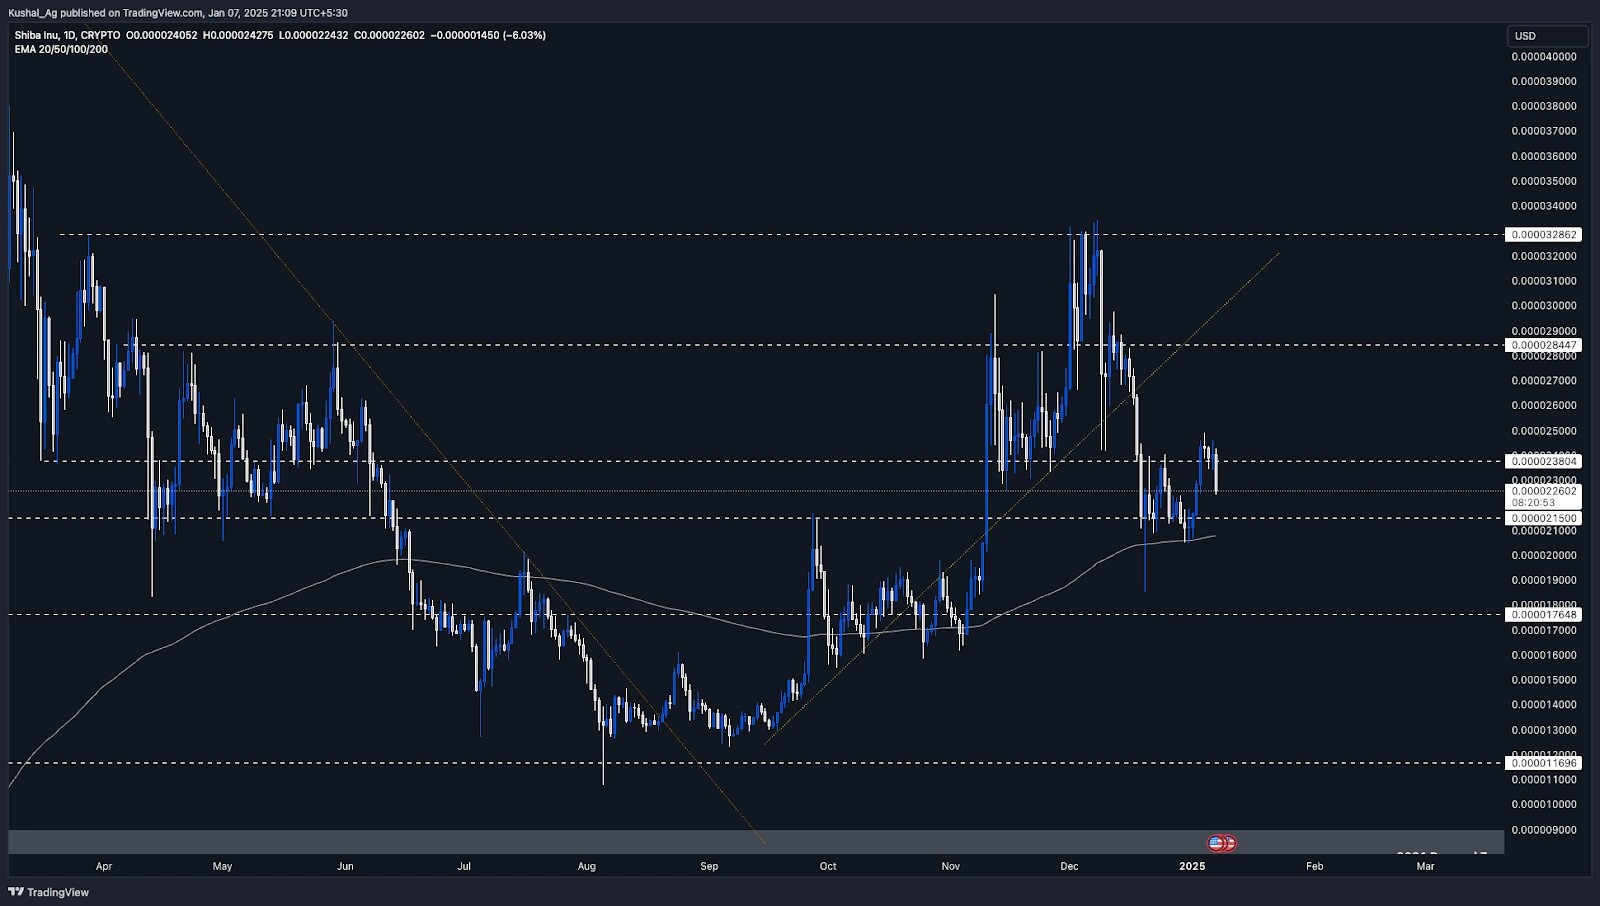
Shiba Inu ($SHIB) has seen a slight pullback from its previous support at $0.0000238 and is now trading at $0.0000227, fluctuating between the $0.0000238 and $0.0000215 range. The asset remains above its 200 EMA on the daily time frame, positioned at $0.00002, providing a strong support level for the coin amidst the ongoing consolidation phase.Despite breaking below $0.0000238, $SHIB is stabilizing and could see renewed momentum as it consolidates within this range.
Analysis
Support levels:
- $0.0000215:A critical support zone for $SHIB, aligning with recent price action and indicating strong buyer interest at this level.
- 200 EMA (Daily): Positioned at $0.00002, this level serves as a dynamic support and adds a significant cushion for $SHIB in the event of further downside.
Resistance levels:
- $0.0000238:Previously acting as support, this level is now a resistance that $SHIB needs to reclaim to signal short-term strength.
- $0.0000284:The next major resistance level is on the upside.
- $0.0000328:A critical long-term resistance zone, where $SHIB faced rejection in early December.
Price structure:
$SHIB is currently consolidating between $0.0000238 and $0.0000215, forming a range-bound structure. The 200 EMA on the daily time frame provides an additional layer of support at $0.00002, acting as a safety net during potential market retracements.If $SHIB reclaims $0.0000238, it could signal the start of a short-term recovery, with potential upside targets at $0.0000284 and $0.0000328.
Cryptonary's take
Shiba Inu ($SHIB) is holding key levels despite breaking below the $0.0000238 support zone. The 200 EMA on the daily time frame, at $0.00002, continues to act as a solid base for the asset, reinforcing its bullish potential.To regain upward momentum, $SHIB needs to reclaim $0.0000238 and sustain above it, paving the way for a move toward $0.0000284 and $0.0000328. Consolidation within the current range could provide the necessary foundation for a stronger breakout.
SHIB Consolidates Above $0.0000215 Zone
24 December 2024Overview
Shiba Inu ($SHIB), one of the most prominent meme coins, has retraced alongside the broader meme coin sector. After reaching a local high of $0.000033 on December 8th, $SHIB experienced a significant 44.59% pullback, making a low of $0.0000185.Currently trading at $0.000022, Shiba Inu has shown strength by holding key support levels and reacting strongly from its technical zones. The asset has maintained its structure despite breaking the yellow uptrend trendline on the downside, and it remains positioned for a potential recovery if it consolidates above critical levels.
Analysis
On the daily timeframe, $SHIB's pullback has tested and held critical levels, reinforcing its bullish structure:Support levels
- $0.0000215: This key support zone, mentioned in previous analyses, has held strongly during the recent retracement.
- 200 EMA (Daily): Currently trading at $0.00002, the 200 EMA acted as dynamic support during the pullback, further solidifying the $0.0000215 area as a local bottom.
- $0.0000176: A strong lower support zone in case of another broader market correction, though this scenario seems unlikely given the current strength.
Resistance levels
- $0.0000238: The first immediate resistance on the upside.
- $0.0000284: The next significant resistance zone, marking a key level for further bullish continuation.
- $0.0000328: The top-side resistance, which acted as the rejection zone during the previous rally. Breaking this level could unlock higher targets.
Potential scenarios
If $SHIB consolidates between $0.0000215 and $0.0000238, it could build momentum to reclaim the yellow uptrend trendline, which could act as minor resistance initially. A breakback above this trendline and $0.0000328 would signal a bullish continuation, potentially revisiting the March 2024 high of $0.0000454.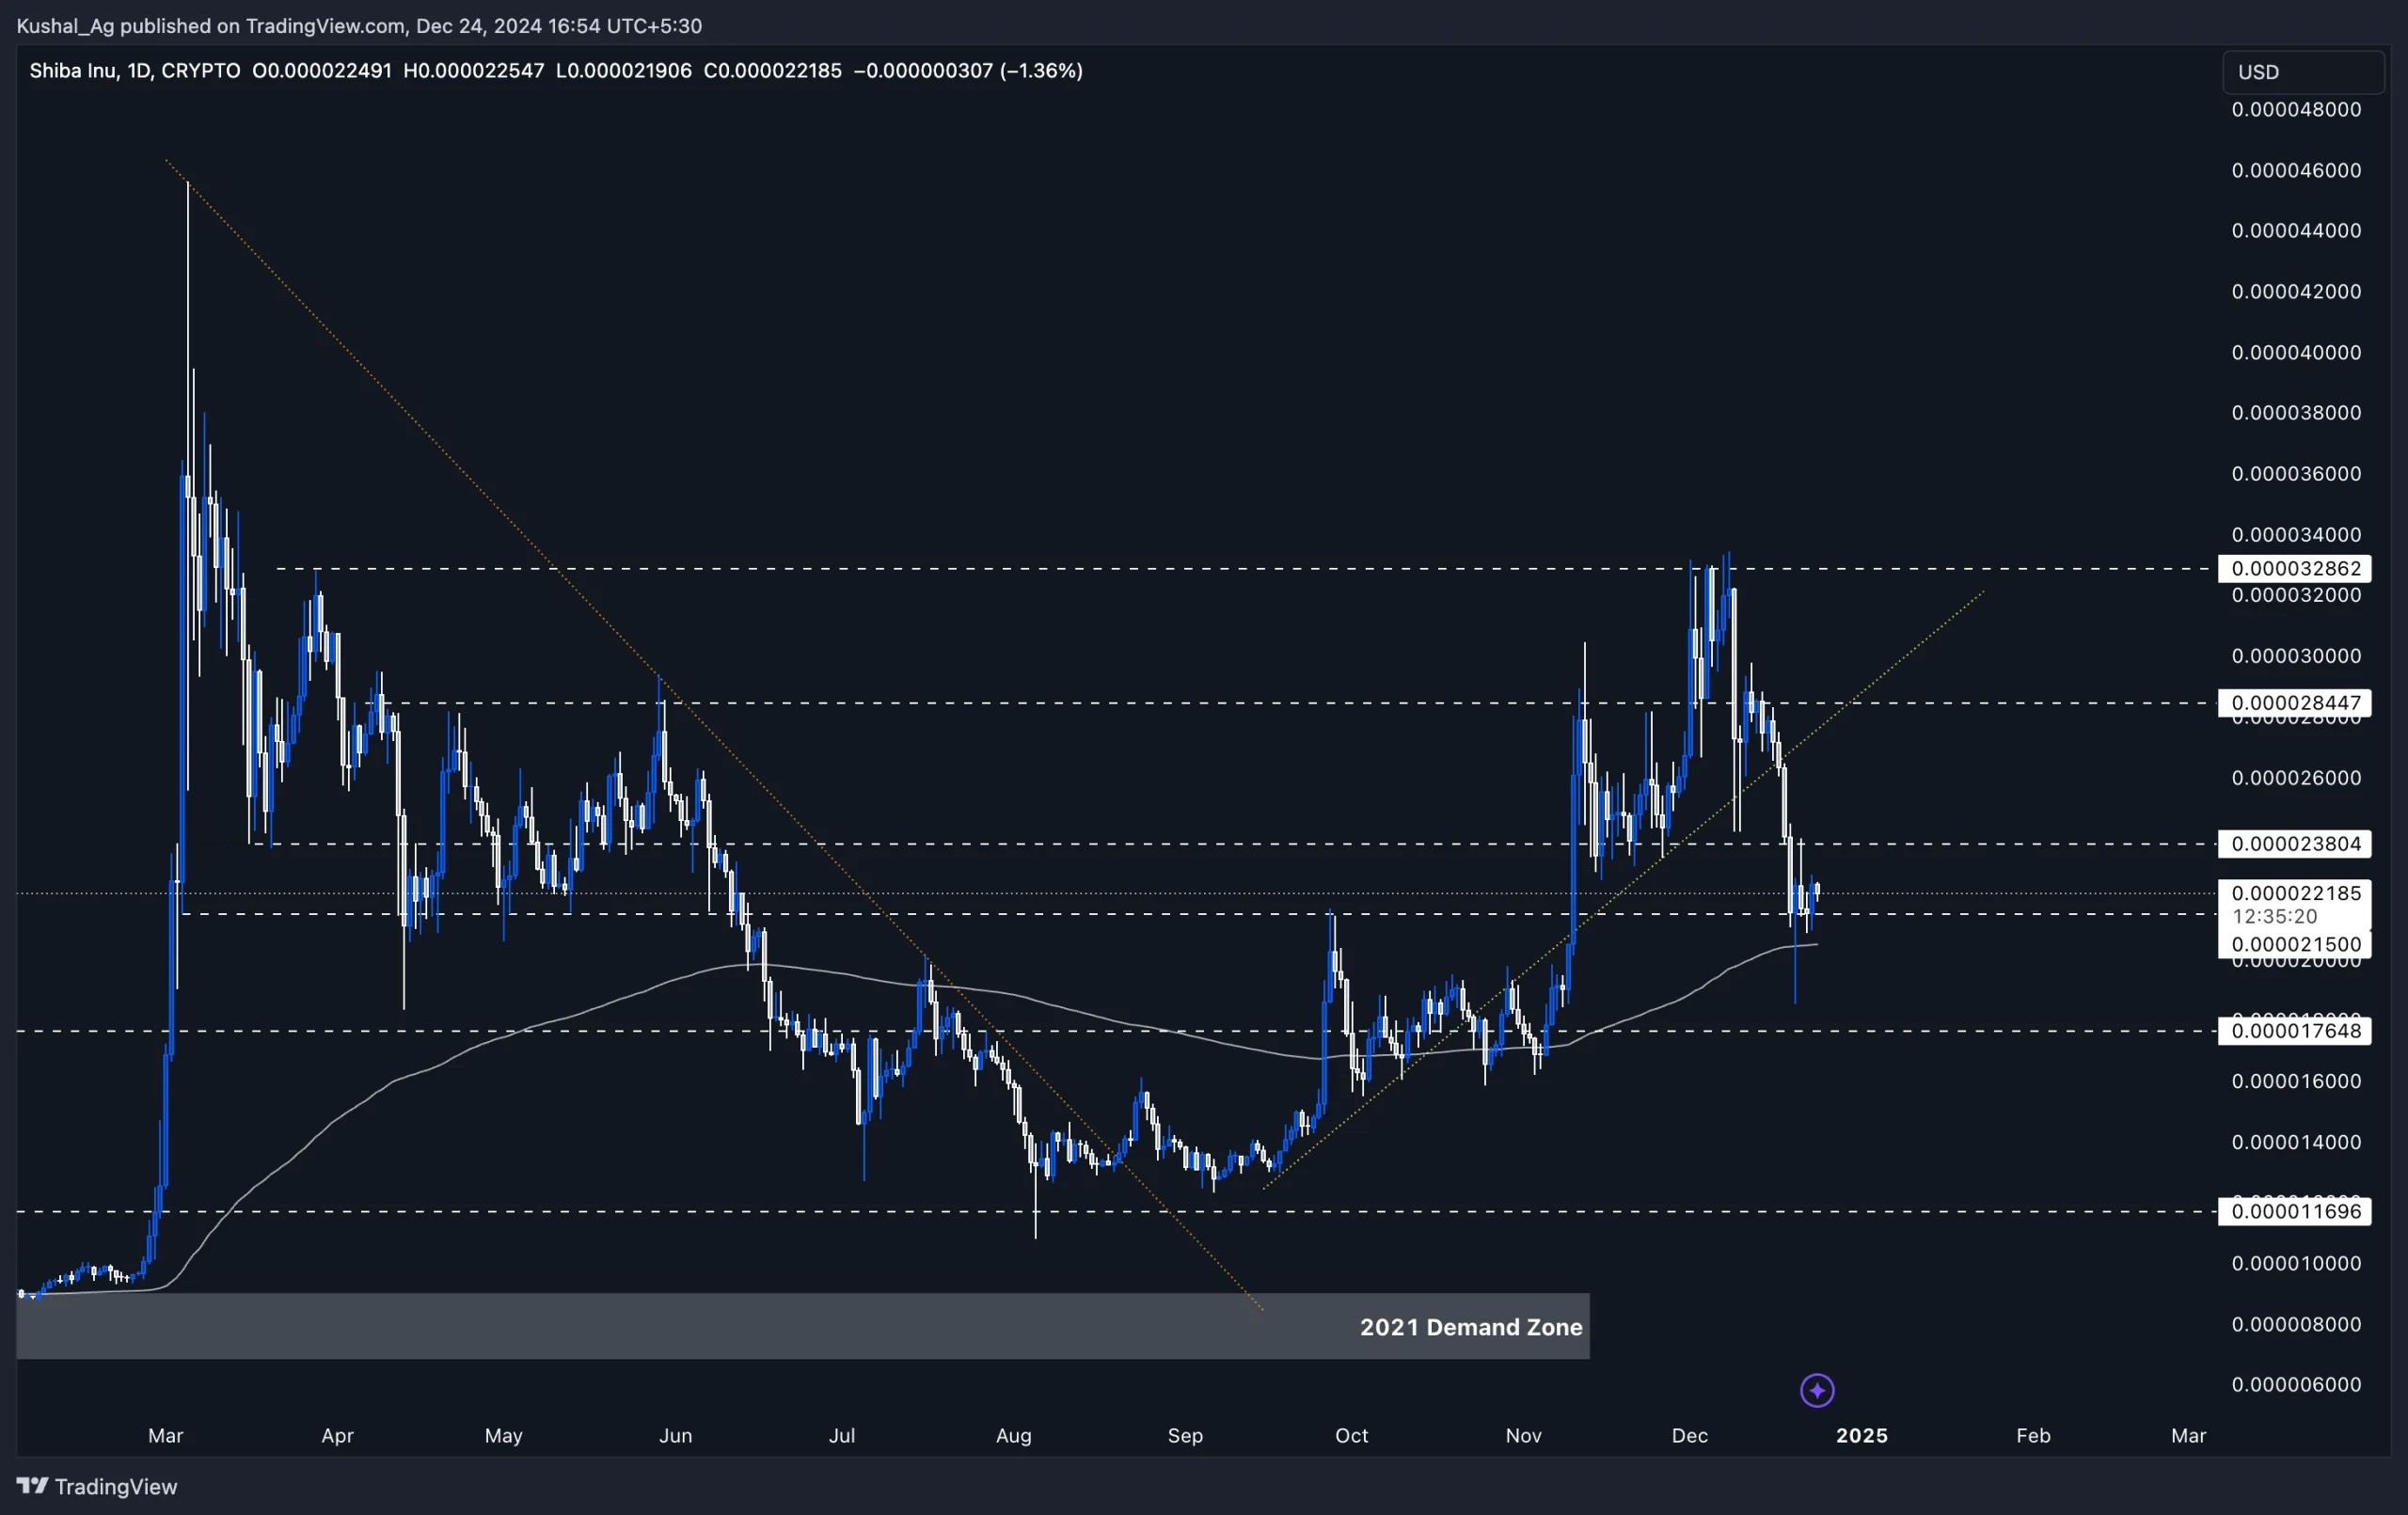
Cryptonary's take
Shiba Inu ($SHIB) has demonstrated strength by maintaining support at $0.0000215 and reacting strongly from the 200 EMA. Despite the break below the yellow uptrend trendline, the structure remains intact, and the asset looks poised for consolidation and potential recovery. Holding above the $0.0000215 level and staying above the 200 EMA are critical for $SHIB's bullish case.Breaking above $0.0000238 could pave the way for further upside, with $0.0000284 and $0.0000328 acting as key hurdles. Should these levels be reclaimed, a move toward the March 2024 high of $0.0000454 could be on the horizon.
For now, $SHIB looks solid technically, with its current setup offering favourable opportunities for bullish continuation.
SHIB holds crucial support levels
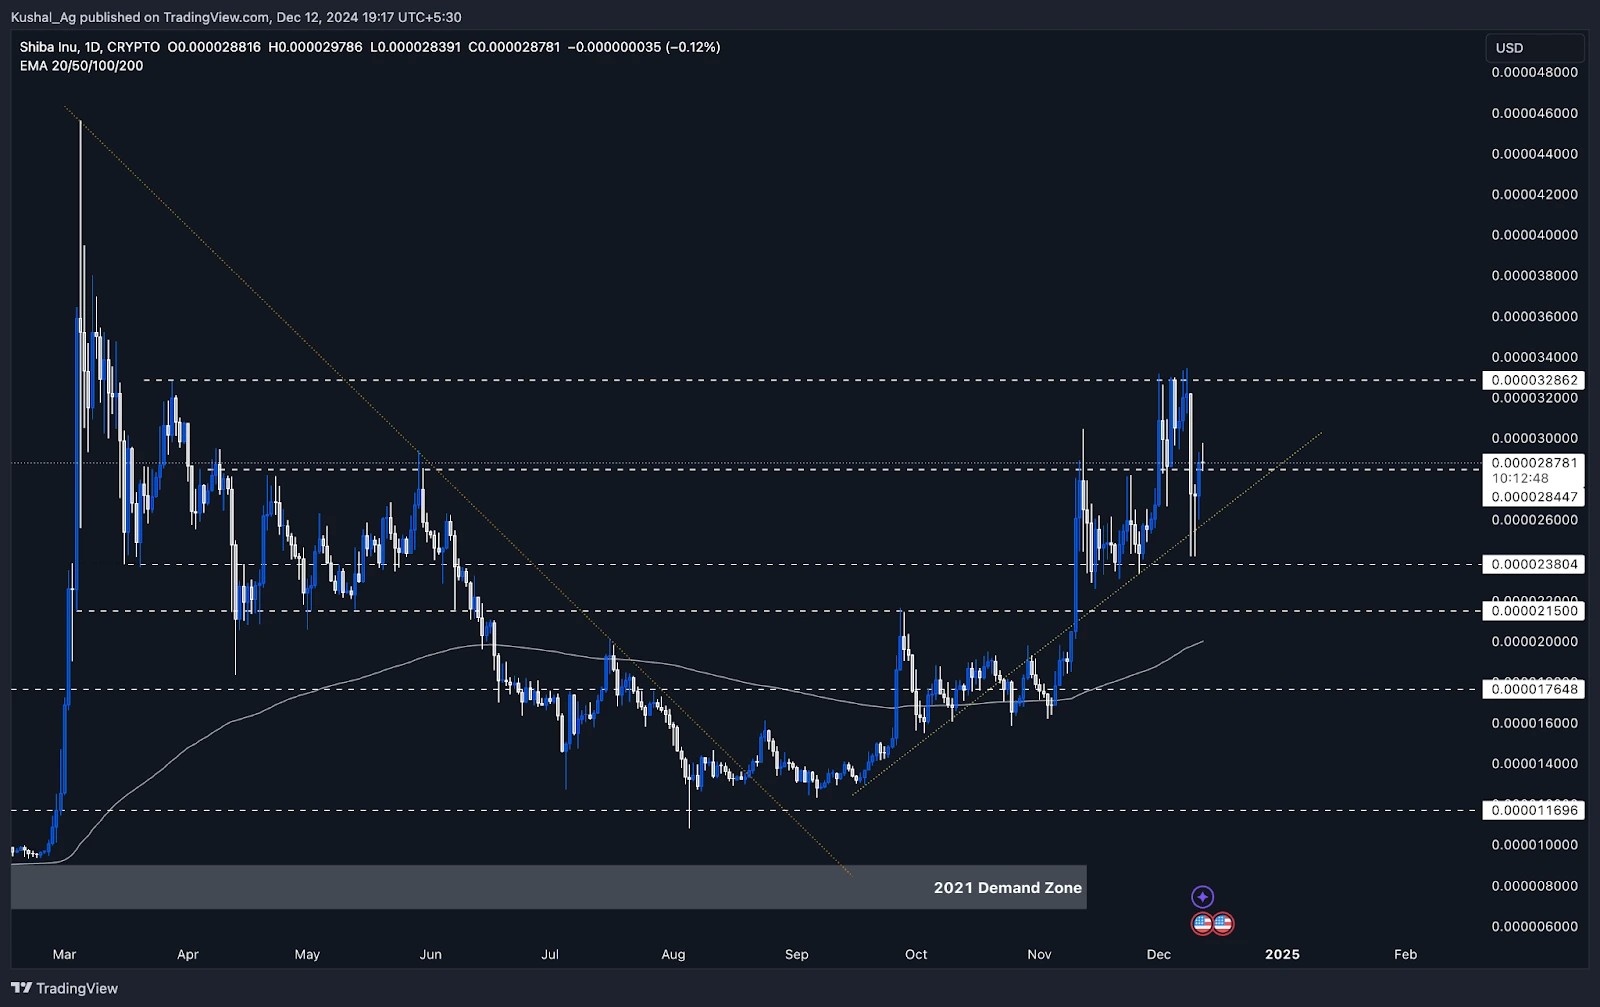
12 December 2024Overview
Shiba Inu ($SHIB), one of the most prominent meme coins, continues to maintain its bullish structure despite the recent market-wide volatility. On the daily time frame, $SHIB is currently trading at $0.0000288, showing strength as it respects its yellow uptrend trend line, which has been a crucial dynamic support level for the asset.The asset recently experienced a 27% retracement, coinciding with broader market weakness, but has quickly reclaimed key support levels, signalling resilience and potential for further upward movement. With critical levels now back in focus, $SHIB appears positioned to consolidate or push higher depending on market sentiment.
Daily timeframe analysis
On the daily time frame, $SHIB continues to respect its yellow uptrend trend line, which has provided strong support during dips. After briefly dropping into the $0.0000238 - $0.0000284 zone, which was a significant area of consolidation in November, $SHIB has reclaimed its position above the $0.0000284 support and is now trading at $0.0000288.The price recently faced rejection at the $0.0000328 resistance, which aligns with previous highs and serves as the immediate upside hurdle for $SHIB. If the price breaks above this resistance with momentum, the next target is the March high of $0.0000456, which could act as the next major resistance on the upside.
Key observations:
- The yellow uptrend trend line has remained intact, indicating that the asset is still in a bullish structure.
- The $0.0000238 - $0.0000284 zone served as a strong accumulation area, reinforcing buyer confidence during dips.
- On the downside, if $SHIB retraces further, it is likely to test the yellow trend line or the $0.0000284 level for support.
Cryptonary's take
Shiba Inu ($SHIB) has demonstrated strong price action in the face of recent market volatility. The asset's ability to hold key levels and respect its uptrend trend line highlights its underlying strength. The consolidation above $0.0000284 and the bullish structure signal that $SHIB remains well-positioned for future upward moves.While $SHIB must still overcome the $0.0000328 resistance to gain momentum, its current positioning makes it an asset to watch closely. Should $SHIB break out of this resistance, the move toward the $0.0000456 March high could present significant opportunities. However, maintaining support above $0.0000284 is crucial to sustaining its bullish momentum.
Shiba Inu holds $0.00000238 support
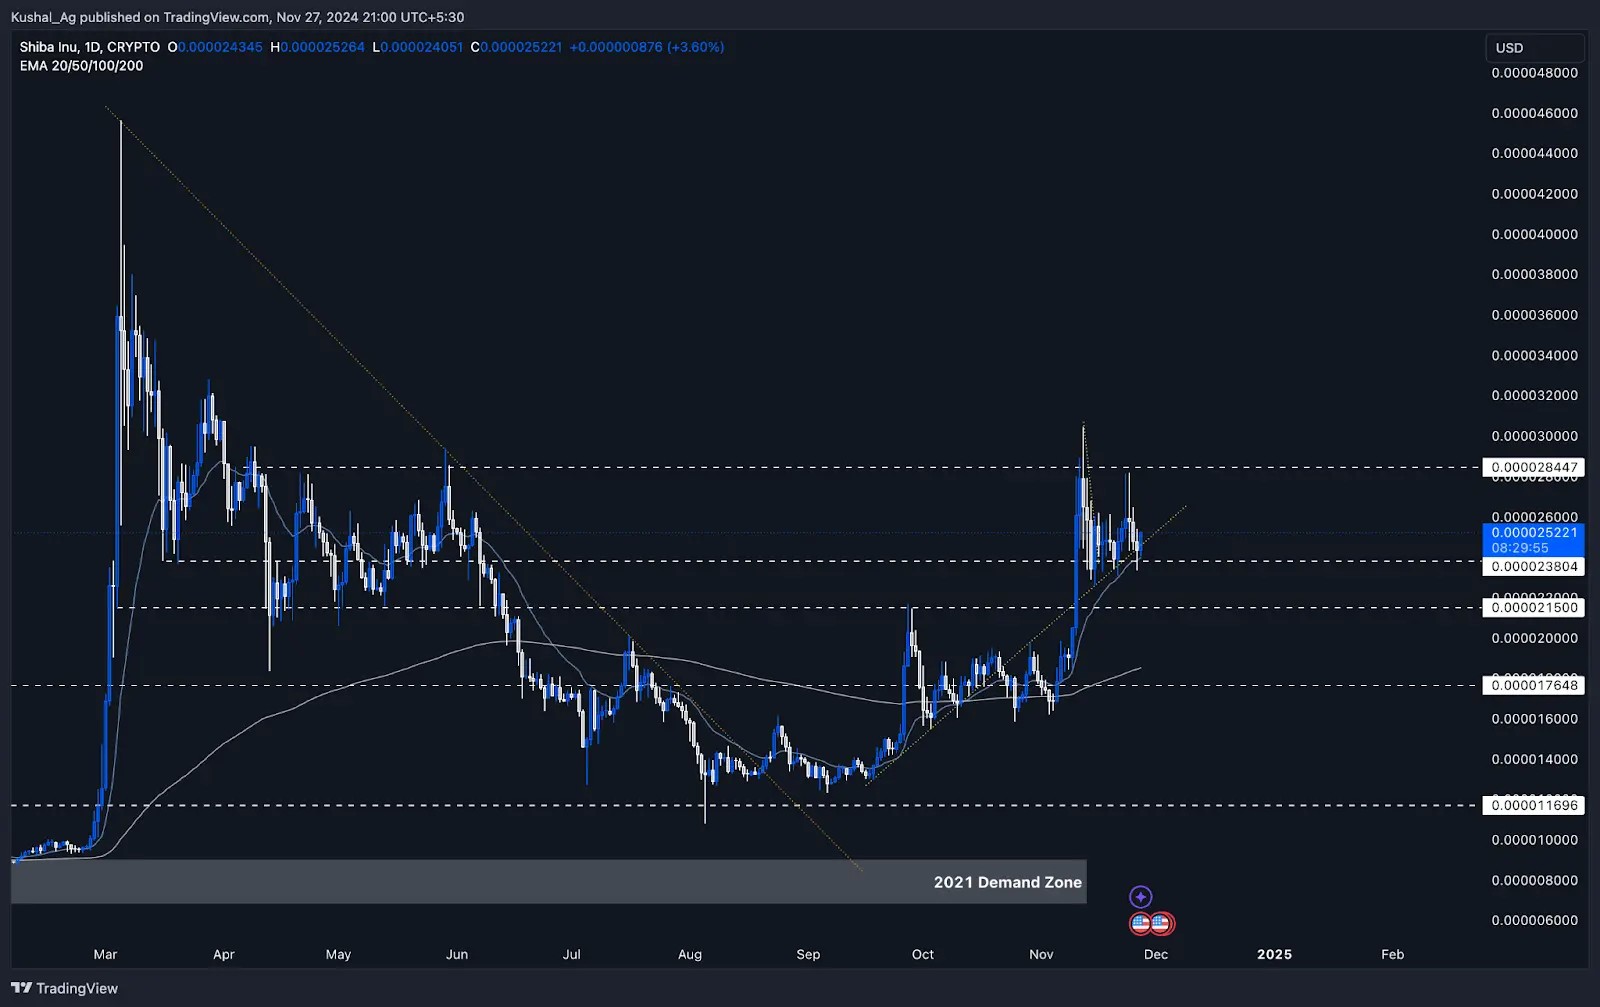
27 November 2024Overview
Shiba Inu ($SHIB) continues to consolidate after its recent rally, holding well above key support levels on the daily time frame. This consolidation phase suggests that the asset is building strength for its next potential move. With strong support aligning at critical zones, $SHIB is maintaining a bullish structure despite broader market fluctuations.Daily time frame analysis
- Support levels:
- $0.00000238: A crucial horizontal support zone that has held firm through multiple tests and has been mentioned in previous analyses.
- 20 EMA at $0.00000239: The 20 EMA aligns closely with the $0.00000238 support, providing dynamic support for the asset.
- Uptrend line: The yellow horizontal trend line adds further confluence, showing that $SHIB is respecting this ascending structure.
- $0.00000215: This level remains fallback support if the $0.00000238 zone is breached.
- Resistance levels:
- $0.00000284: A key resistance level that $SHIB has struggled to break through. A clean break and close above this zone could pave the way for another strong rally.
- Price action has been consolidating in a tight range for about a month, holding above its critical supports while repeatedly testing the $0.00000284 resistance. This extended consolidation is healthy and could lead to a breakout once the price gathers enough momentum.
Cryptonary's take
Shiba Inu ($SHIB) is showing strength by holding above key supports, including the $0.00000238 level, the 20 EMA, and the yellow uptrend line. This consolidation phase indicates that $SHIB is stabilizing, potentially gearing up for a significant move.On the upside, breaking through the $0.00000284 resistance remains crucial for $SHIB to continue its bullish trend. If the breakout happens, it could lead to a rally towards the $0.000003 mark and beyond. On the downside, the $0.00000215 support and the broader trend line provide strong safety nets.
Overall, $SHIB is in a healthy position, consolidating and respecting its bullish structure. Patience will be key as the asset continues to build momentum for its next major move.
SHIB showcase market resilience
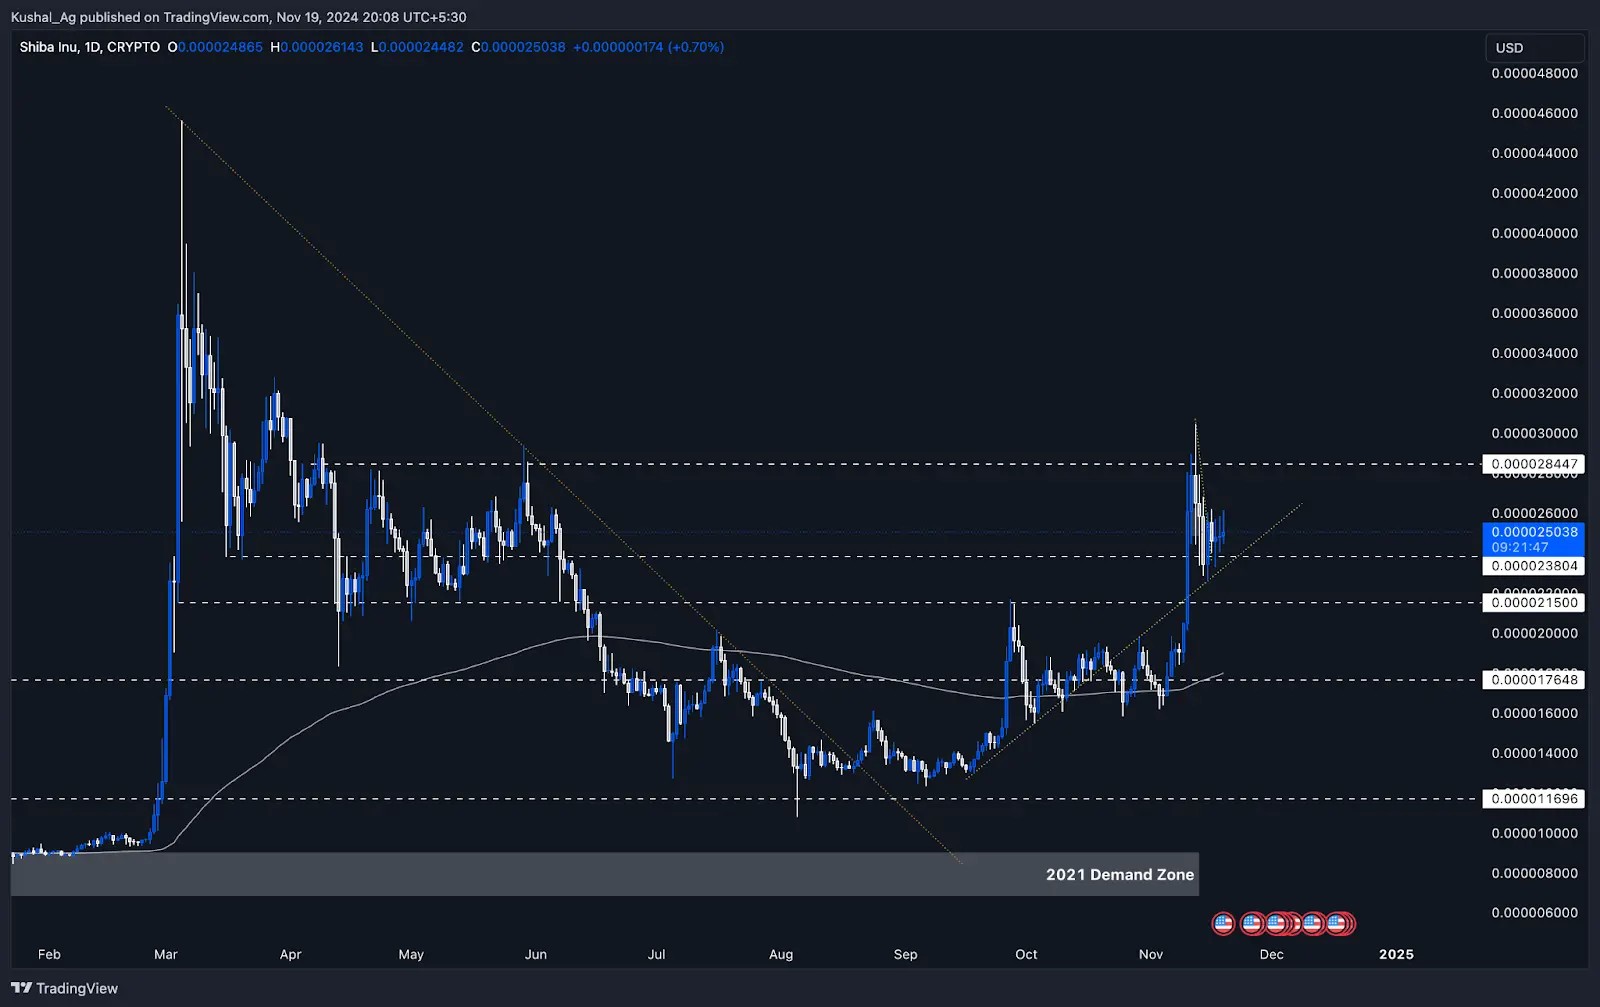
19 November 2024Overview
$SHIB has been consolidating for the past week, following a strong rally from $0.0000176 to $0.00003, where it formed a higher high. Currently trading at $0.000025, $SHIB appears to have regained its bullish momentum, taking support from the yellow uptrend line marked in the chart. This consolidation phase could indicate the potential for another upward move, provided key levels are held.Daily time frame analysis
- Key levels:
- Resistance: The $0.0000284 region is the current resistance for $SHIB on the upside. Breaking and sustaining above this level would open the door for further bullish momentum.
- Support: The $0.0000238 zone is the immediate support. Below that, the $0.0000215 level is a critical area to watch, providing additional support.
- Major support: The $0.0000176 zone aligns with the daily 200 EMA, offering a strong foundational support level in case of a deeper pullback.
- Trendline support:$SHIB has respected the yellow uptrend line, indicating that buyers are actively defending this structure. The trendline continues to act as dynamic support, reinforcing the bullish setup.
- Potential scenarios:
- If $SHIB consolidates and sustains above $0.0000238, it could gain the momentum needed to test and potentially break the $0.0000284 resistance, leading to a move higher.
- A failure to hold $0.0000238 would likely see the price testing the $0.0000215 support zone, where buyers are expected to step in.
Wondering about the latest Shiba Inu (SHIB) price prediction? Explore our in-depth analysis to stay informed!"
Cryptonary's take
$SHIB remains a strong contender in the meme coin space, with a solid structure and key levels to watch. Its ability to hold the uptrend and consolidate within this range suggests that a breakout above $0.0000284 could trigger a new leg higher.However, with the market still prone to volatility, $SHIB must maintain its support levels to avoid deeper retracements. The $0.0000215 and $0.0000176 zones, bolstered by the 200 EMA, provide a healthy base for the asset.
For now, $SHIB is positioned for further gains if it continues to hold its bullish structure. Let's see how the consolidation resolves in the coming days!
The memecoin supercycle is rewriting the rules, offering opportunities that could redefine your investment strategy. Discover why this moment is a game-changer for crypto enthusiasts.
SHIB finds demand zone
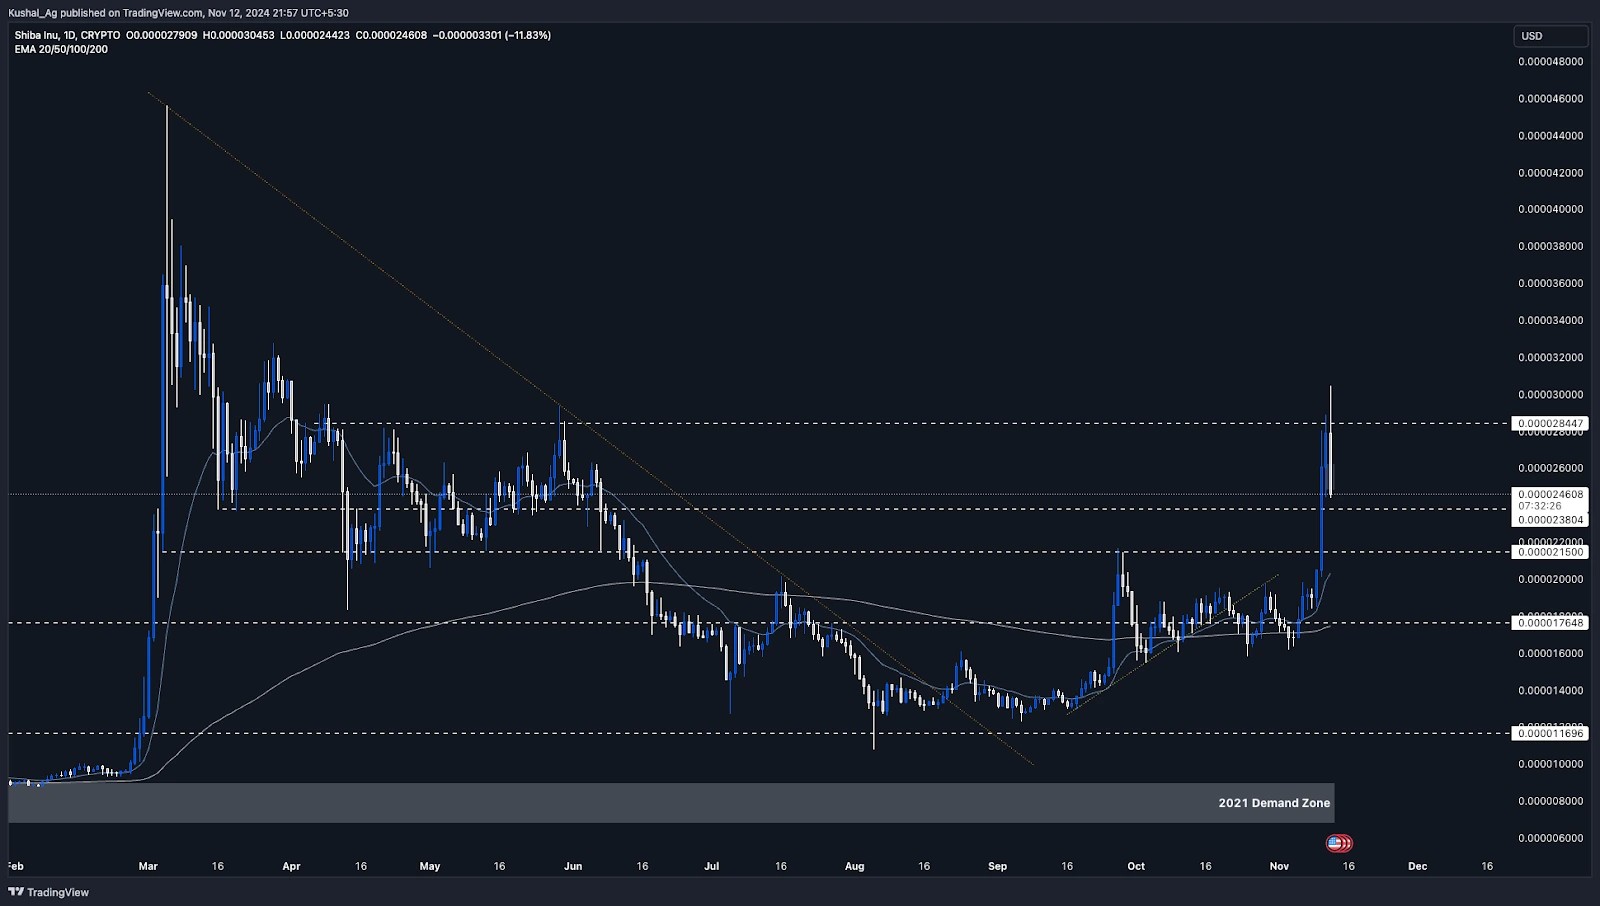
12 November 2024Overview
Shiba Inu ($SHIB), the second-largest meme coin by market capitalization, recently experienced a significant rally, reaching a local high of $0.000003 before pulling back.Today's analysis will focus on the daily and 4-hour time frames, observing potential support and resistance zones as $SHIB undergoes a healthy retracement, with potential consolidation or further moves anticipated.
Daily time frame analysis
- Resistance levels: The $0.00000284 level has been a key resistance for Shiba Inu, as mentioned in our last analysis. Recently, $SHIB briefly touched a high of $0.000003 before pulling back by approximately 18%, highlighting strong selling pressure around these levels. This resistance zone will be important to watch as it may test $SHIB's ability to push higher in the near term.
- Support levels: On the downside, $SHIB currently has two notable support levels:
- $0.00000238 - This level serves as an immediate support zone, potentially cushioning further retracement.
- $0.00000215 - Should retracement deepen, this would be the next major support, providing a potential base for $SHIB.
4-Hour time frame analysis
- Demand zone: On the 4-hour chart, a demand zone has formed between $0.0000026 and $0.00000248, marking an area of buying interest should the price dip again.
- 20 EMA confluence: The 20 EMA on the 4-hour time frame, currently at $0.0000025, aligns with this demand zone, reinforcing the area as a key support level. This alignment of support could play a pivotal role if $SHIB continues to retrace or begins consolidating.
- Structure and momentum: The 4-hour structure has shown a retracement from the recent high, which is a healthy move after such a sharp rally. With the demand zone and 20 EMA providing a buffer, $SHIB remains technically solid within this range, awaiting either a consolidation phase or continued upward momentum.
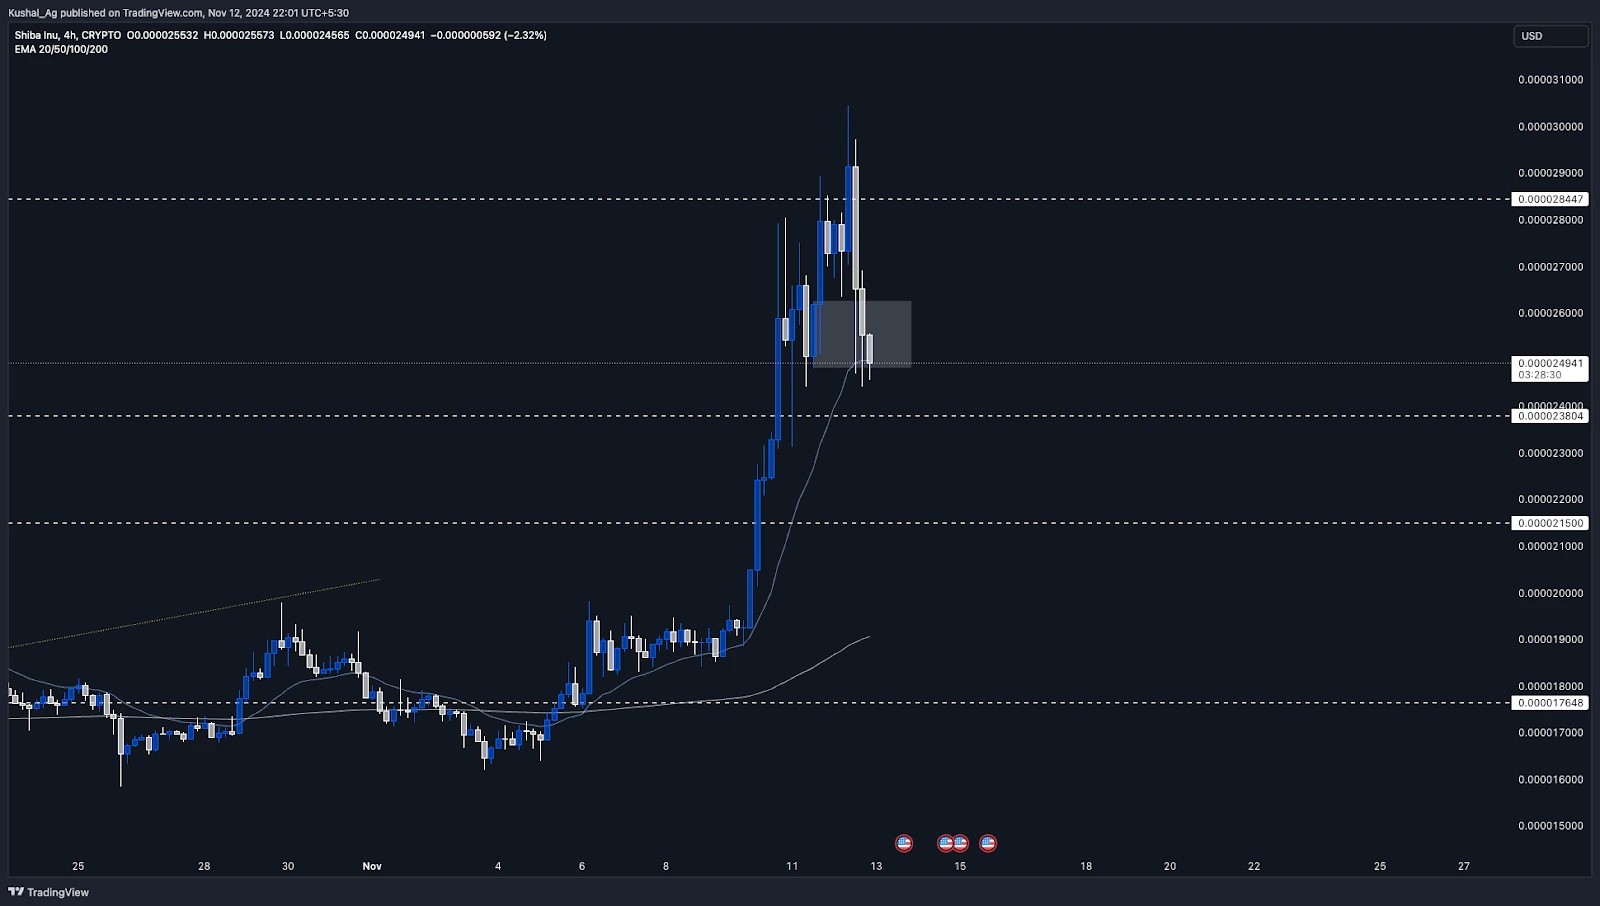
Cryptonary's take
Shiba Inu is currently in a healthy retracement phase after a substantial rally, with resistance at $0.00000284 and $0.000003 acting as overhead hurdles. Both the daily and 4-hour time frames show key support levels, notably at $0.00000238 and $0.00000215 on the daily, and the demand zone at $0.0000026 - $0.00000248 on the 4-hour with 20 EMA confluence.In summary, $SHIB is technically balanced, holding within solid support zones as it retraces, with consolidation or further recovery anticipated depending on the broader market conditions.
SHIB rally potential: Key support & resistance analysis
31 October 2024Overview
Shiba Inu ($SHIB) is showcasing a solid technical structure on the daily timeframe. With the 200 EMA providing a strong base, $SHIB appears well-supported, especially as it consolidates and contracts sideways. Since tapping the $0.0000215 resistance, SHIB has retraced to this foundational support, creating a favourable setup on the charts.Daily timeframe analysis
Shiba Inu has been steady around its 200 EMA, which has formed a reliable support zone, indicating potential strength in the asset's base. After breaking down from the yellow uptrend trendline about 10 days ago, $SHIB experienced a quick liquidity grab below the trendline, briefly dipping but quickly recovering, tapping into the 200 EMA.It reversed sharply in the next candle, reclaiming the 200 EMA and moving above the $0.0000176 level, a key support zone. Currently, $SHIB is showing signs of stability and trading above both the 200 EMA and the $0.0000176 support, which provides a sturdy platform for potential upward movement.
Potential scenarios
- Upside: Should $SHIB maintain its position above the 200 EMA and the $0.0000176 support, there is room for it to rally up to the $0.0000215 resistance level. A successful break above this level could trigger further momentum, with a medium-term target around the $0.0000283 area.
- Downside: If $SHIB fails to sustain above the 200 EMA, we could see a pullback to retest previous support levels, though current indicators suggest a stable base.
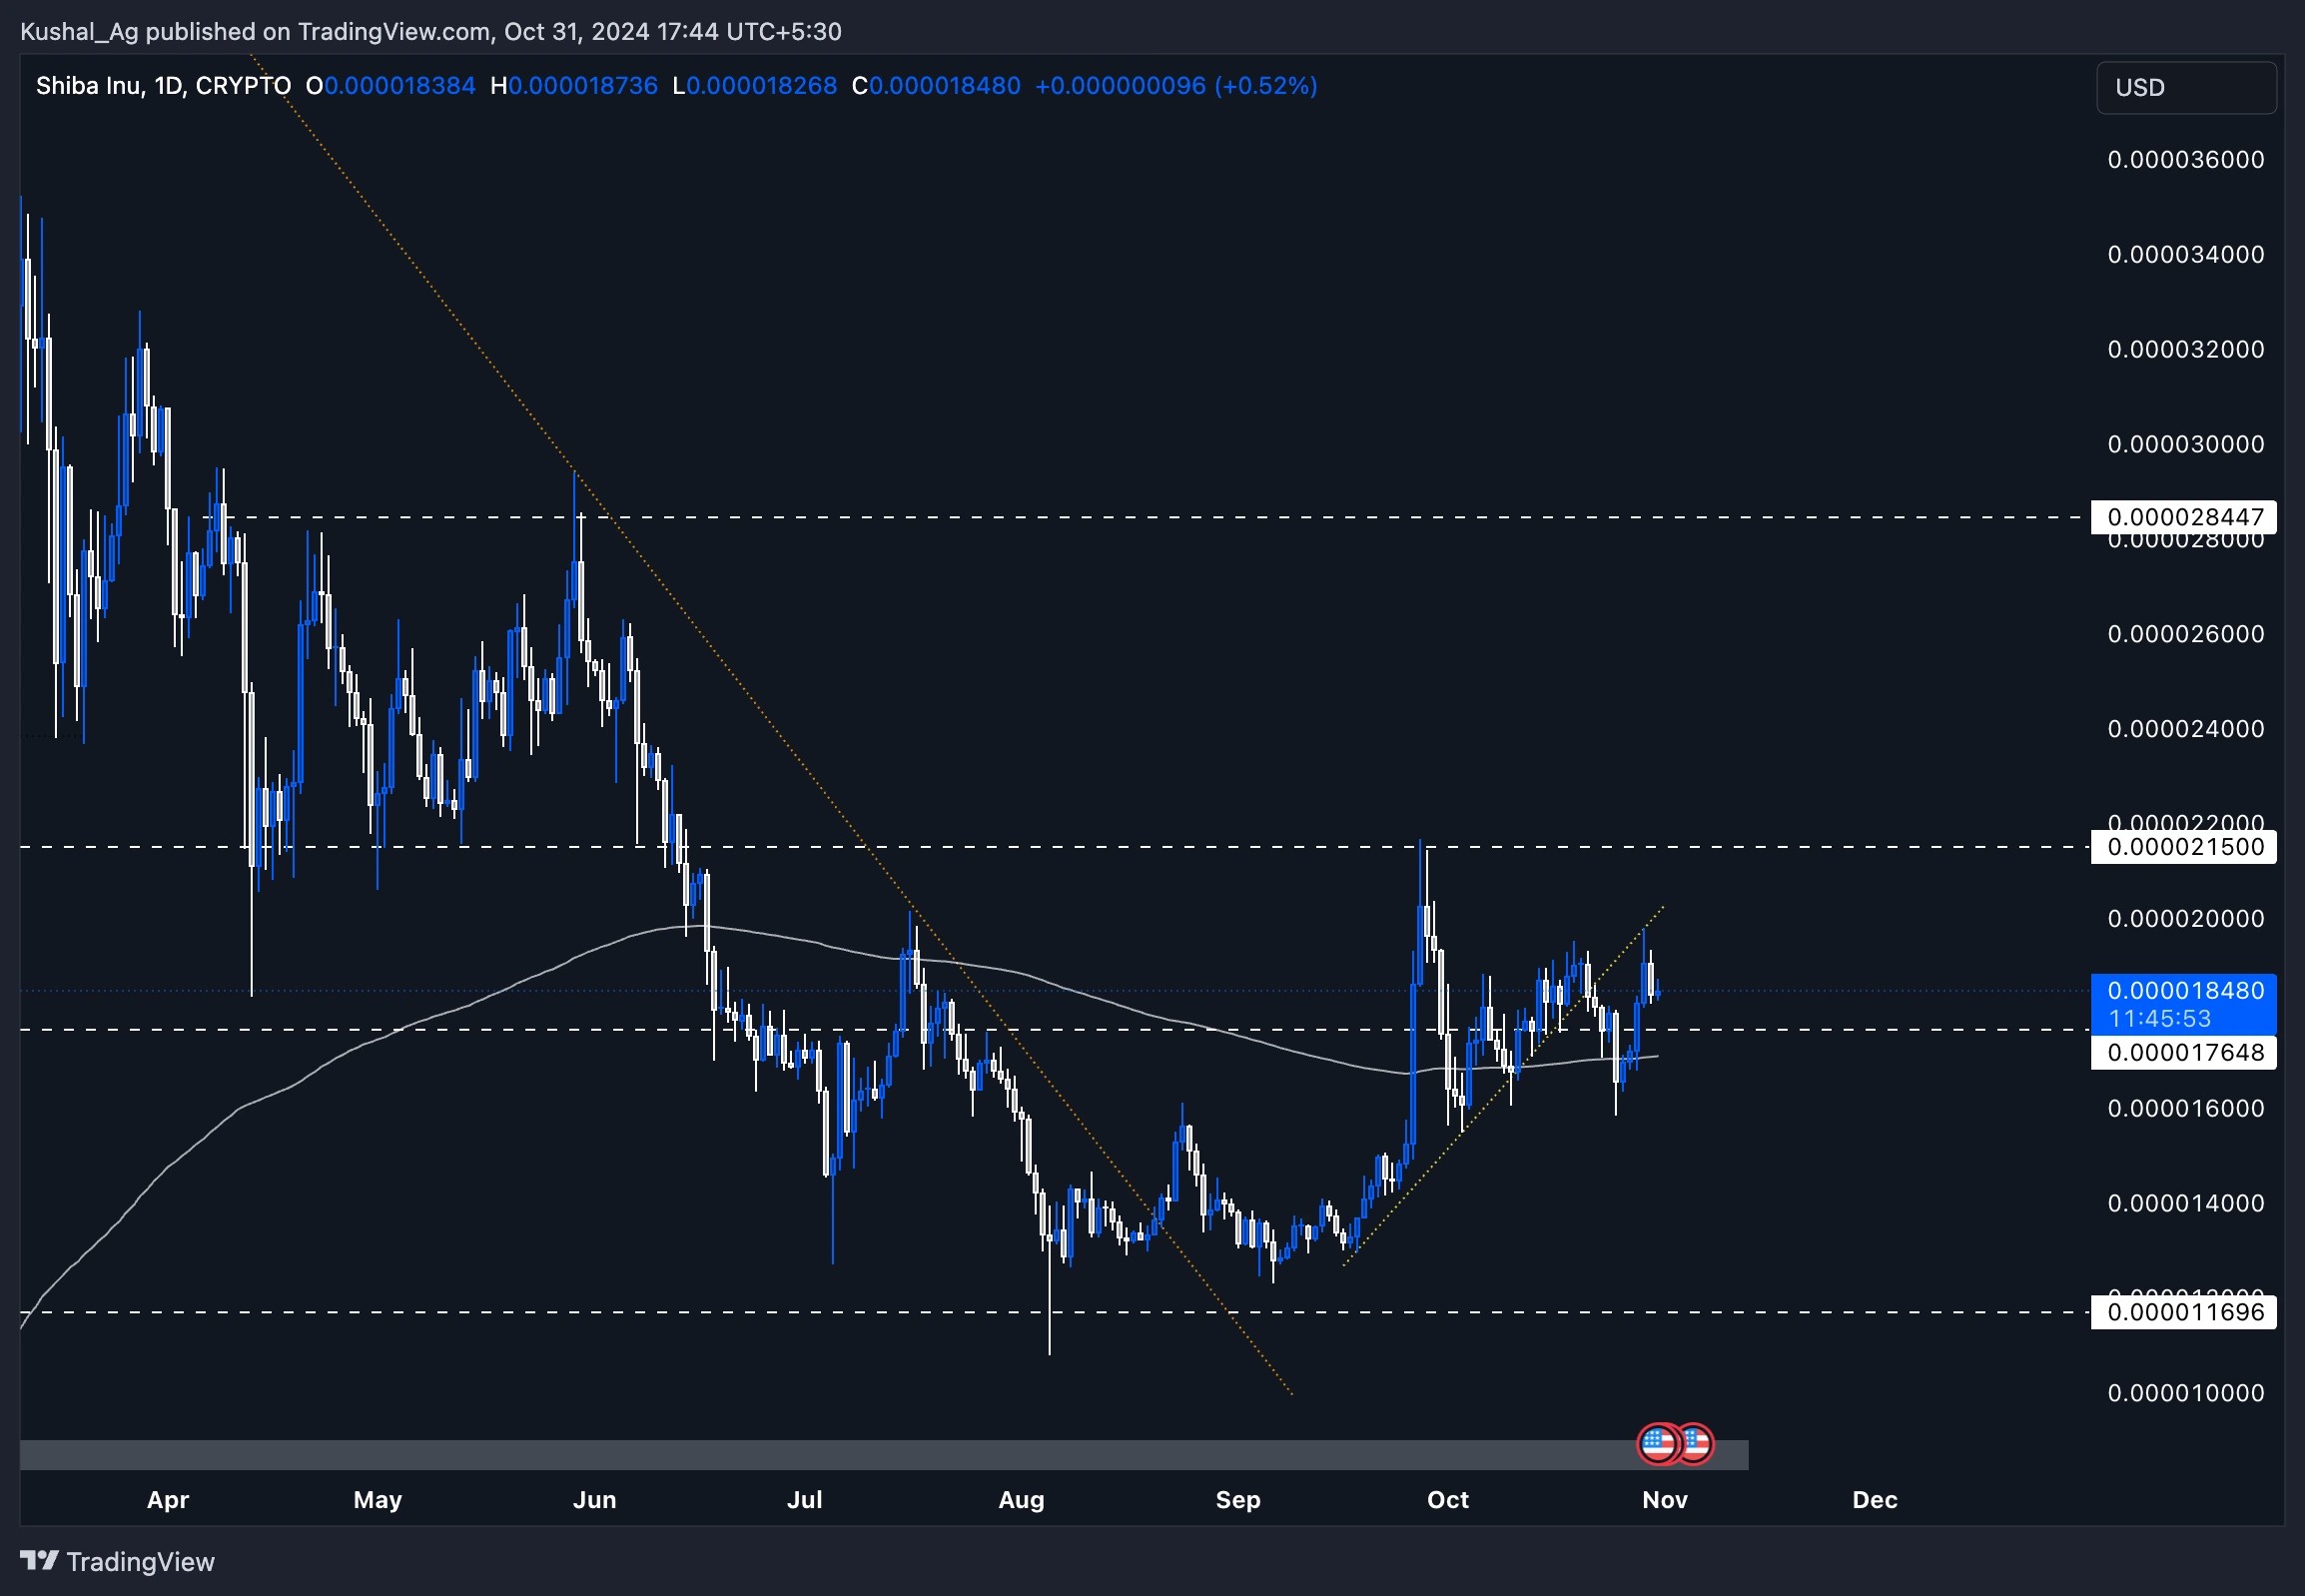
Cryptonary's take
With solid support around the 200 EMA and the consolidation in this range, $SHIB is positioned for a potential upward move. While the meme sector remains highly speculative, $SHIB's price action and technical support suggest a possible continuation to higher levels if broader market sentiment aligns.Shiba Inu (SHIB) technical analysis: Next move above $0.0000215?
18 October 2024As Shiba Inu (SHIB) hovers within its trading range, we’ll break down its current position. Can SHIB rally beyond $0.0000215 or retest its support at $0.0000116? Discover the key levels and what could be next for SHIB.
Disclaimer: This is not financial or investment advice. You are responsible for any capital-related decisions you make, and only you are accountable for the results.
Overview
Shiba Inu ($SHIB) continues to be one of the largest meme coins by market capitalization, having held a strong presence in the market for an extended period. While not a focus of our core strategy, it remains a key asset in the cryptocurrency ecosystem, warranting analysis due to its significant market movements.From a technical perspective, SHIB has displayed some interesting patterns on the charts, providing a potential setup for traders to keep an eye on. Given its long-standing market presence and current price action, this is a good opportunity to examine its latest performance, especially in relation to key support and resistance levels.
Daily timeframe analysis
On the daily chart, SHIB has recently been trading in a range between $0.0000176 and $0.0000215. This range has served as both support and resistance as SHIB struggles to make a decisive move in either direction. The 200 EMA currently lies at $0.0000168, offering a crucial support level that SHIB has been testing.From a structural standpoint, SHIB broke out from its prior downtrend earlier this year and has since been consolidating within this range. The $0.0000215 resistance level remains the next key hurdle for SHIB, and a break above this level could lead to a potential move toward its local high of $0.000045 made in March 2024.
On the downside, SHIB's immediate support sits at the $0.0000116 level. If the price fails to maintain its current levels, a break below the 200 EMA would likely result in a retest of this support. Beyond that, the demand zone from 2021, ranging between $0.0000068 and $0.000009, remains a significant longer-term support zone.
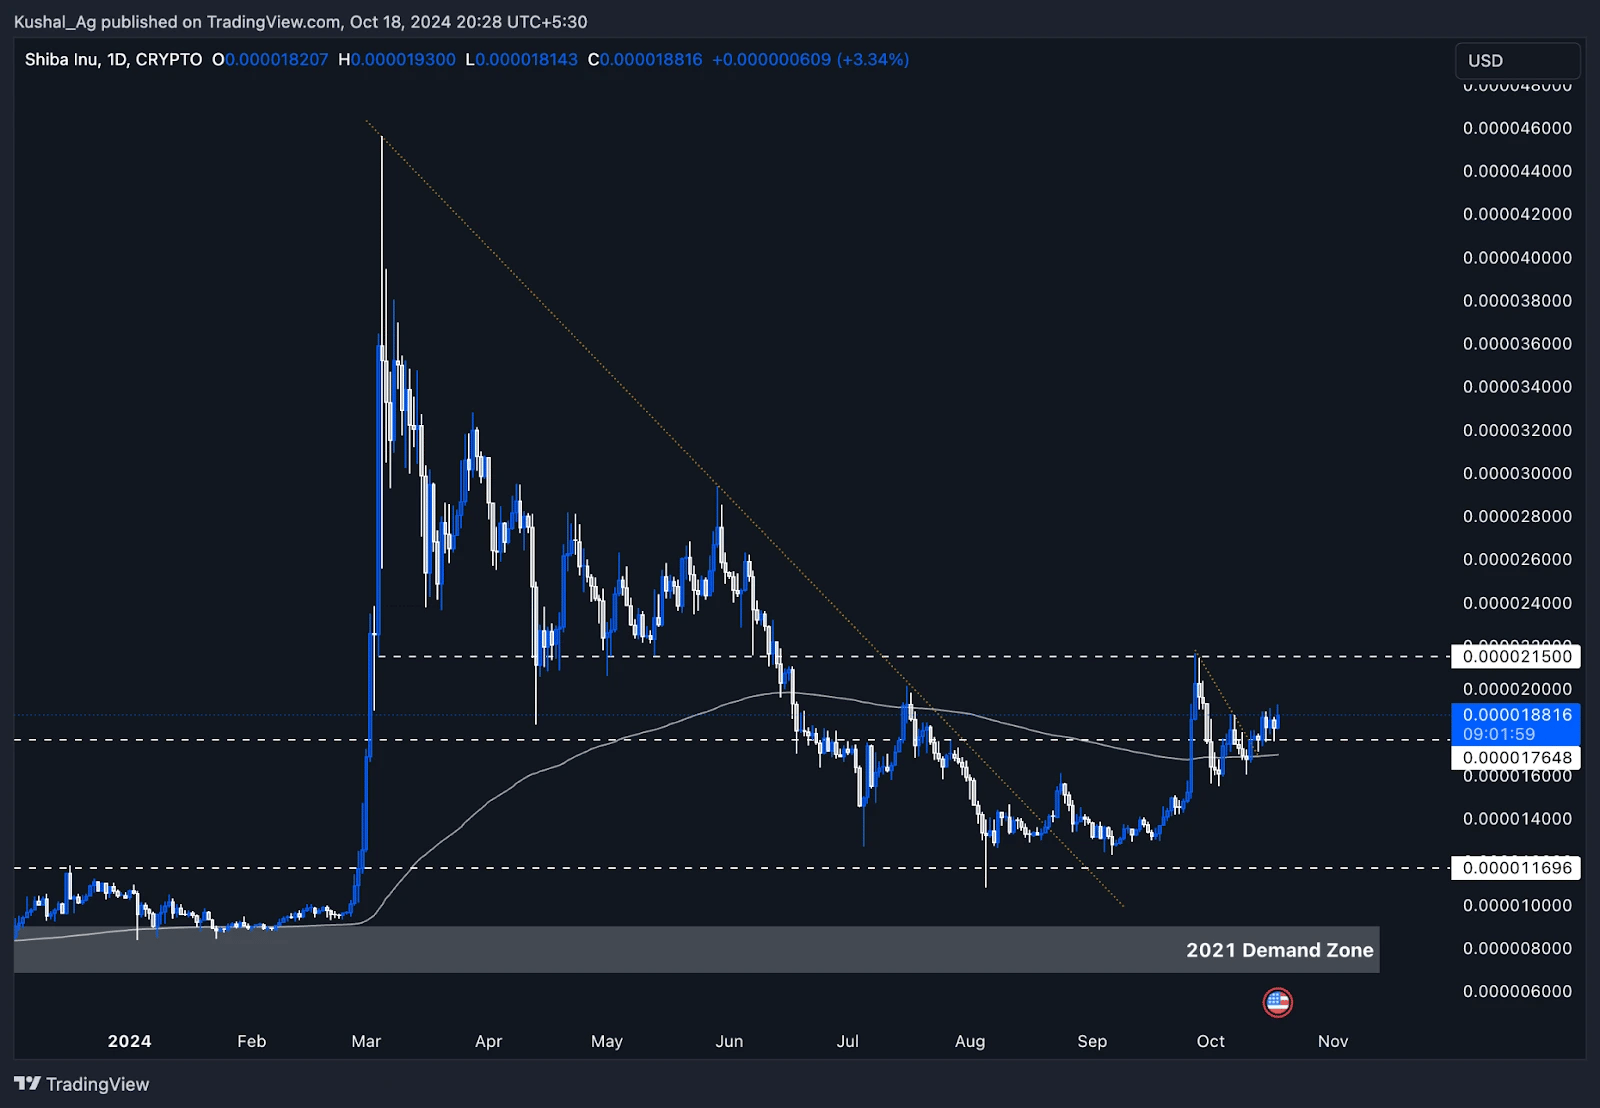
Conclusion
While SHIB has shown strength in holding key support levels, the price remains within a range, and we'll need to see a decisive breakout to signal further momentum. The technicals indicate that SHIB has the potential for another move on the upside if it can break the $0.0000215 resistance with conviction.However, the downside support levels, including the 200 EMA and the 2021 demand zone, are crucial to monitor for any retracement.
This is a setup to watch closely, but at this point, it's essential to stay neutral and observe how SHIB reacts to its current levels before drawing any conclusions about its next move.
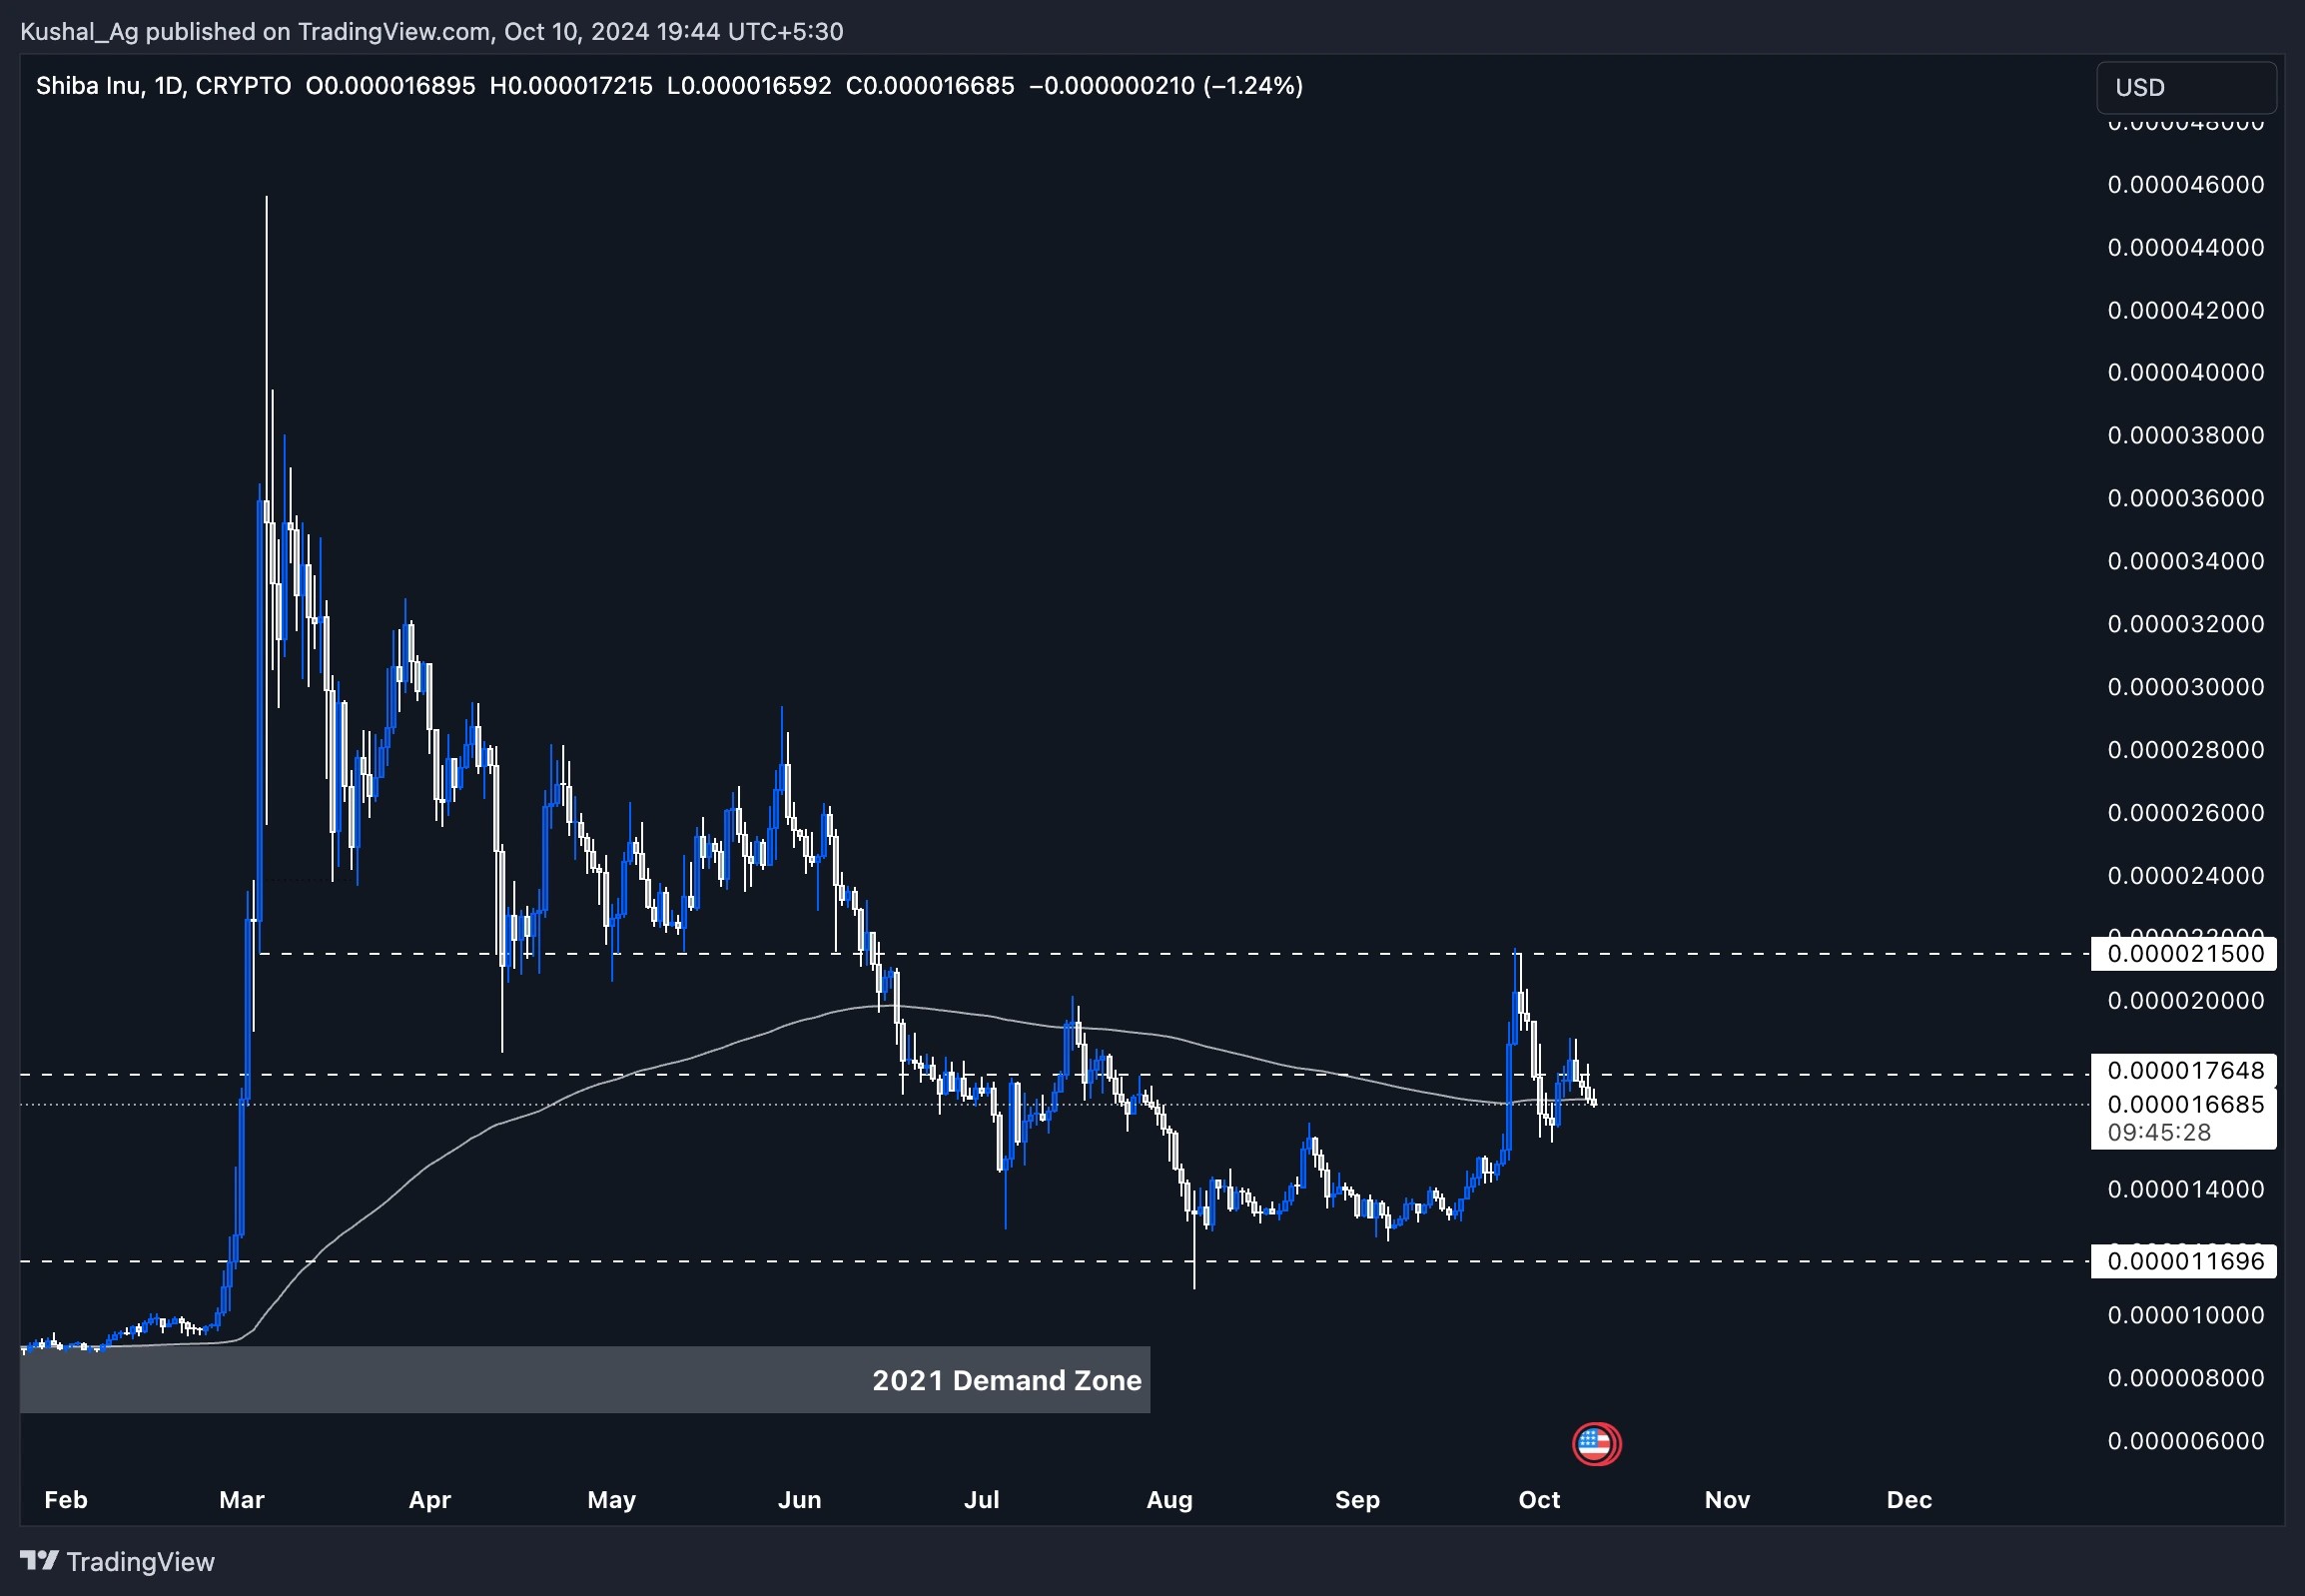
Is Shiba Inu (SHIB) ready for another 400% rally?
11 October 2o24SHIB is consolidating between key support and resistance levels, with strong support at the 200 EMA. A breakout above $0.0000176 could signal the next bullish move.
Disclaimer: This is not financial or investment advice. You are responsible for any capital-related decisions you make, and only you are accountable for the results.
Overview
SHIB has consistently been one of the top players in the memecoin space. Launched as a tongue-in-cheek nod to the original meme coin, Dogecoin, $SHIB quickly gained traction with its loyal community and relentless viral marketing. Now, in late 2024, $SHIB is in a crucial phase, and the price action is heating up. With memecoins having their moments of explosive runs, $SHIB remains at the forefront of the pack.Weekly timeframe analysis
On the weekly chart, $SHIB has shown immense strength after a massive 400%+ surge from its demand zone established in 2021. This move, which occurred in March 2024, resulted in a high of $0.000045 before retracing to key support at $0.000011, reflecting a typical 75% pullback after such a rally. This retracement, while sharp, is a hallmark of memecoins as they often experience large corrections after explosive gains.What stands out here is the weekly interaction with the 200 EMA, which currently sits at $0.0000129. $SHIB found strong support here after the retracement, using the 200 EMA as a base for accumulation. In fact, $SHIB bounced 70% off this level, confirming it as critical support.
Right now, $SHIB is consolidating between the 200 EMA and resistance at $0.0000215, with another resistance level just above the current price at $0.0000176. This consolidation suggests that $SHIB is gearing up for another move.
Key observations
- 200 EMA support: The 200 EMA at $0.0000129 has been a vital level, acting as a strong support zone for $SHIB.
- Resistance levels: $SHIB faces near-term resistance at $0.0000176 and $0.0000215.
- Retracement and base formation: After a 75% retracement, $SHIB has held the 200 EMA as support, indicating potential accumulation before a breakout.

Daily timeframe analysis
On the daily chart, SHIB is currently in a key consolidation phase, with its price action hinting at a potential breakout from crucial support and resistance levels.- 200 EMA support: The 200 EMA on the daily timeframe, currently positioned around 0.0000168, is acting as a dynamic support level. This level is crucial as SHIB continues to test it while trying to form a base above it.
- Resistance levels: On the upside, SHIB faces immediate resistance at 0.0000176. A break and hold above this level would indicate bullish momentum and could potentially open up a path toward the 0.0000215 resistance, which is the next key area to watch. Beyond that, SHIB could challenge its previous swing high at 0.000045, but it first needs to reclaim these initial resistance levels.
Key observations
- EMA confluence: The interaction with the 200 EMA on both the daily and weekly charts provides SHIB with strong confluence. Maintaining support above this level could indicate further bullish momentum in the short to medium-term.
- Potential accumulation zone: The 0.000011 - 0.0000129 zone remains a key area where SHIB could potentially accumulate before its next leg up. Investors looking to enter positions may view this as a favourable accumulation range.
- Bullish confirmation: A break above 0.0000176 would provide a bullish confirmation, allowing SHIB to target higher levels like 0.0000215 and beyond.
Cryptonary's take
$SHIB is at a pivotal point, with strong technical confluences forming across multiple timeframes. The support from the 200 EMA on both the daily and weekly charts creates a strong foundation for a potential breakout. If $SHIB can reclaim key resistance levels and maintain bullish momentum, it has a clear path toward its 2024 high of $0.000045 and beyond.However, it's important to note that meme coins like $SHIB are highly volatile, and sharp retracements are always a risk. Traders should be cautious of a potential breakdown below the $0.000011 - $0.0000129 demand zone, as that could signal a deeper retracement. As always, it's essential to approach meme coins with a clear risk management strategy in place.
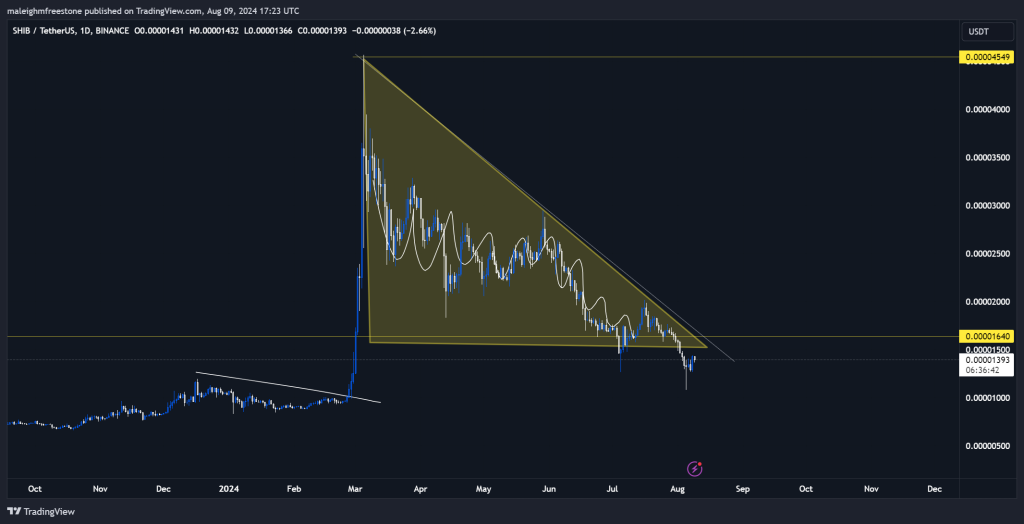
Shiba Inu (SHIB) price prediction today: Will it hit 180% soon?
9 August 2024Can SHIB break out of its current consolidation phase?
Please note: The video above is set to start at the 11:22 mark, featuring an in-depth technical analysis of Shiba Inu (SHIB).
Shiba Inu has been one of the standout performers in the meme coin space, showing a strong consolidation pattern after a massive expansion.
Disclaimer: This is not financial or investment advice. You are responsible for any capital-related decisions you make, and only you are accountable for the results.
Unlike many other assets, SHIB has managed to hold its ground and avoid drastic sell-offs, which speaks to its resilience. The chart structure is very bullish, with the potential for another significant move if it can break out from its current consolidation phase. We recommend keeping an eye on the 0.00001640 level, as a reclaim of this level could set the stage for another 180% move, targeting previous highs.
What is SHIB: Shiba Inu (SHIB) is a decentralized meme token that grew into a vibrant ecosystem. Inspired by Dogecoin, SHIB aims to be an Ethereum-based alternative with its own decentralized exchange (ShibaSwap) and an interesting also gowing list of use cases.
How to Buy: Via Centralized Exchange (CEX):
- Choose a CEX like Binance, Coinbase, or Kraken.
- Create and verify your account.
- Deposit funds.
- Navigate to the SHIB trading section and complete your purchase.
Get started for free
Create your free account or log in to read the full article.
Recommended from Cryptonary


