Save 23% ($351) & Get a Free 1-1 Call with our Team ⏰ : 0d 2h 59m 43s
Let's take a look at these four assets—SUI, TIA, FTM, and FET—as they've all shown significant momentum in recent days. Some are stronger than others, so we’ll focus on each one and analyze where we should be looking to position ourselves for potential long-term holds or profit-taking.
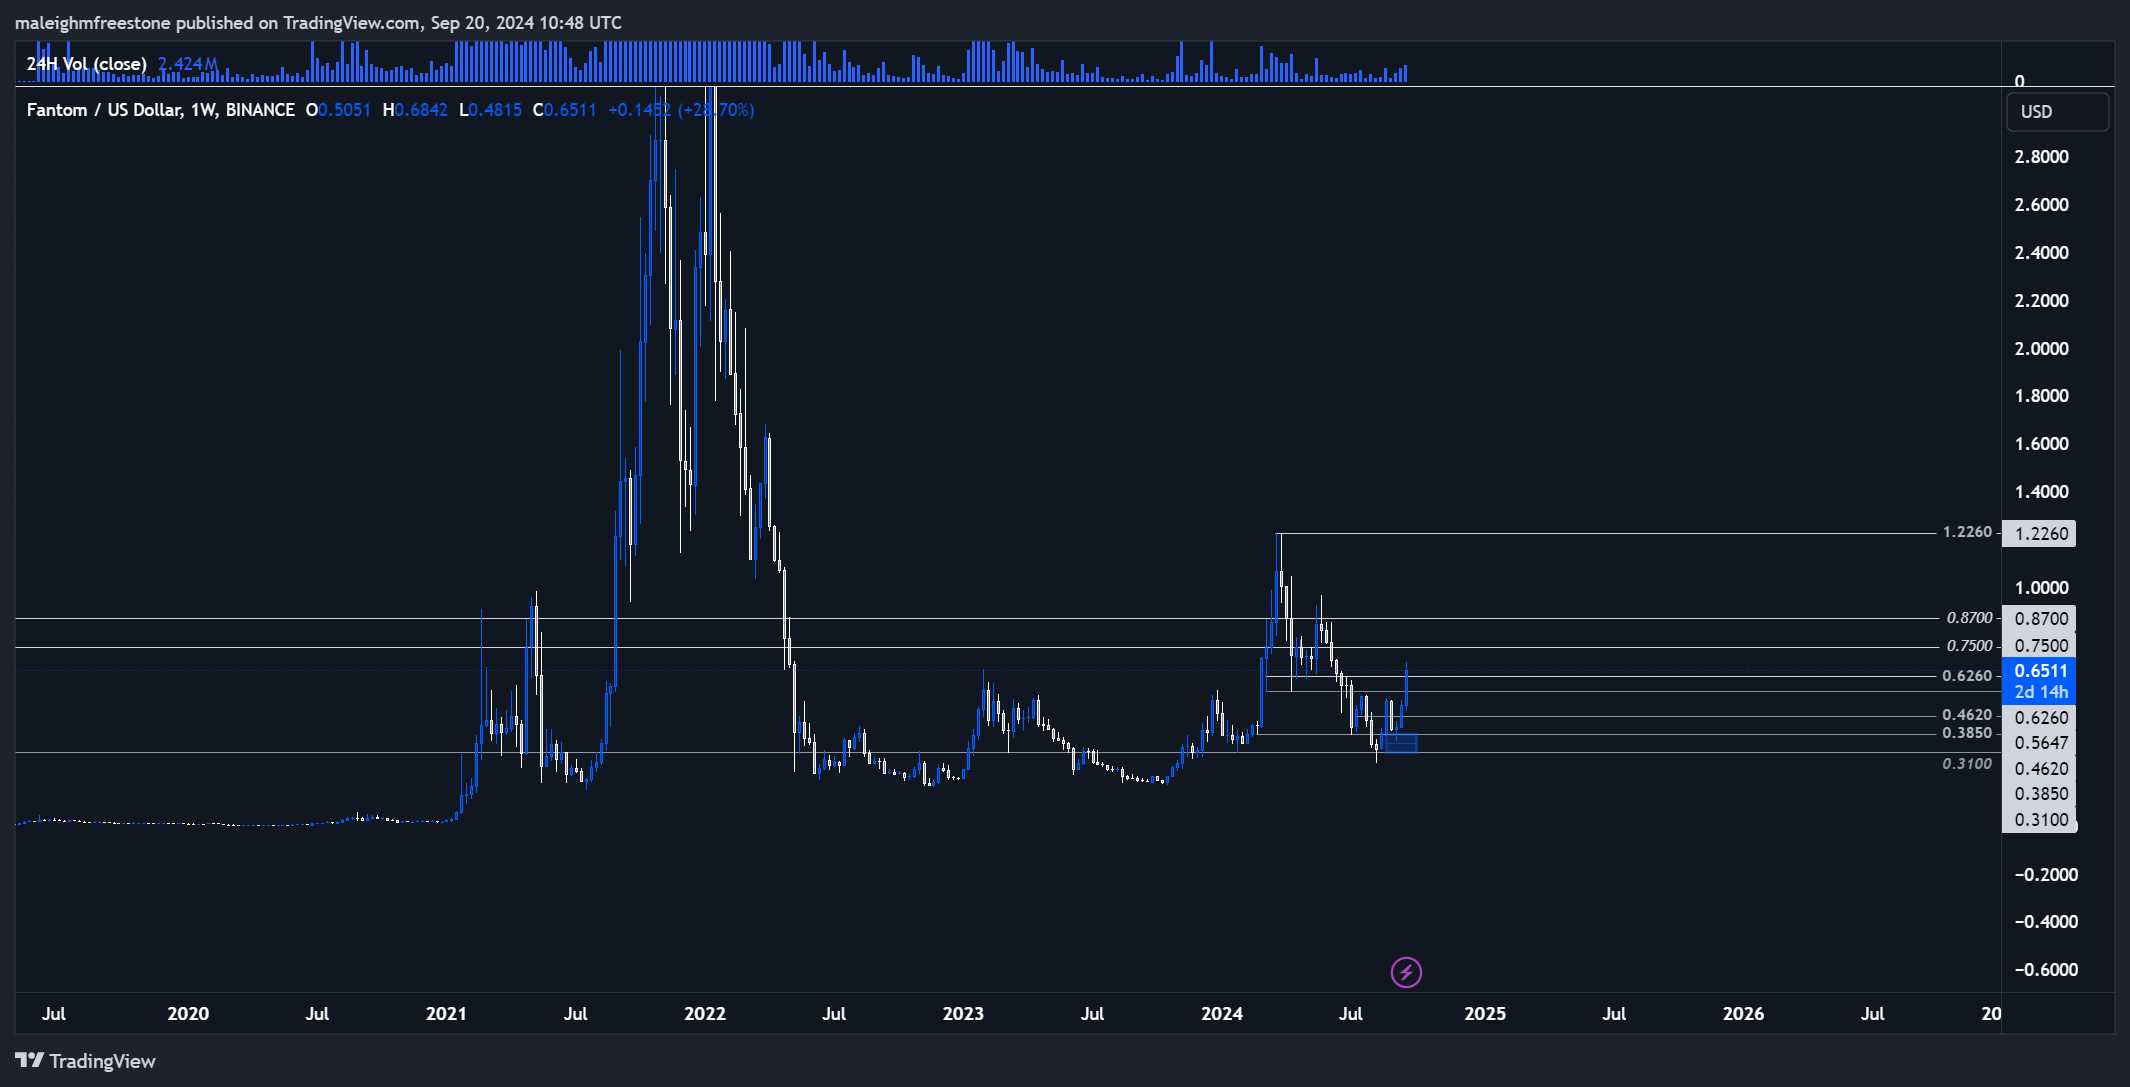
1. Phantom (FTM)
- Context is Key: The market context always holds more weight than short-term moves. FTM's recent move needs to be analyzed within the broader cycle, not just the past few days. It's 74% down from its highs, so while we've seen some recovery, it hasn't regained even half of that drop yet.
- Big Picture Focus: Don't just focus on pumps; look at the broader market cycle. FTM is still within a historical range, so while there's potential, it's not fully recovered. We should be cautious until it shows more strength. It's moving, but not to the extent that we can trust for long-term holds just yet.
Disclaimer: This is not financial or investment advice. You are responsible for any capital-related decisions you make, and only you are accountable for the results.
2. TIA
- Current Recovery: TIA is about 80% down from its highs, and so far, we've only recovered about 10% of that. While it did give us a nice 50% pump, in the grand scheme, it's not as significant in the long term.
- Patience is Key: The recovery here has been minimal, and we're still far from seeing real long-term strength. It could be a short-term play, but from a long-term hold perspective, we need more from TIA before fully trusting its momentum.
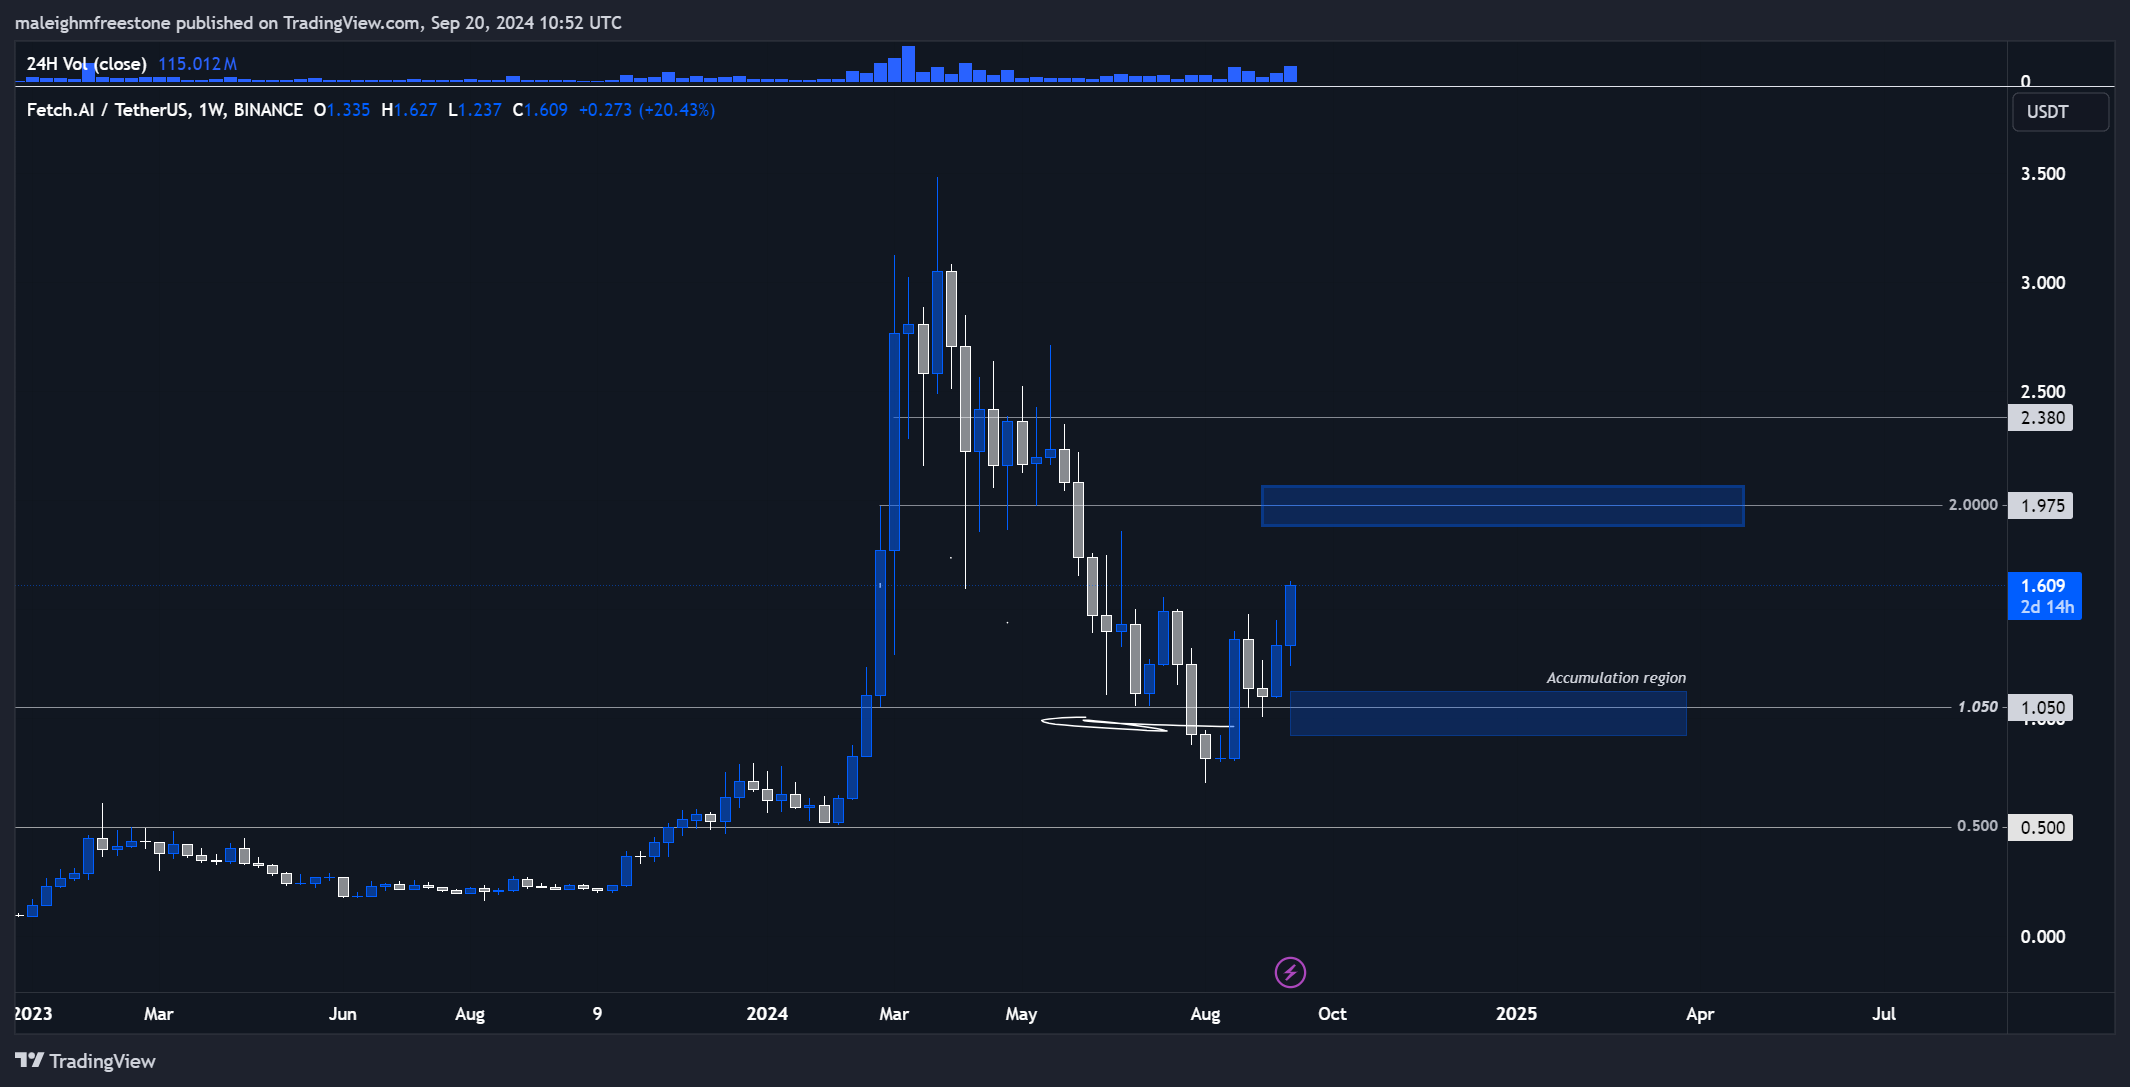
3. Fetch.ai (FET)
- Inverted Head and Shoulders: FET is one of those assets we highlighted previously for an inverted head-and-shoulders setup. That played out nicely, but we needed more certainty from the interest rate decision, so staying on the sidelines was smart. Now, we’re seeing a bit more clarity.
- Context Matters: Like FTM and TIA, FET is still down significantly from its highs. However, there’s a key price level we need to watch at $2. I think this will bring back positive sentiment for this asset individually because that's a great recovery, and if we break above that, it could trigger a stronger move. Until then, we’re still cautious and not putting this at the front of the asset class in terms of strength, but it's still something to consider in the AI sector.
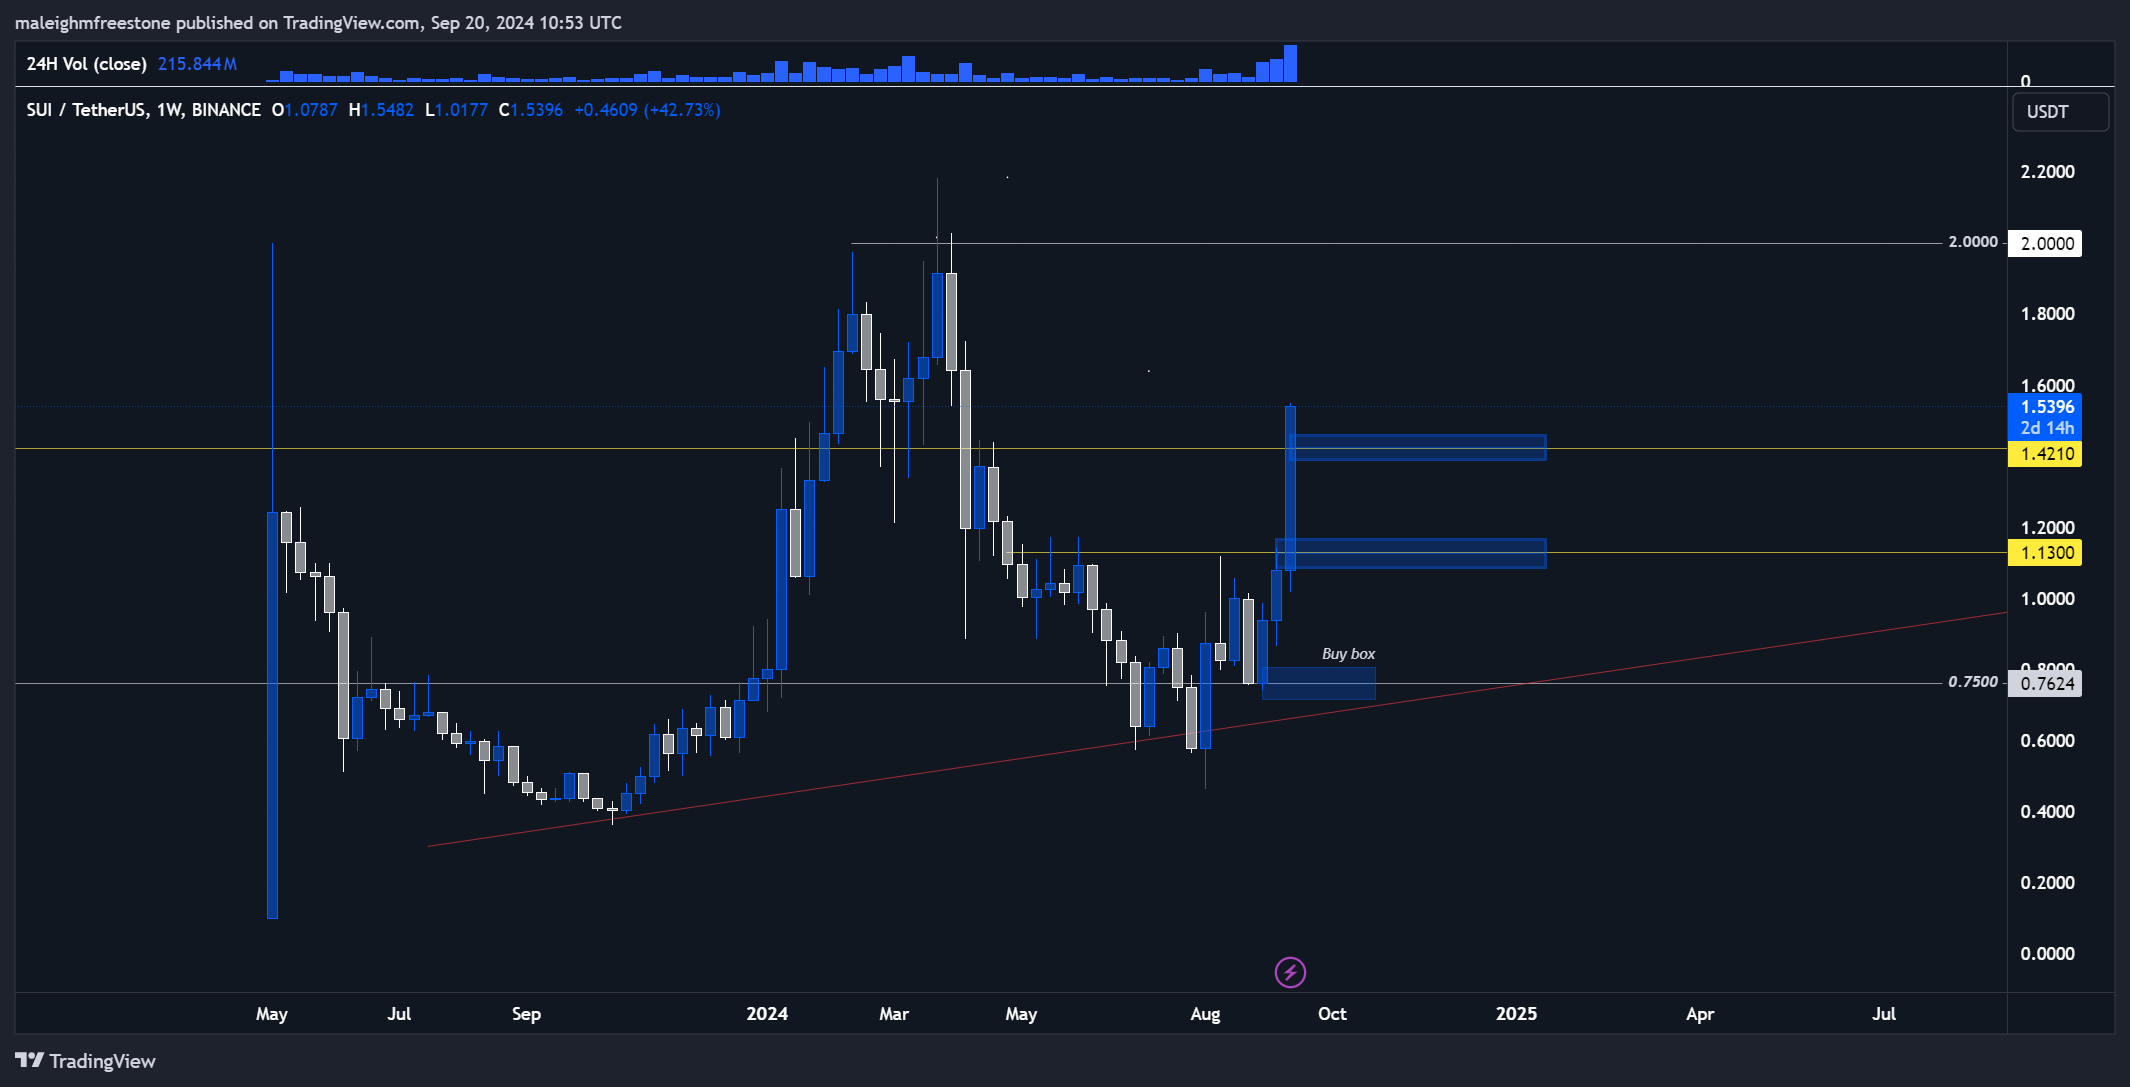
4. SUI
- Strong Recovery: SUI has recovered over half of its 80% decline at the time of posting now, which is significant. From the buy box we discussed a while ago, SUI has already delivered nearly a 90% move. This is one of the few assets showing real strength and excitment in the market right now.
- Momentum and Long-Term Hold Potential: SUI is showing strong momentum, especially when compared to the rest of the market. It’s performing well during a recovery phase, which makes it an asset worth considering for long-term holds. If you're not in already, the next pullback zone to consider is around the $1.13 level.
- Play It Smart: Watch for a break above $1.40 for further confirmation of strength, but if you’re looking to build a position, $1.13 is where you'd want to target. The setup is solid, and it’s the clear leader among these four assets. Just because we have broken $1.40 now doesn't mean $1.13 can't come into play; these stretched moves often need breathers.
Cryptonary's take
Focus on Context: Look at the broader market cycle, not just short-term pumps. The overall sentiment has shifted slightly due to the recent interest rate decision, but it’s critical to see how these assets recover from their 70-80% declines. Focus on the strength: Among these four assets, SUI stands out as the clear leader, showing real strength and a solid recovery.FTM and FET have shown signs of life but are not as convincing yet. TIA had a nice pop but still lacks long-term momentum. Take Profits or Hold? If you’re already in these assets and bought them low, taking profits could be wise, especially on SUI after a 90% move.
However, if you're thinking long-term, hold onto the strongest ones like SUI while keeping an eye on key levels for potential pullbacks to accumulate more and also look at potentially rotating out of some of the slower ones into assets with way more conviction across the asset class.
Recommended from Cryptonary


