Save 23% ($351) & Get a Free 1-1 Call with our Team ⏰ : 0d 2h 59m 44s
Will Bitcoin breakout? How FED data impacts the next move
As the crypto market eyes potential breakout opportunities, all eyes are on this week's key FED data and bond market trends. Could this be the momentum shift that propels the BTC higher? Let's dive into the analysis to understand how these developments might impact the market.

In today's report, we'll cover:
- Key FED data and how it could drive the market
- Bond market pricing and its influence on risk assets like crypto
- Updates on TradFi and crypto index charts signalling potential breakouts
- Cryptonary's take on where the market is going next
Disclaimer: This is not financial or investment advice. You are responsible for any capital-related decisions you make, and only you are accountable for the results.
This Week's Data
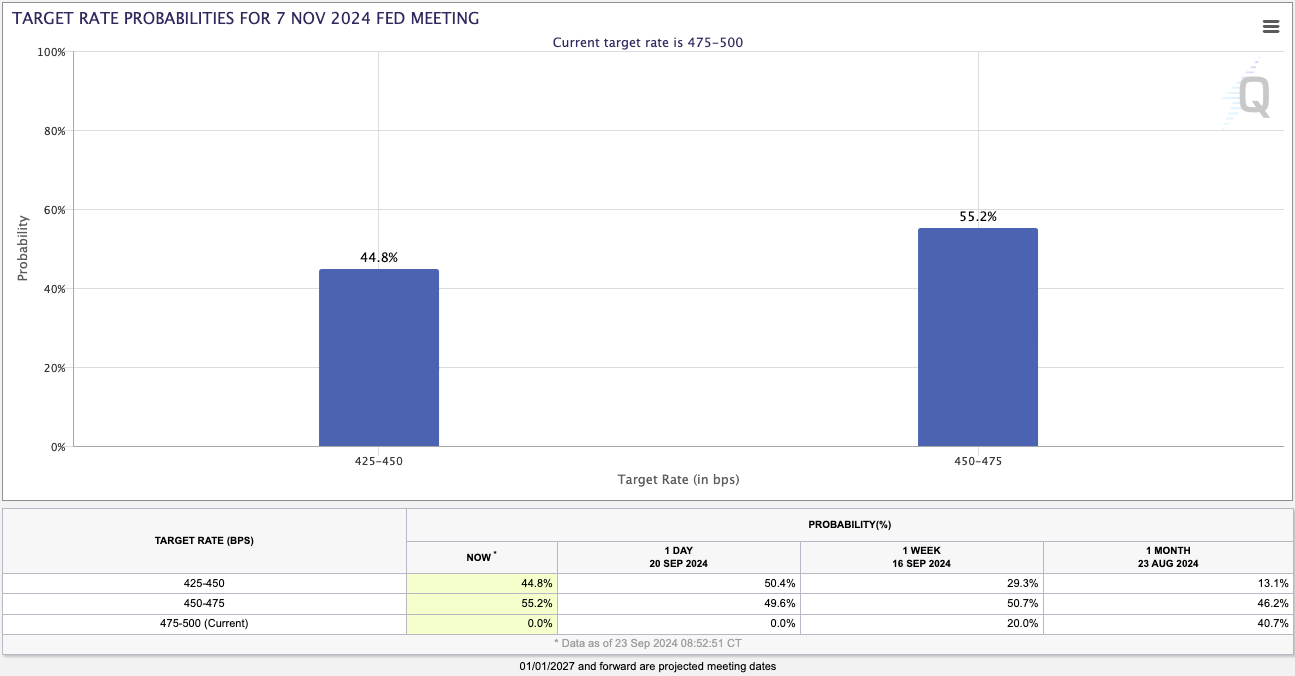
Coming up this week on the data front, we have a plethora of FED speak throughout the week, with the most notable being Chair Powell on Thursday. The markets will look to the FED speakers for more indication as to whether FED members are open to the idea of doing another 50bps at the November Meeting. The likelihood is that FED members won't commit to a 25bps or 50bps move in November, although they'll suggest they're currently siding with just 25bps. But, this will all be data dependent as there's a lot of data to come out between now and the next Meeting. The FED will likely talk 25bps as this will come to the markets more. Also, new data will come out in the coming 5 weeks. The market is currently pricing a 55% chance that the FED will cut by 25bps.Target Rate Probabilities (Interest Rate) for Nov 7th FED Meeting:
Alongside the FED speak, we have Jobless Claims and GDP data on Thursday, followed by Personal Income and Spending data on Friday.
GDP growth is expected to come in at 3.0%, which is super strong, whilst Jobless Claims are expected to come in around the 226k mark. If these both print as forecasted, risk assets will likely continue their grind higher as the soft landing narrative remains intact. Friday's data, Personal Income and Spending, are also forecasted to come in positively, both at 0.3%. This would indicate that the consumer is still earning and spending, again aiding the soft landing narrative.
If the soft landing narrative maintains, and the data above suggests it can (assuming it comes in this week as forecasted), then risk assets (Crypto) can continue their grind higher.
Bond market pricing
The bond market is known to have the smartest participants trading it, so it's important to know how the Bond market is pricing certain outcomes. Since the start of May, Bonds have rallied (in price) and tumbled (in Yields). This essentially tells us that the bond market had begun pricing in an interest rate cutting cycle since May, as bonds tend to be majorly bid as investors look to lock in the 'high' yields that bonds offer before they begin to come down.Note: As the Interest Rate cutting cycle begins, Bonds are bid so Yields fall, meaning the investor earns less Yield for owning that Bond. Therefore, as Yields fall, Bonds become less attractive (essentially) as they offer less of a return/Yield, and investors therefore look for higher performing assets to invest in, ie, Stocks - risk assets (Crypto in some occasions).
It is possible that the majority of the move down in Yields has been had over the past 5 months, but there is likely still more meat on the bone to be had ie, Yields to continue their downtrend. As we stated above, this is positive for risk assets as investors seek out higher-performing assets. This can be a great tailwind to stocks and Crypto and may help fuel the next multi-month leg higher for both.
TradFi and crypto index charts
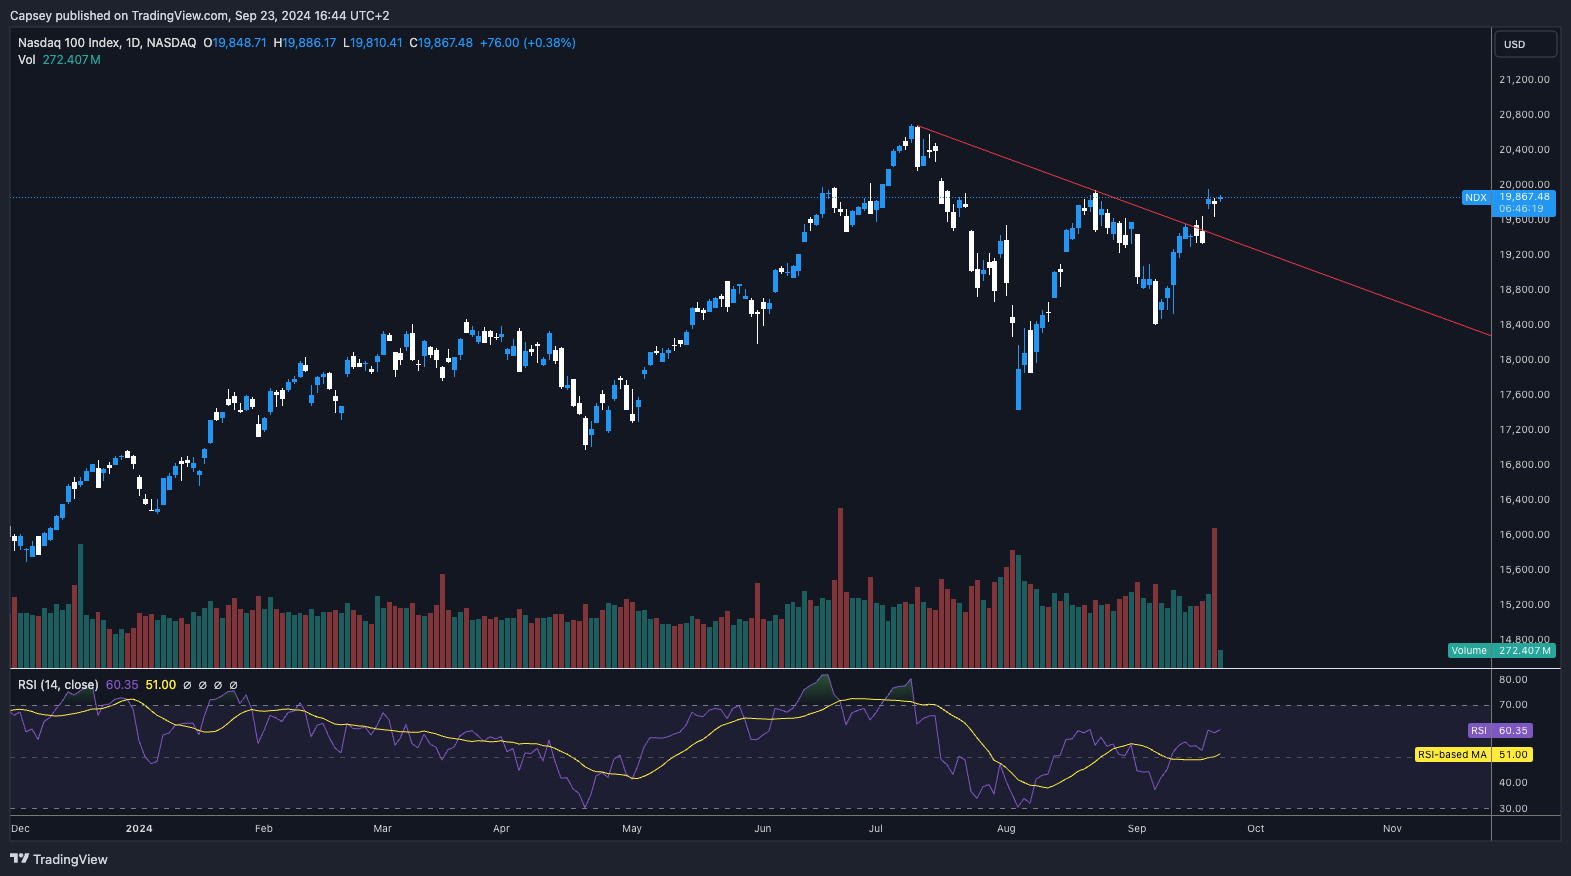
We're now going to look at the Nasdaq (the TradFi chart) and Total 3 (the Crypto chart). Bitcoin is somewhat correlated to the Nasdaq and so it can therefore be a useful indicator for us.Towards the back end of last week, the Nasdaq broke out from its downtrend line, which could mean we see a push-up to all-time highs in the coming weeks. This should be a positive and a tailwind for Crypto.
Nasdaq 1D chart:
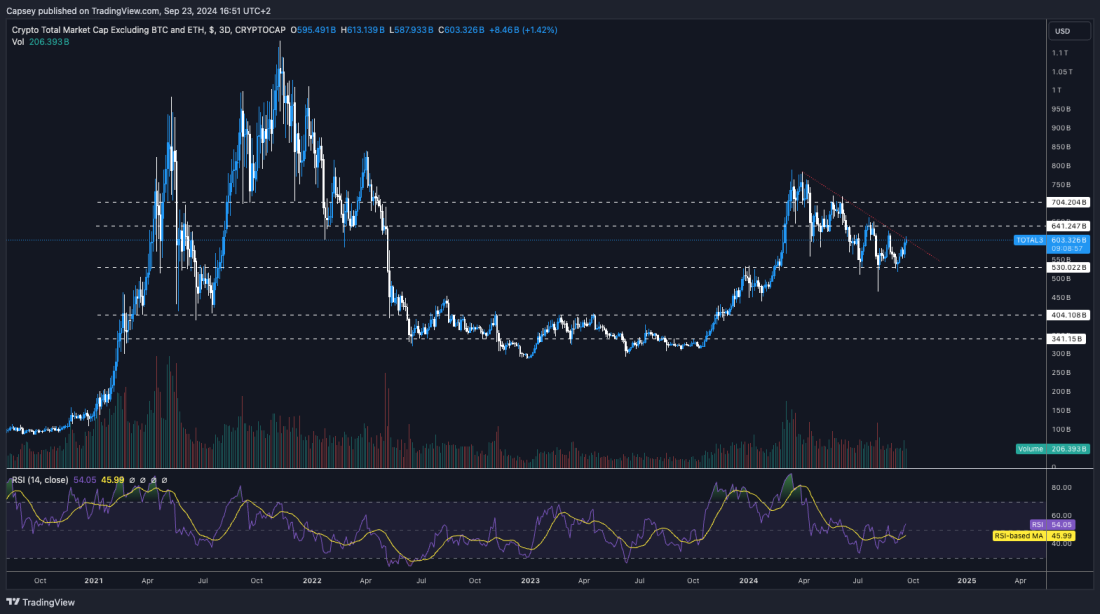
We're now going to look at Total 3. This is the total Crypto market cap, excluding Bitcoin and ETH's market caps. This chart gives a good look into how the rest of the market is performing/holding up.
Now note, the below chart is the 3D timeframe chart, so it's more zoomed out. We can see in the below that Total 3 hit a high in Q1 and has pulled back and consolidated ever since. Price is now close to breaking out of the downtrend line though. A clean breakout could see Total 3 push back up to $704b in the coming 6 weeks or so. Overall, the chart looks super bullish over a 2-4 quarters timeframe.
Total 3 3D chart:
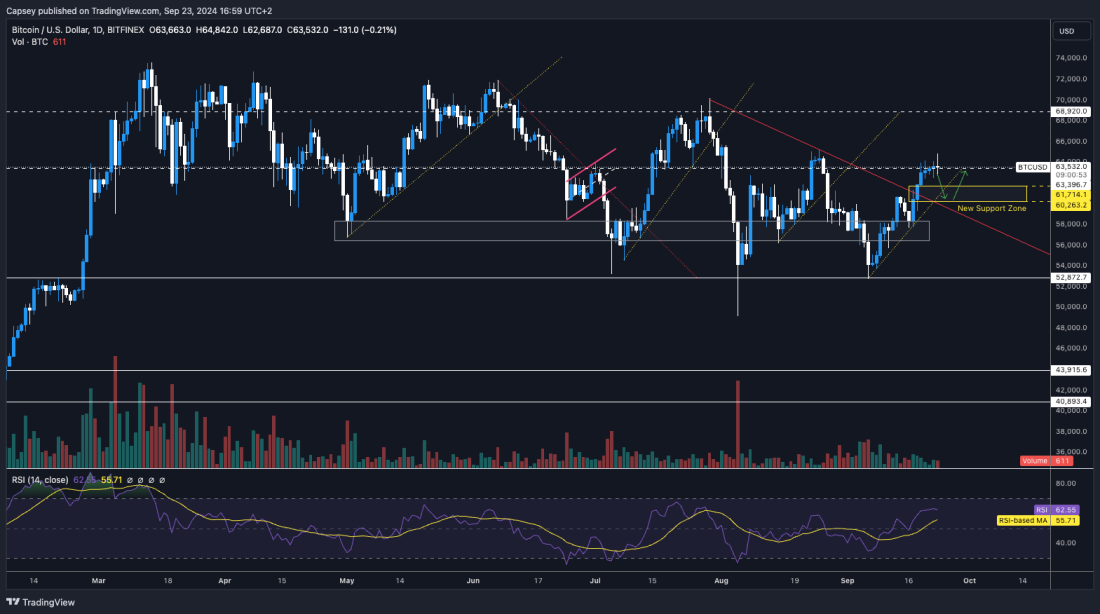
We will provide a more in-depth update on Bitcoin tomorrow in the Market Direction. But, in the meantime, we can see that the move for Bitcoin has been very positive. BTC hasn't broken out of the downtrend line and hasn't seen any meaningful pullbacks as of yet whilst it is currently battling at the horizontal level of $63,400.
It's possible we will see a move back to $61k, with bid liquidity around that area. But, to the upside, ask liquidity is around $65k, meaning the price could shove another few percent higher in the very short-term.
BTC:
Cryptonary's take
In simple terms, the market can continue to grind higher here as long as the soft landing narrative is maintained. For this, we're mostly watching the data to continue coming in positively. However, with the election on the near-term horizon, we may see risk appetite still somewhat subdued and potentially not picking up until after the event. We, therefore, choose to remain in the barbell portfolio for now, but we're beginning to look for more opportunities to begin diversifying into riskier/higher-performing plays.
For now, there have been no changes to the strategy, but we're beginning to become more excited about what the market might have in store for us over the coming months and quarters. We're potentially on the cusp of a significant expansion phase here, i.e., prices up.
Recommended from Cryptonary


