Save 23% ($351) & Get a Free 1-1 Call with our Team ⏰ : 0d 2h 59m 43s
Home
Research
Analysis
Community
Market Direction
Solana (SOL) price prediction
Updated: Jun 16, 2025
Published: Sep 20, 2024
0
Share:
Solana's price prediction is driven by its strong blockchain technology and growing ecosystem, which helped it reach its all-time high of $258.78. As it continues to gain traction, its price movements are influenced by technological developments and broader market trends.
We at Cryptonary provide you with the most accurate price prediction for all sorts of coins. You can also request an on-demand SOL price prediction by joining our Discord Community.
Our Price Prediction Model
Unlike others, we don't rely on automated methods because there’s a higher chance of getting a wrong prediction. There are many factors to consider when accurately predicting a cryptocurrency's price.
That's why our team of Cryptonary analysts carefully research each cryptocurrency and give you a detailed price prediction using technical analysis to help you make the most profit. This prediction is based on a technical analysis of the coin rather than just general sentiment. We also offer various things like:
Market Updates: Done a few times per week based on macro indicators.
Market Directions: Provides details on current market conditions and patterns.
Additionally, our team accurately predicted that Dogwifhat, Popcat, and SPX would rise when their prices were just $0.005, $0.003, and $0.01, respectively. Now, by 9th December 2024, the Dogwifhat is sitting at $3.34, Popcat at $1.32, and SPX at $0.6441. Those who invested when we first mentioned them saw a massive boost because of their investments.
With that said, here’s our Solana price prediction.
SOL ranges tighten as breakout tension builds
16 June 2025
Solana is compressing between major support and resistance levels. With bullish bias building, traders are watching closely for a decisive breakout—or another leg down.
Disclaimer: This is not financial or investment advice. You are responsible for any capital-related decisions you make, and only you are accountable for the results.
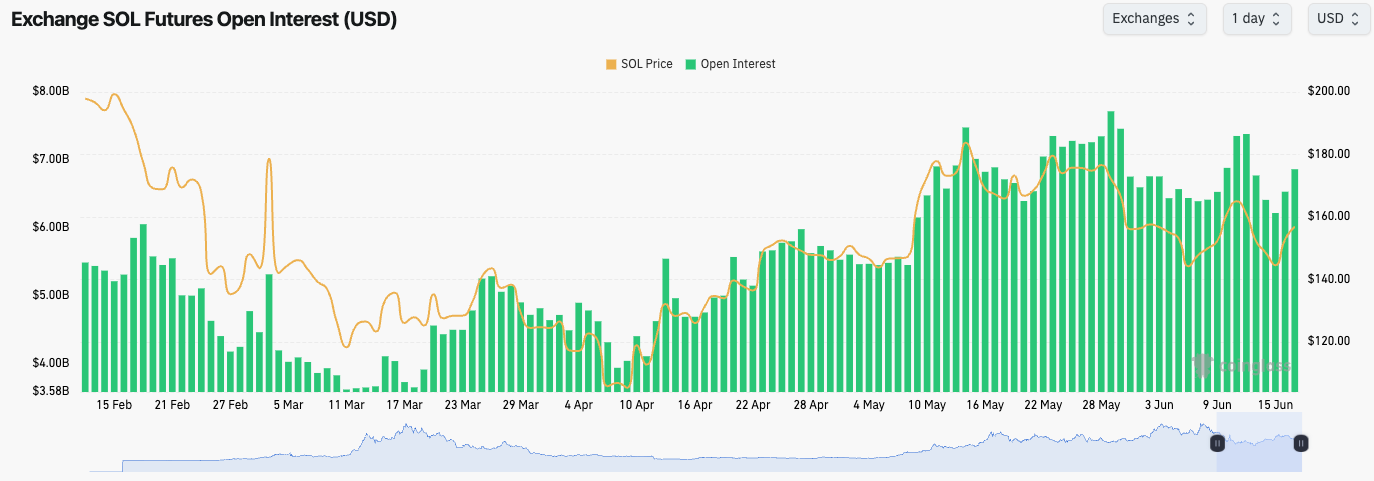
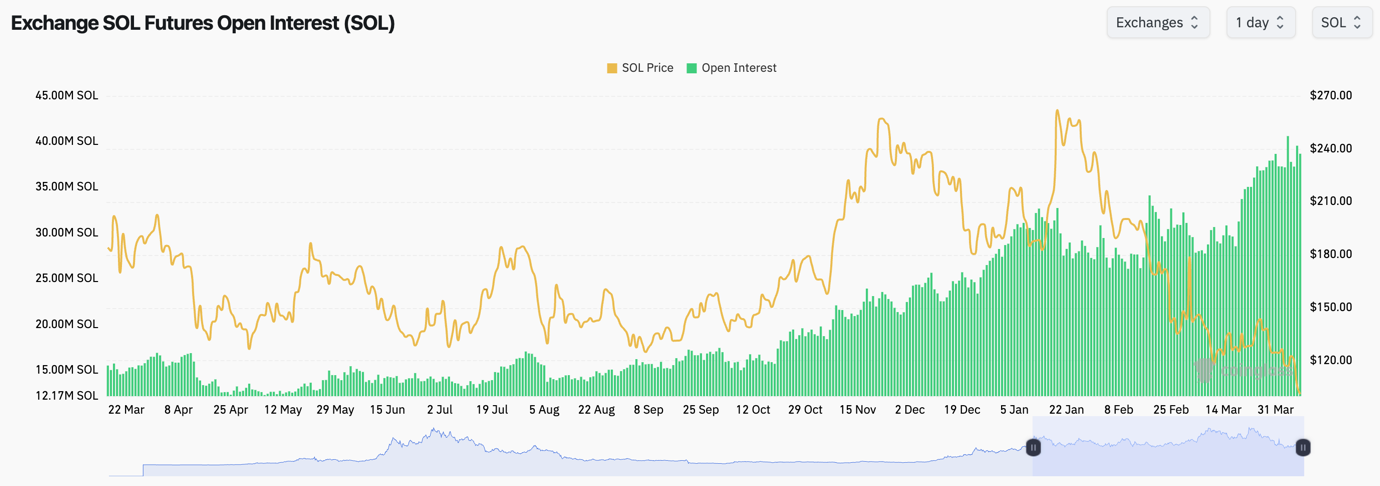
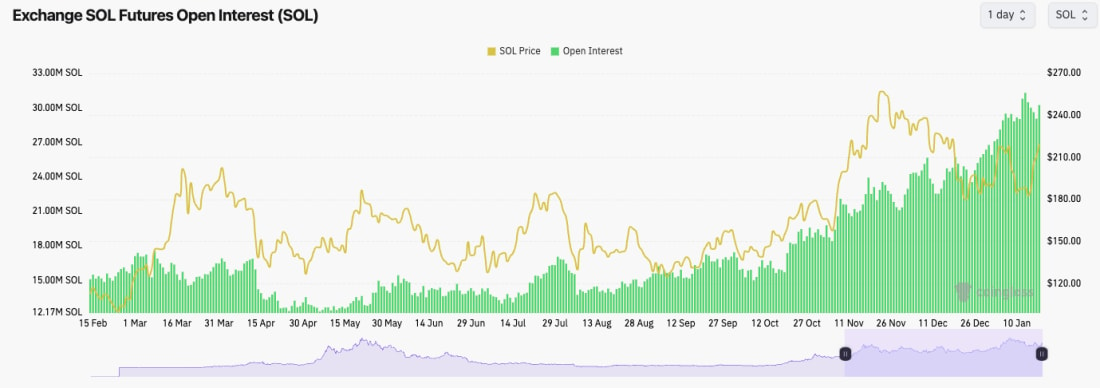
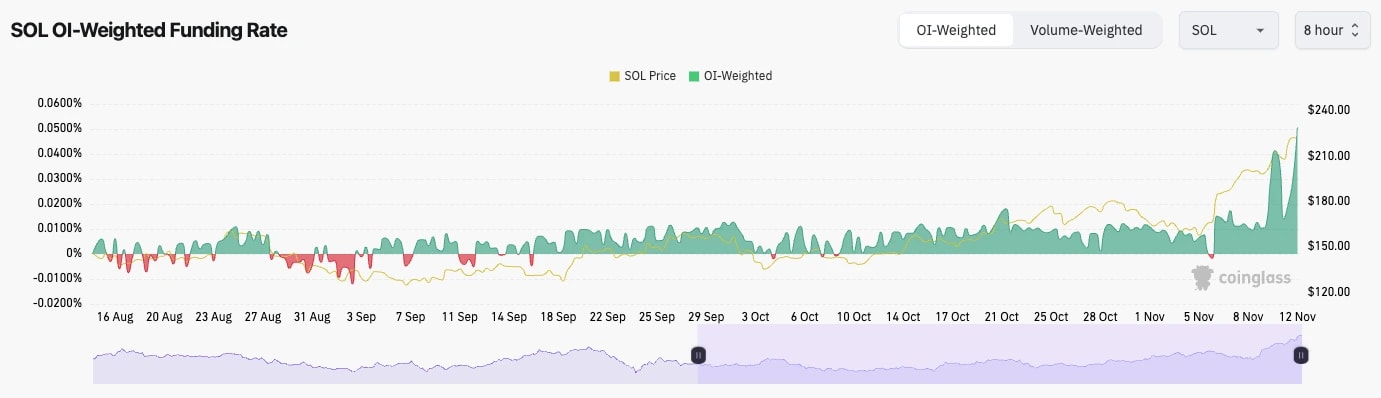
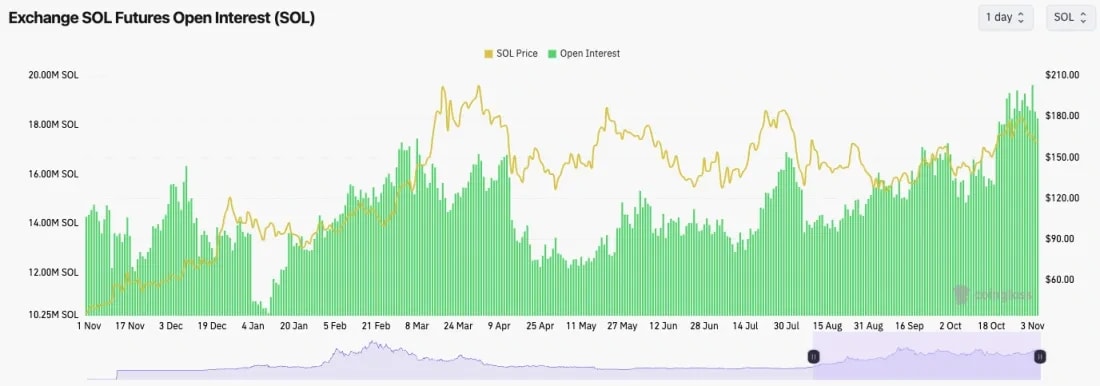
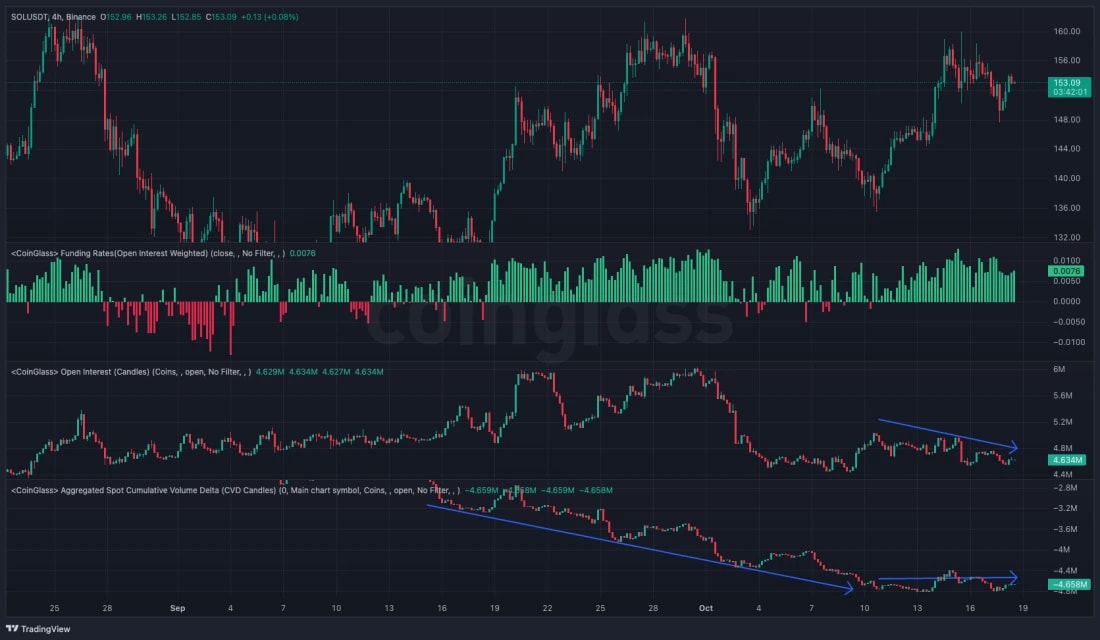
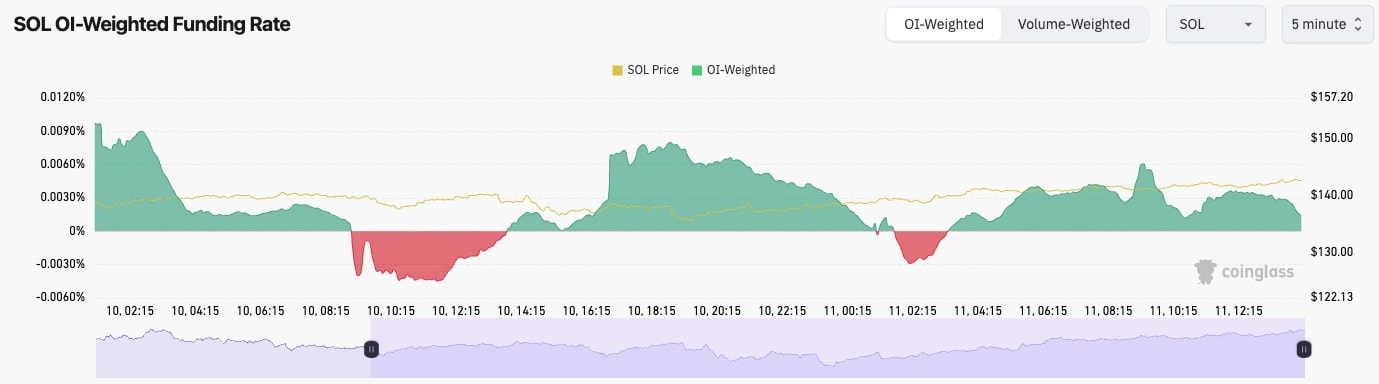
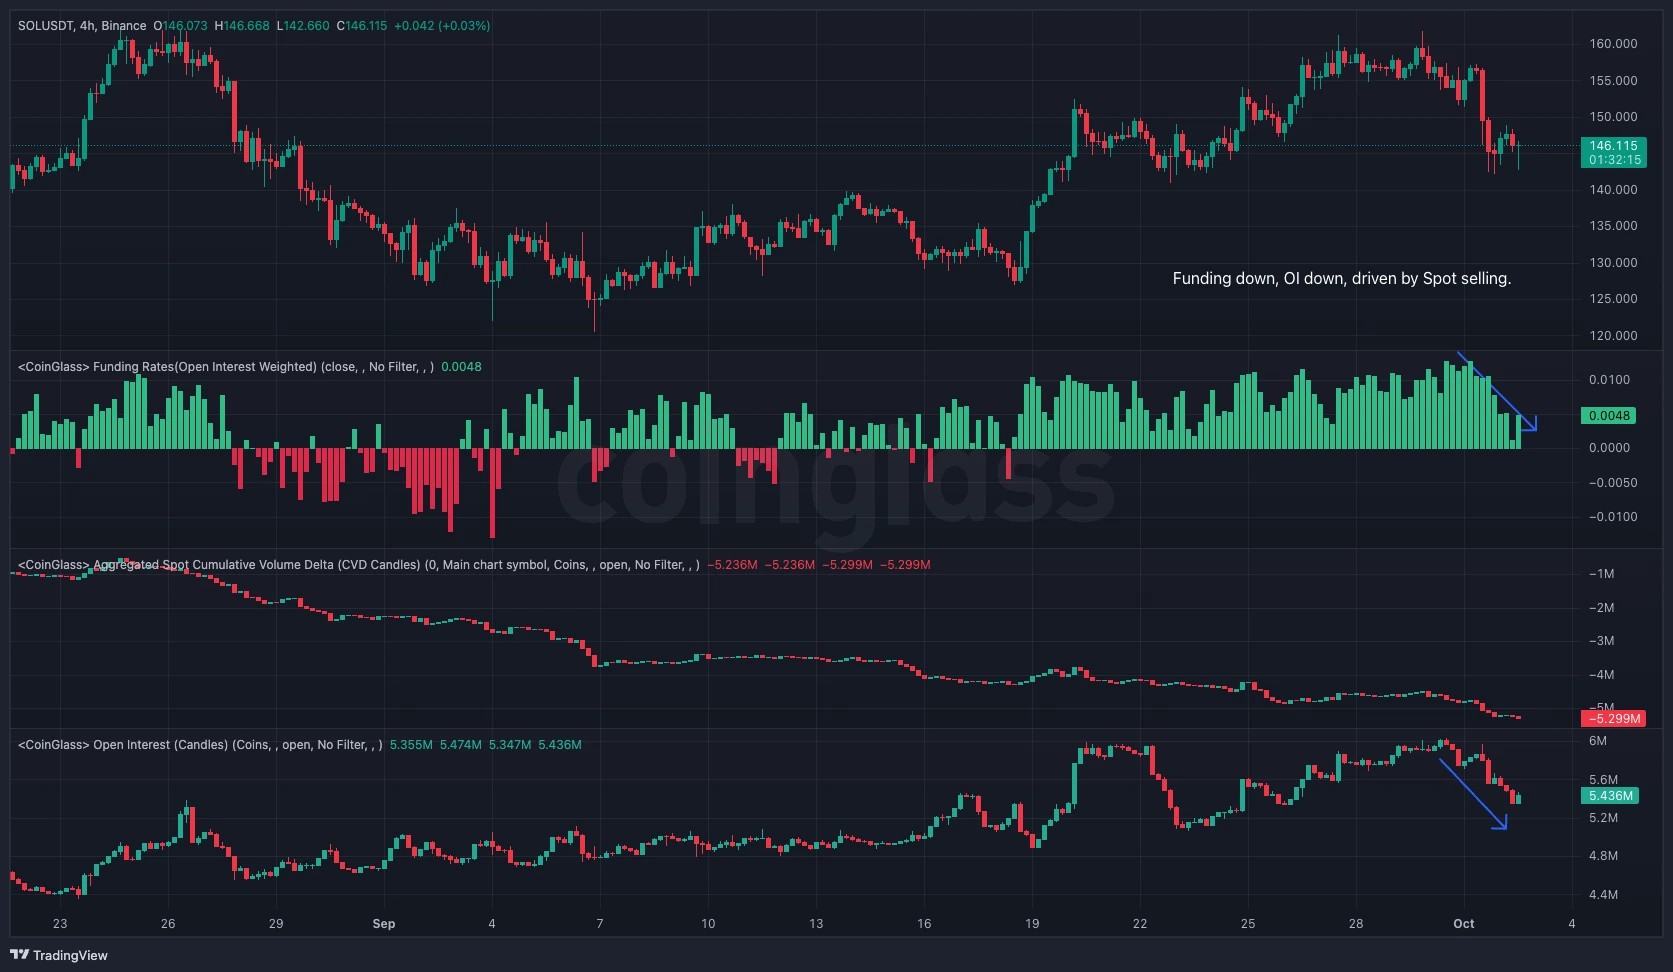
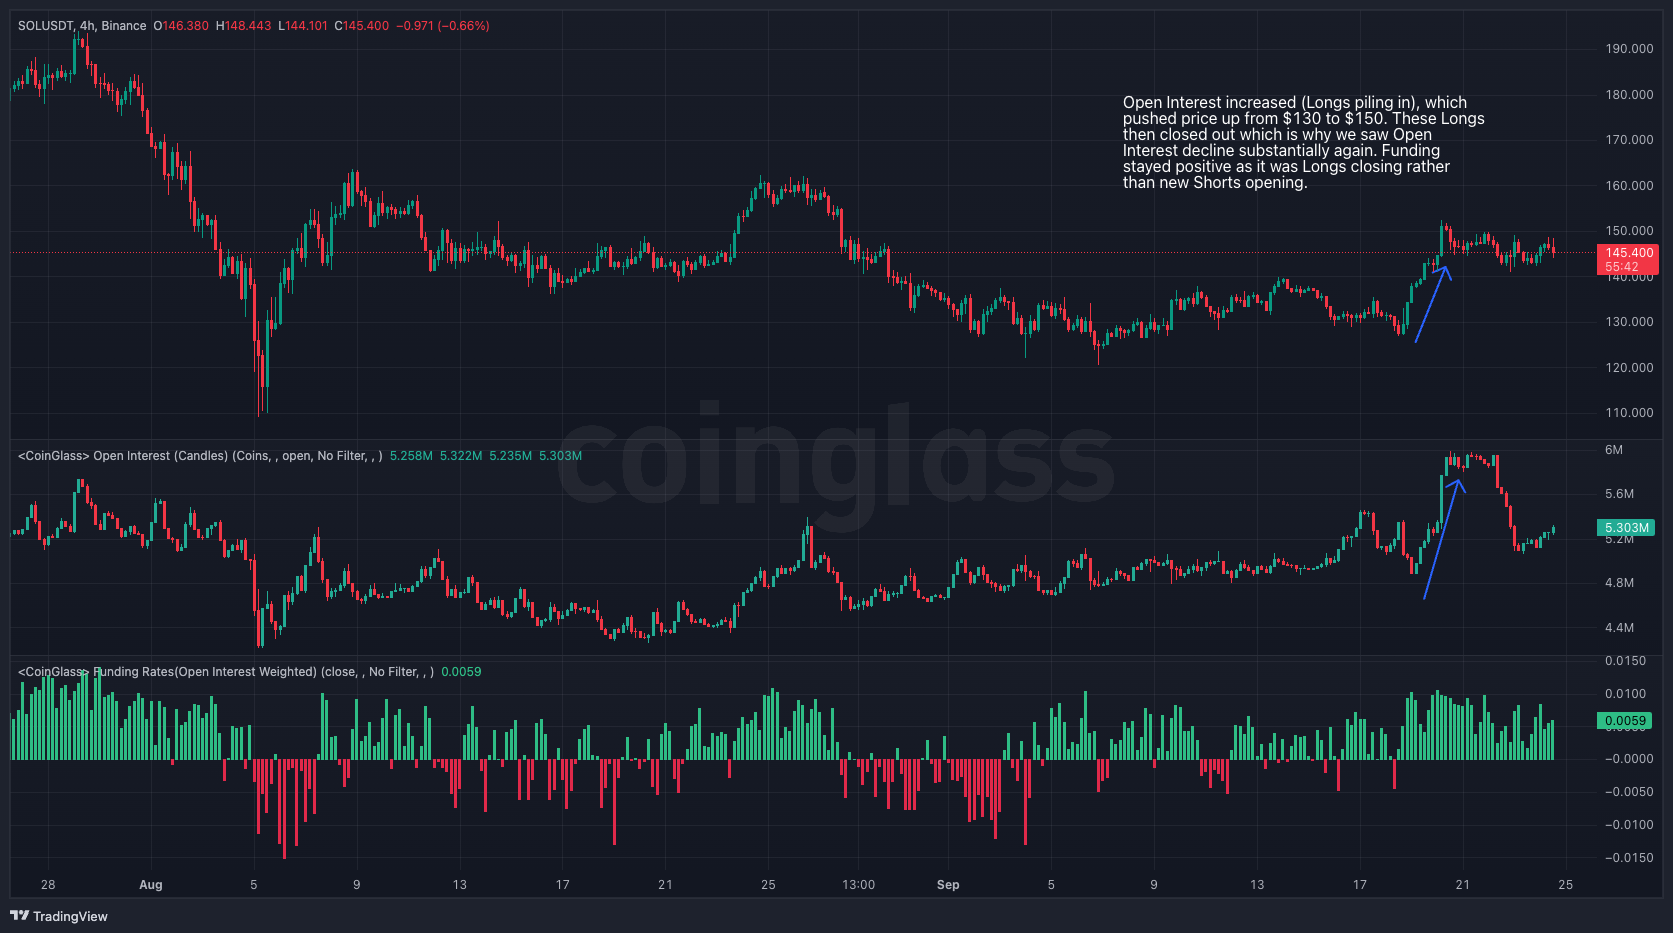
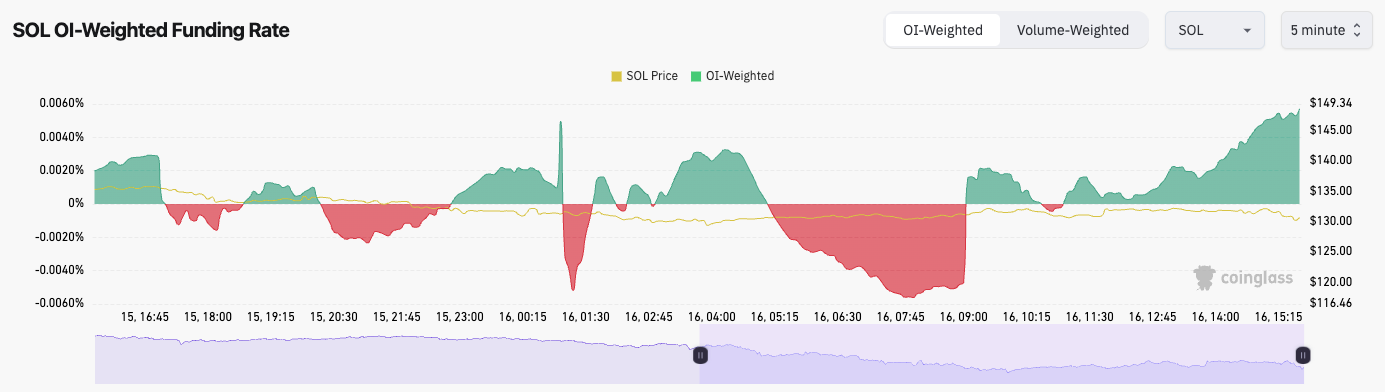
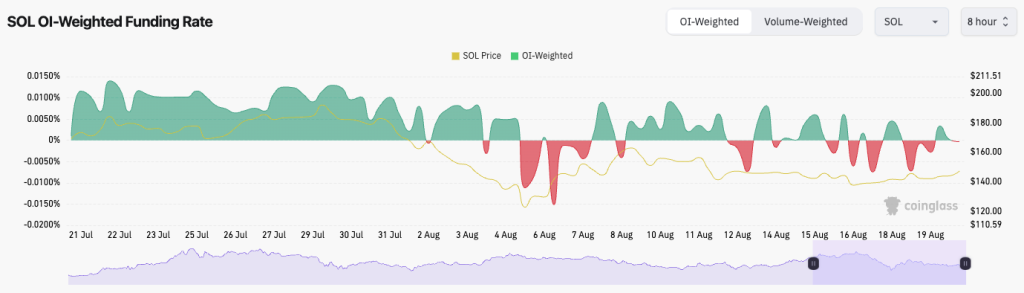
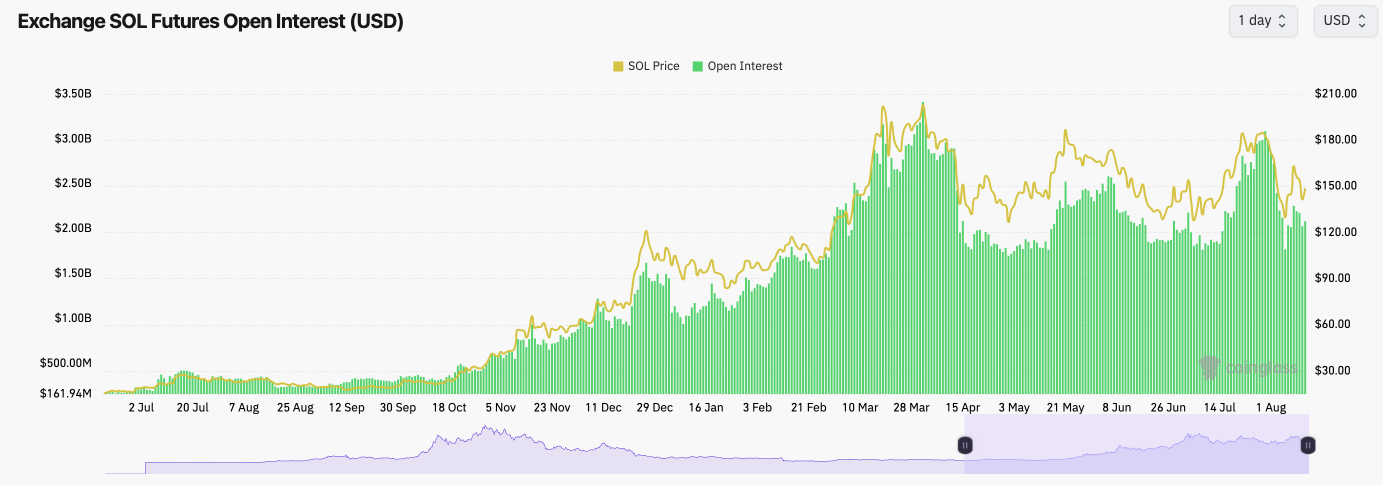
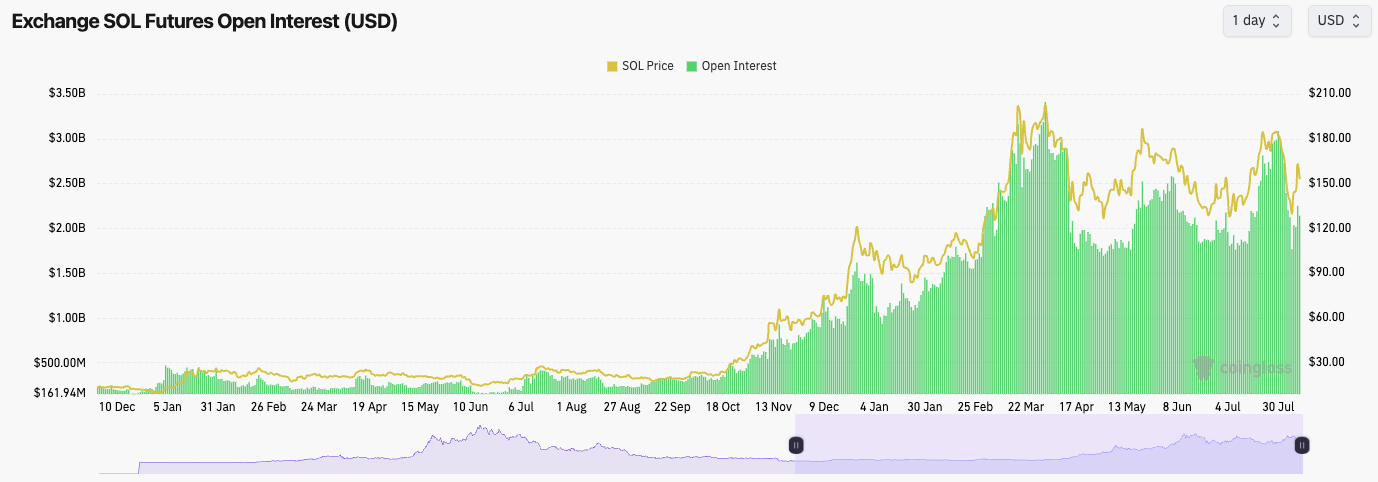
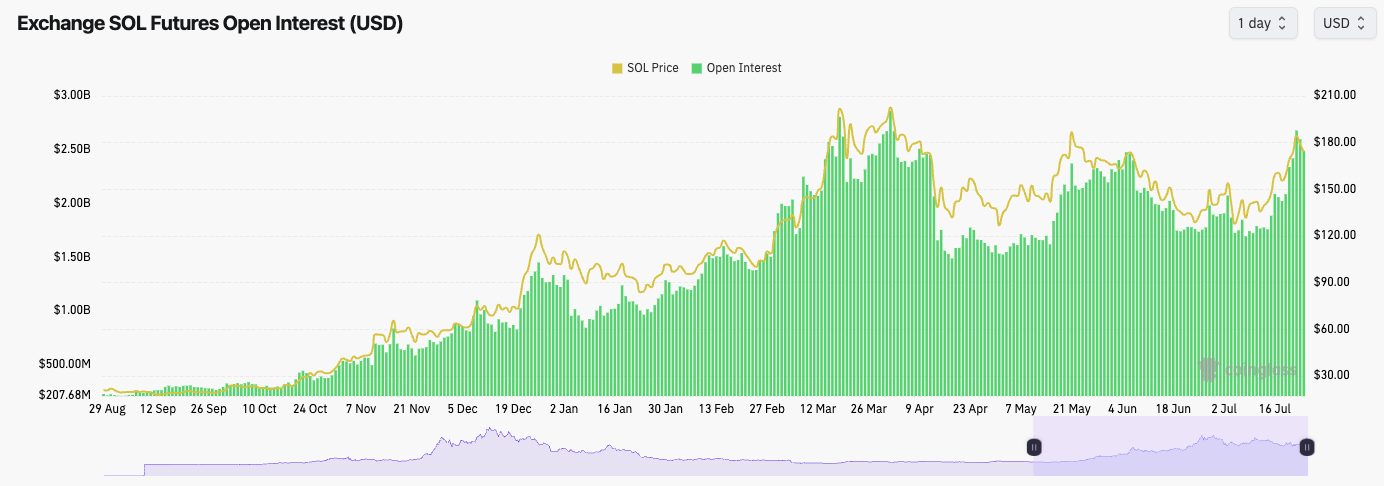
SOL's Open Interest has increased on today's price bounce, but previously it has decreased as the price has moved lower. This suggests there's a consistent bias amongst traders to Long SOL, hence the unwinding of OI when the price moves down.
SOL's Funding Rate is positive, but not in frothy territory.
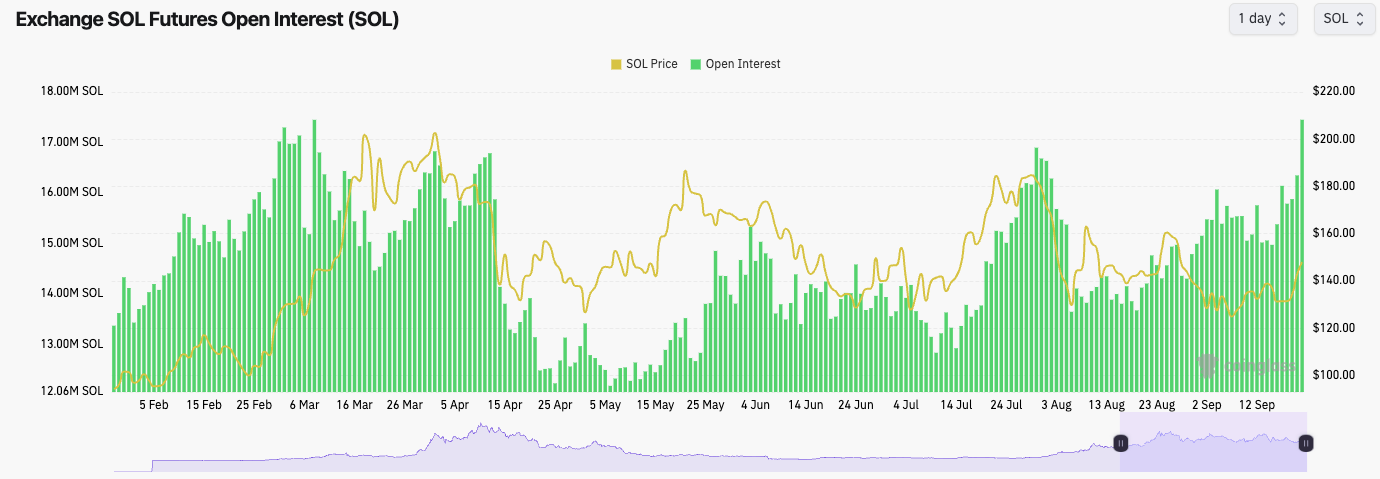
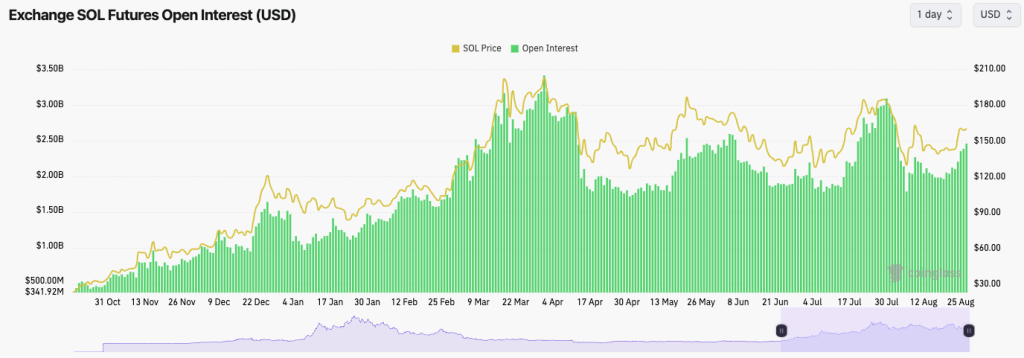
SOL's Open Interest (by USD value):
Technical analysis
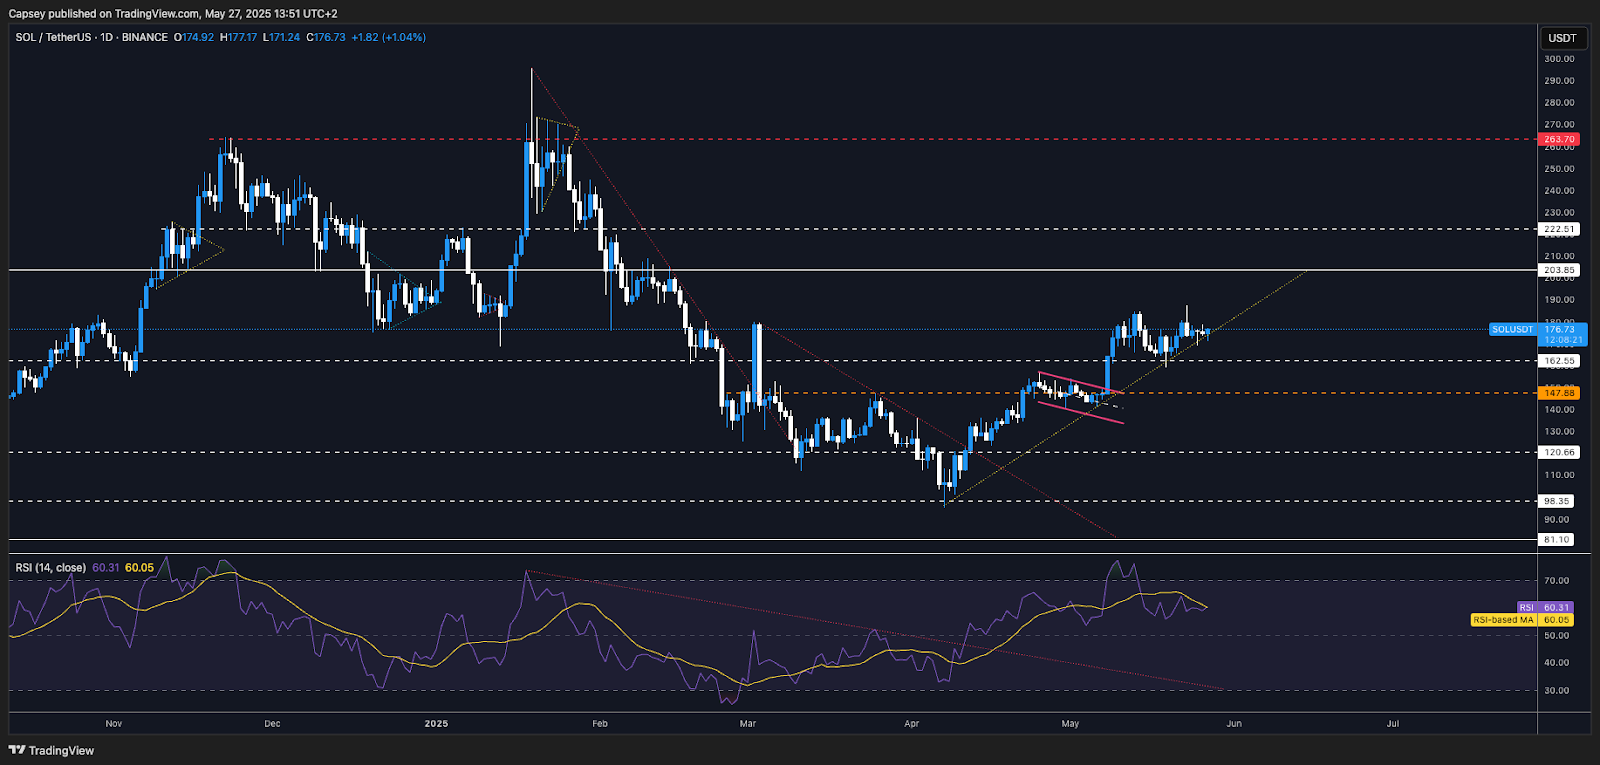
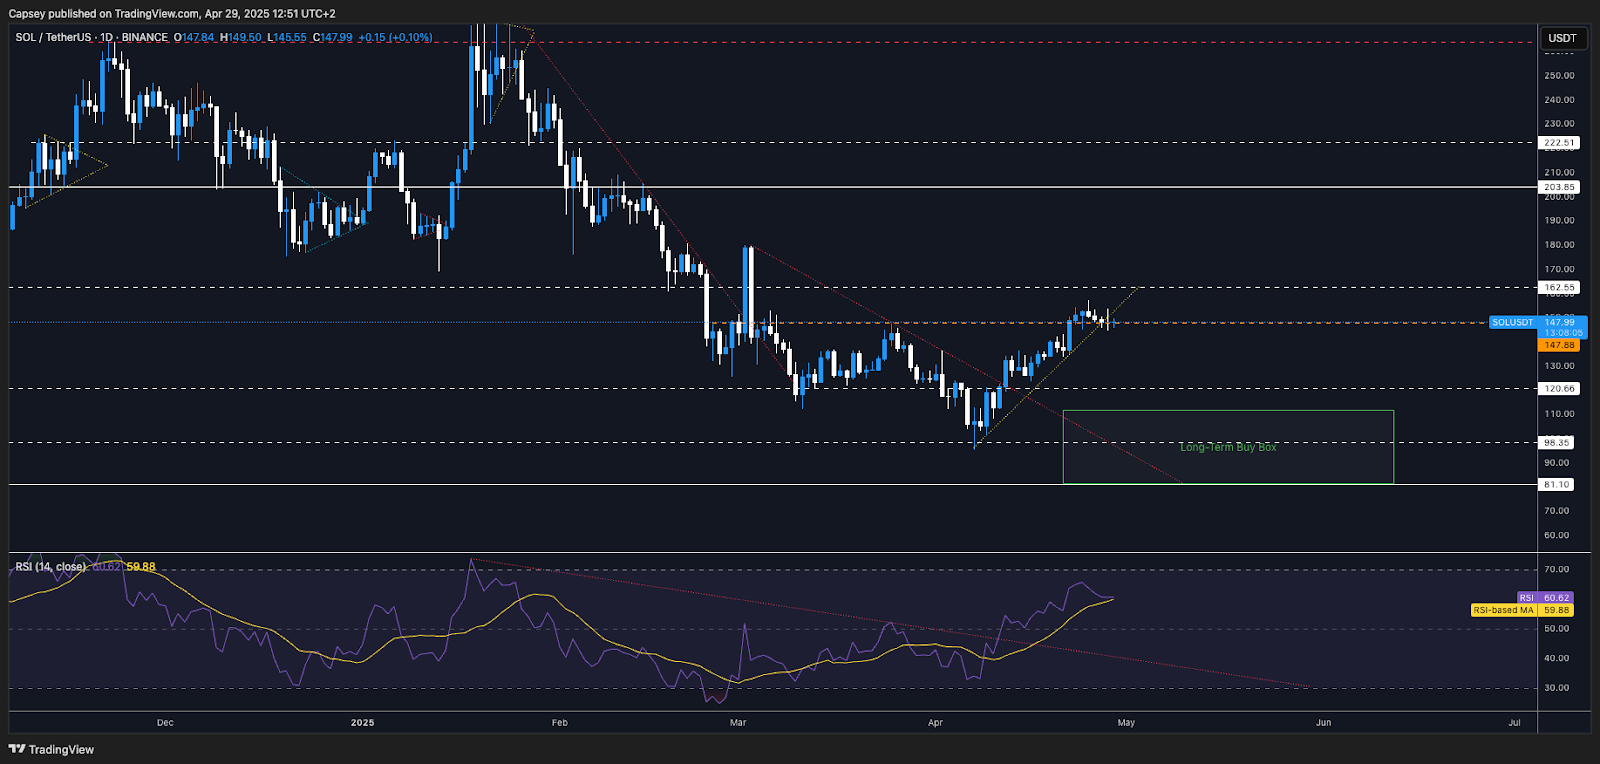
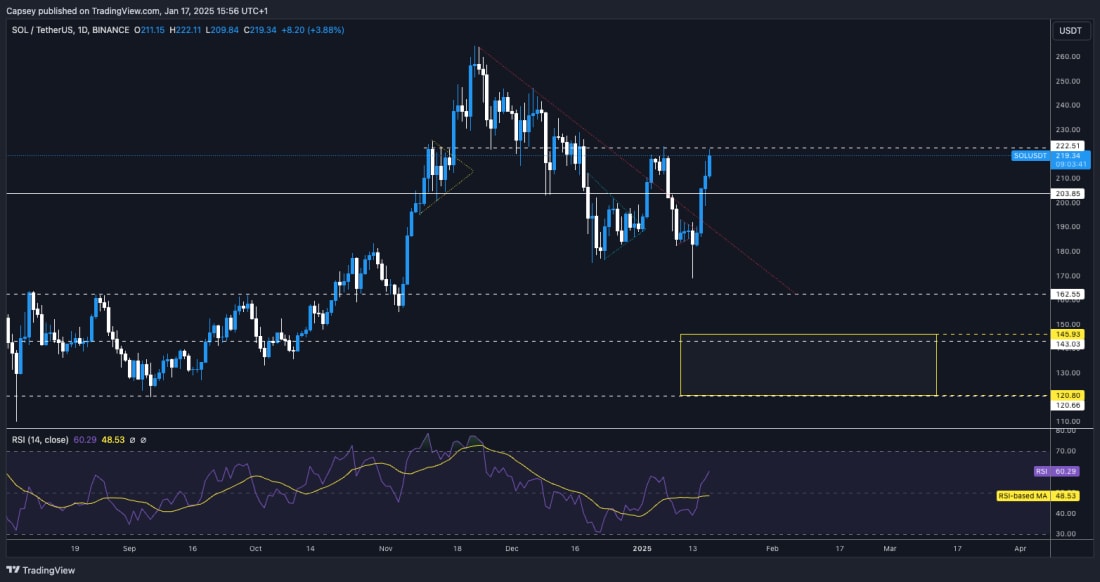
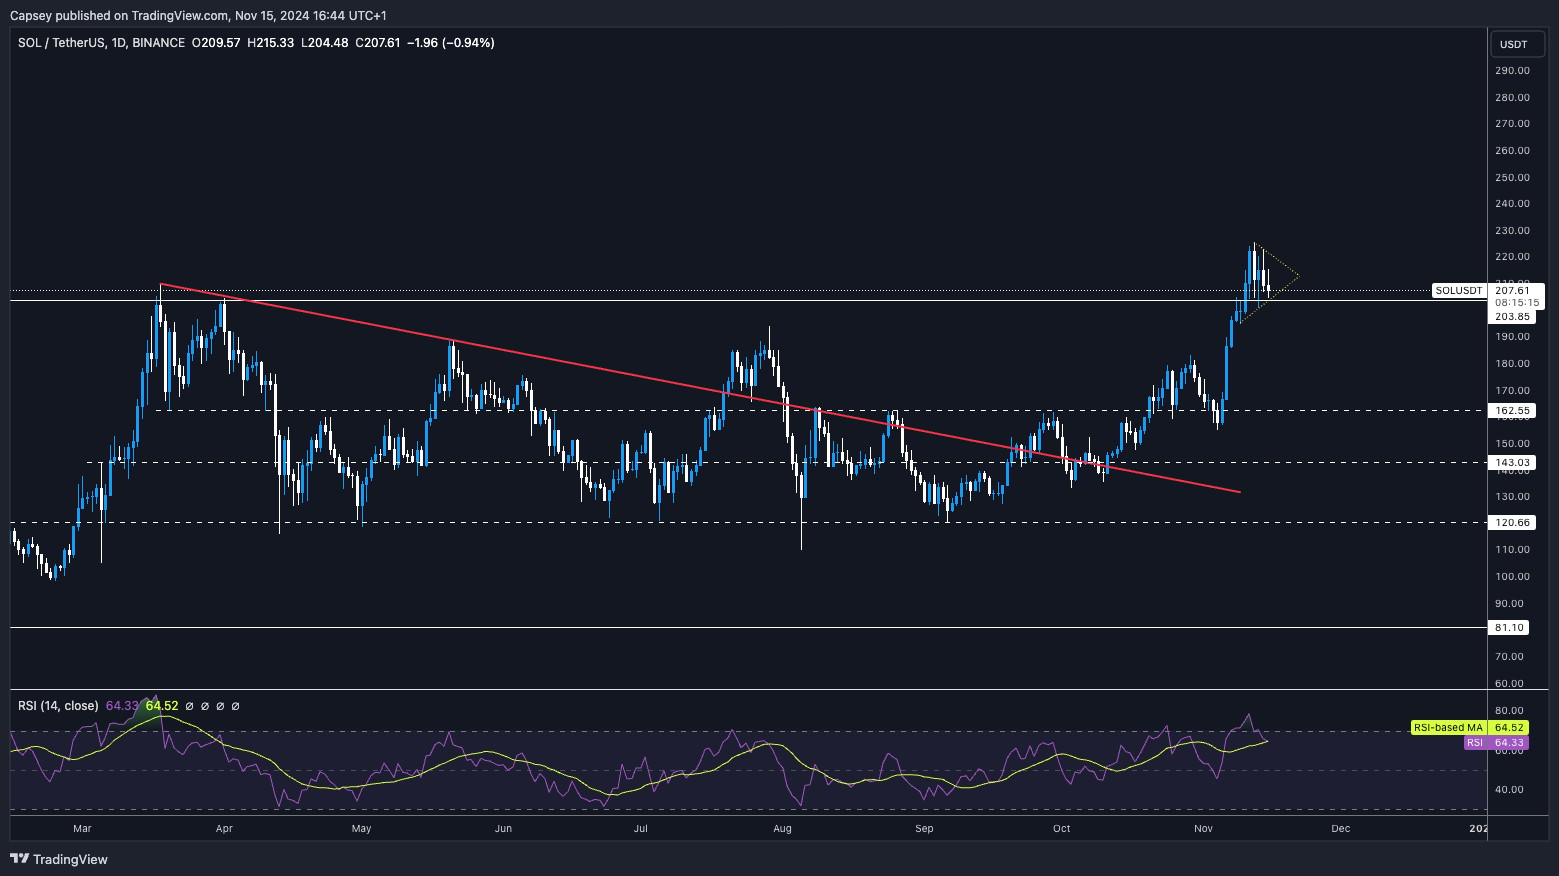
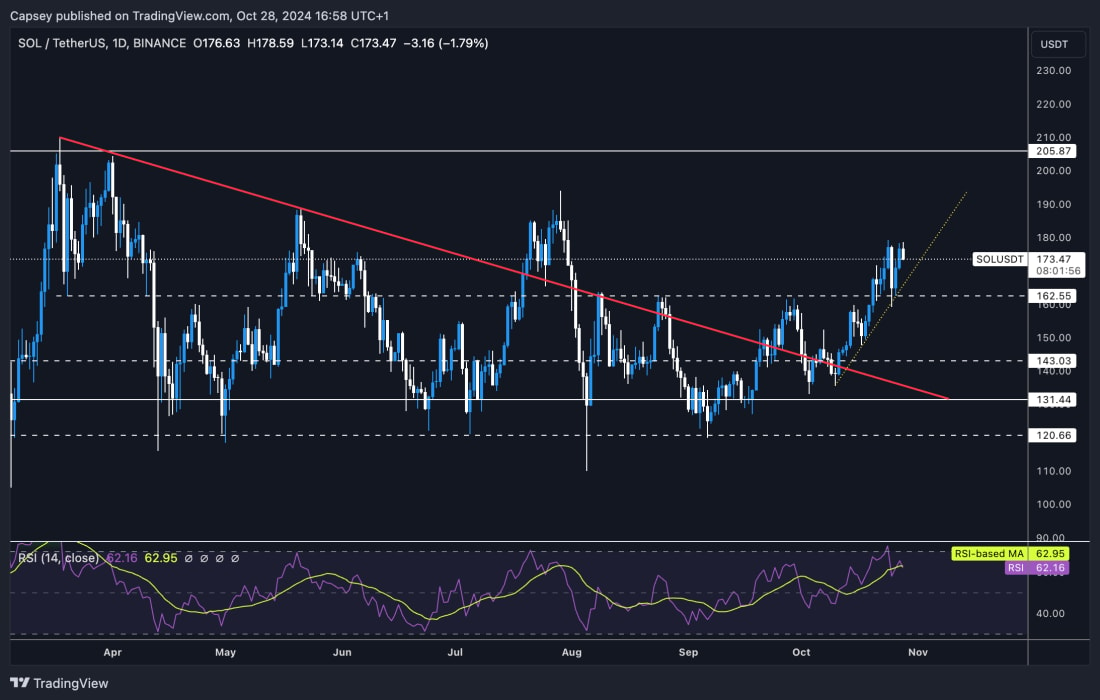
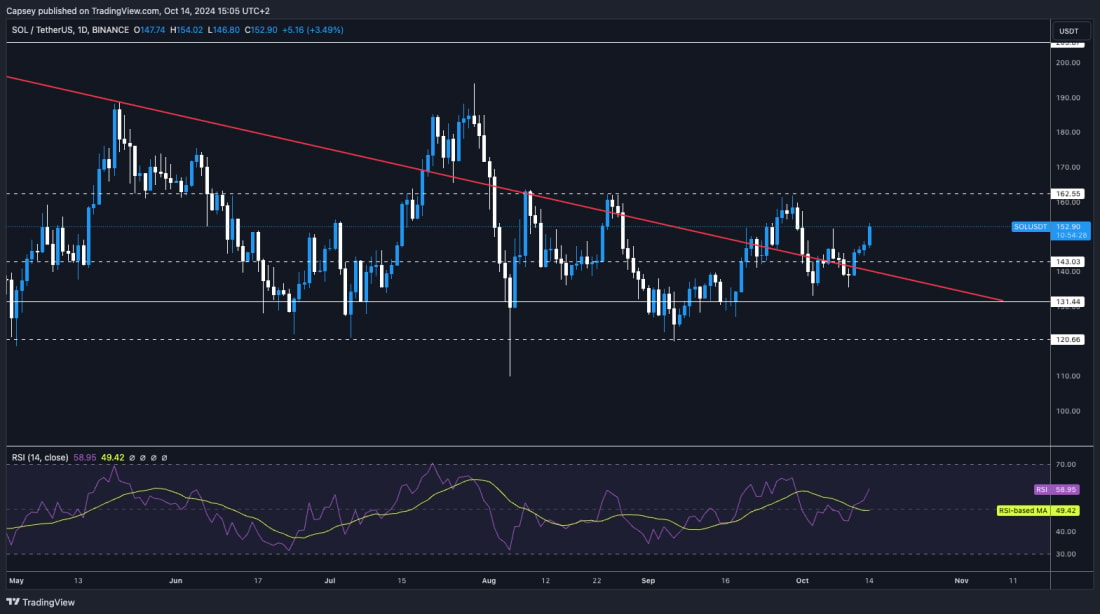
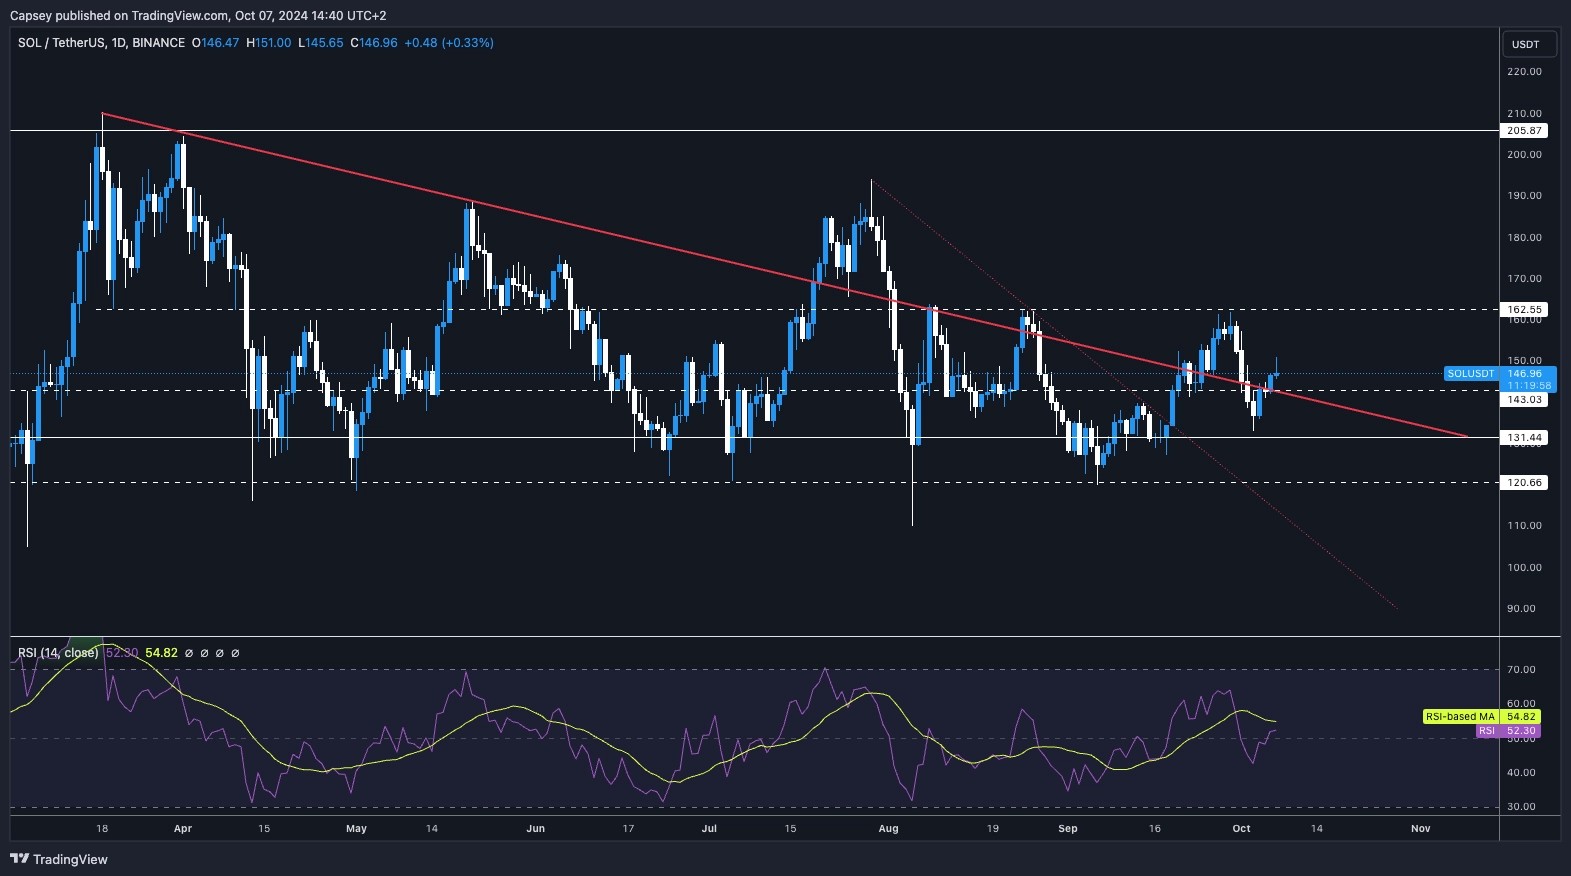
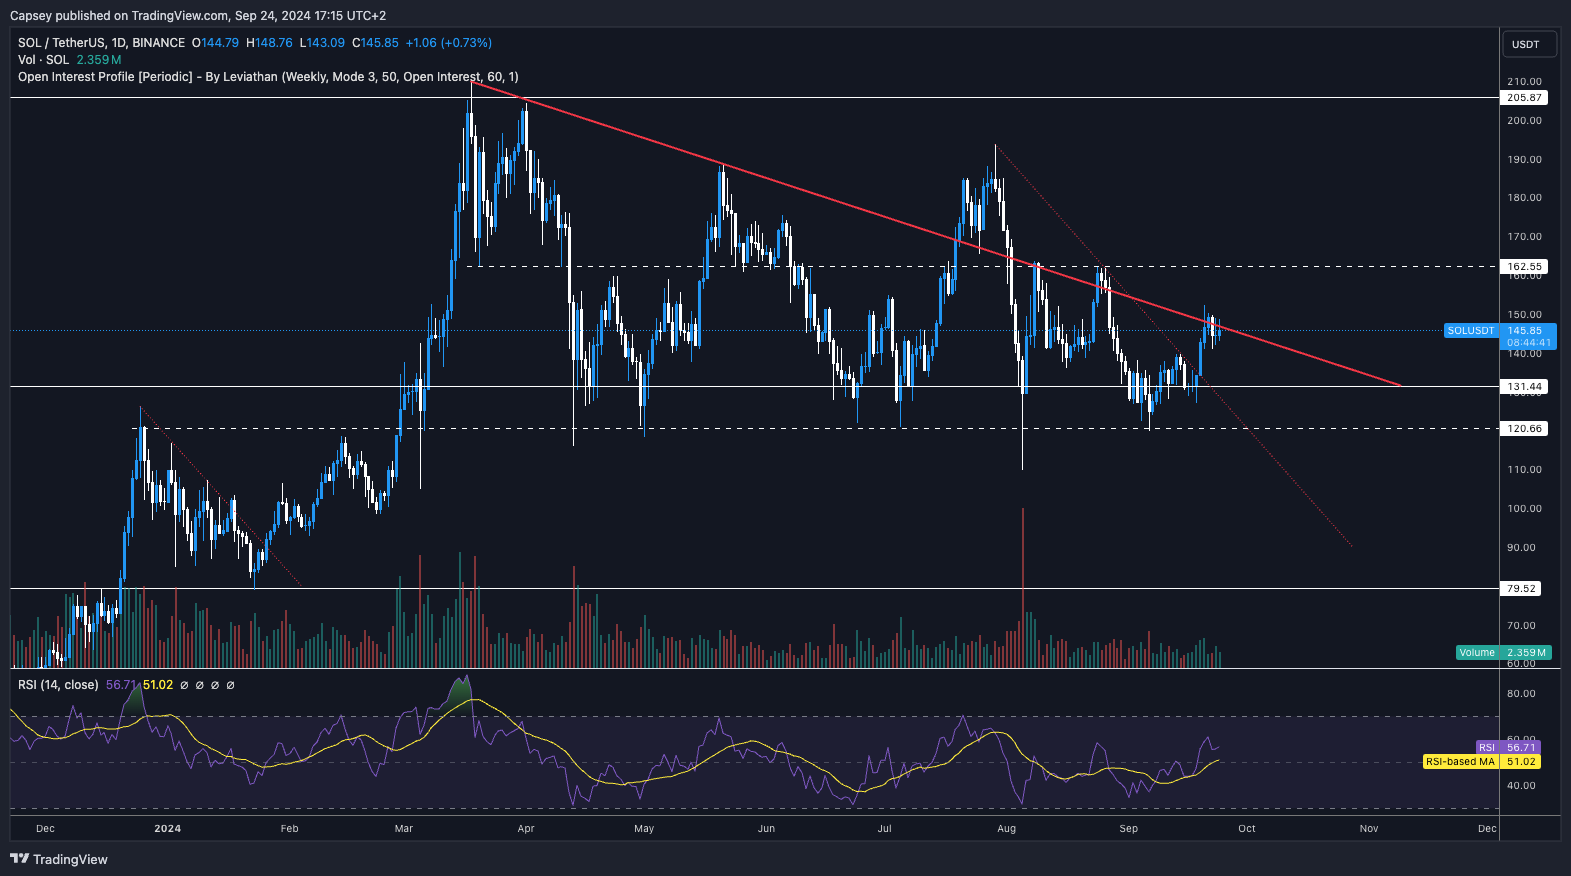
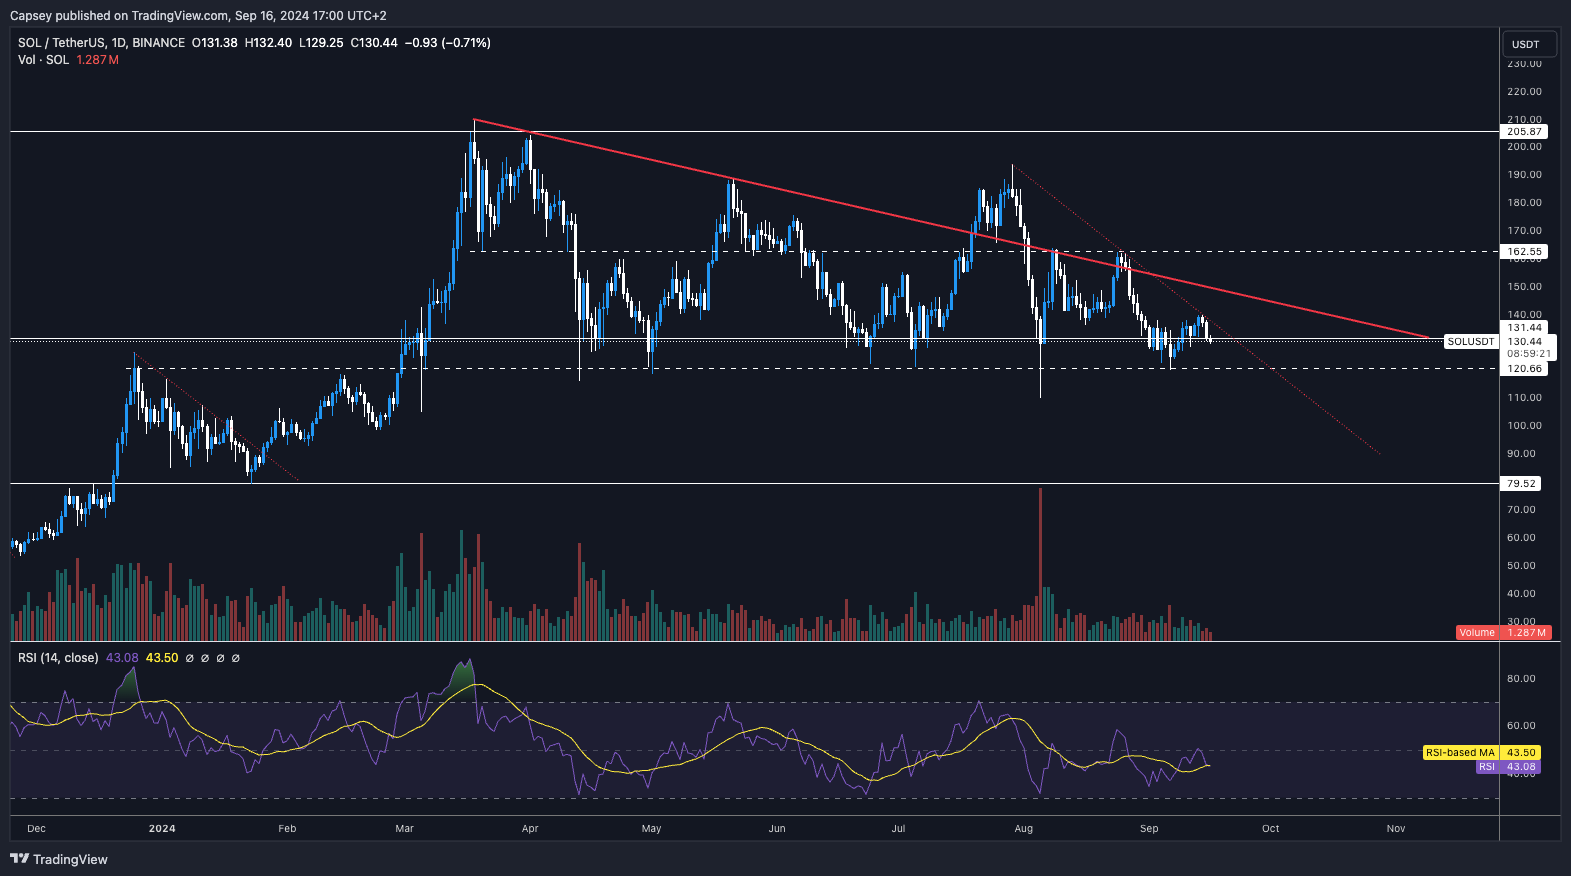
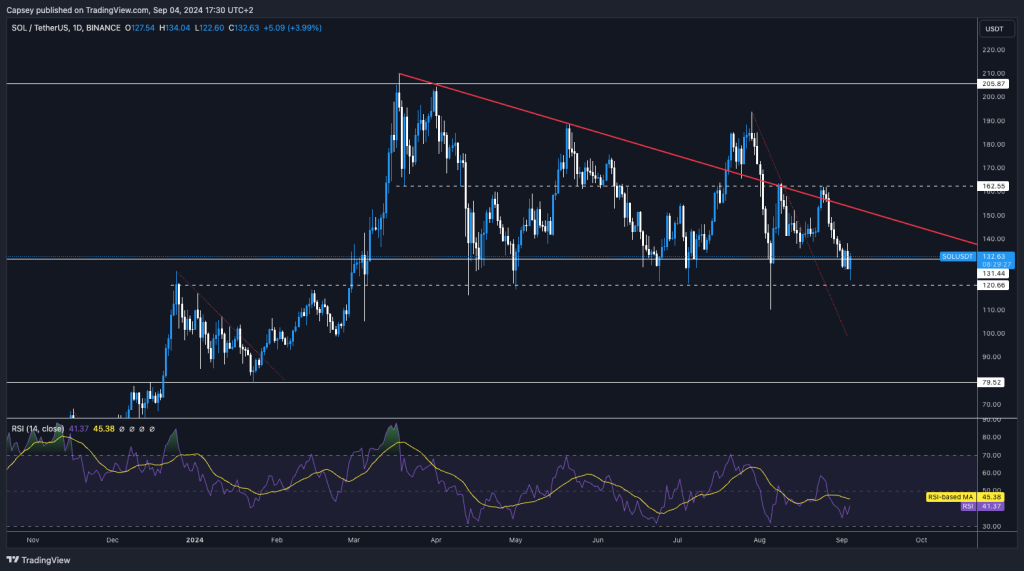
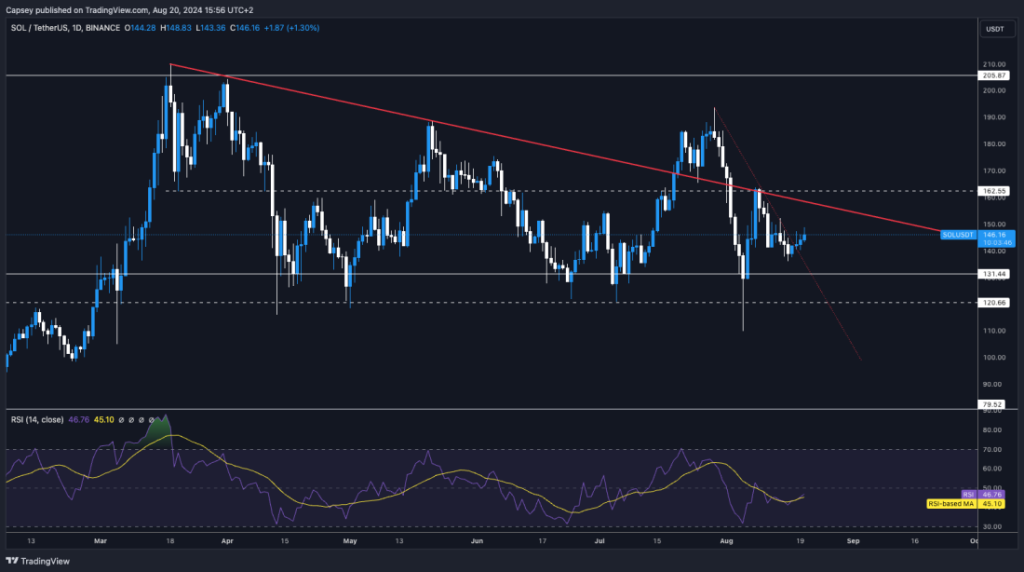
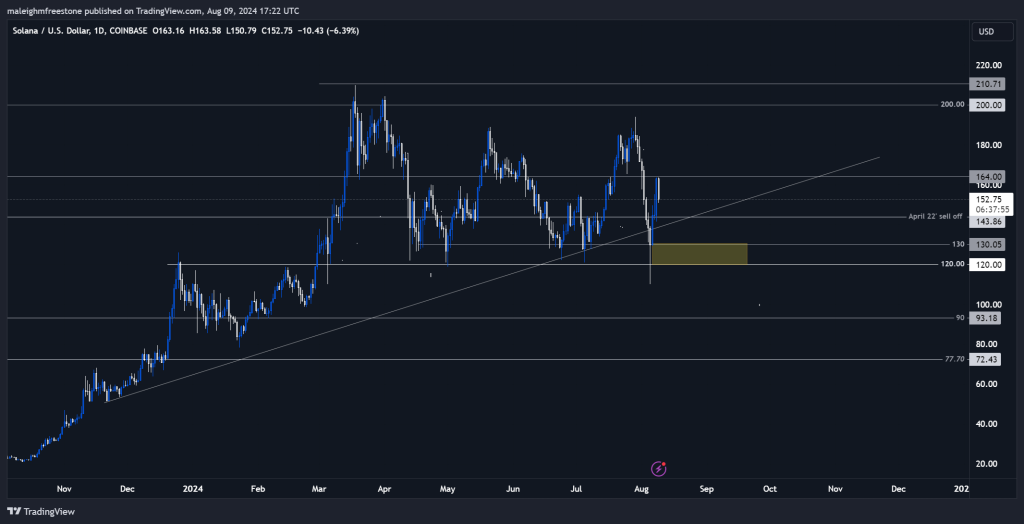
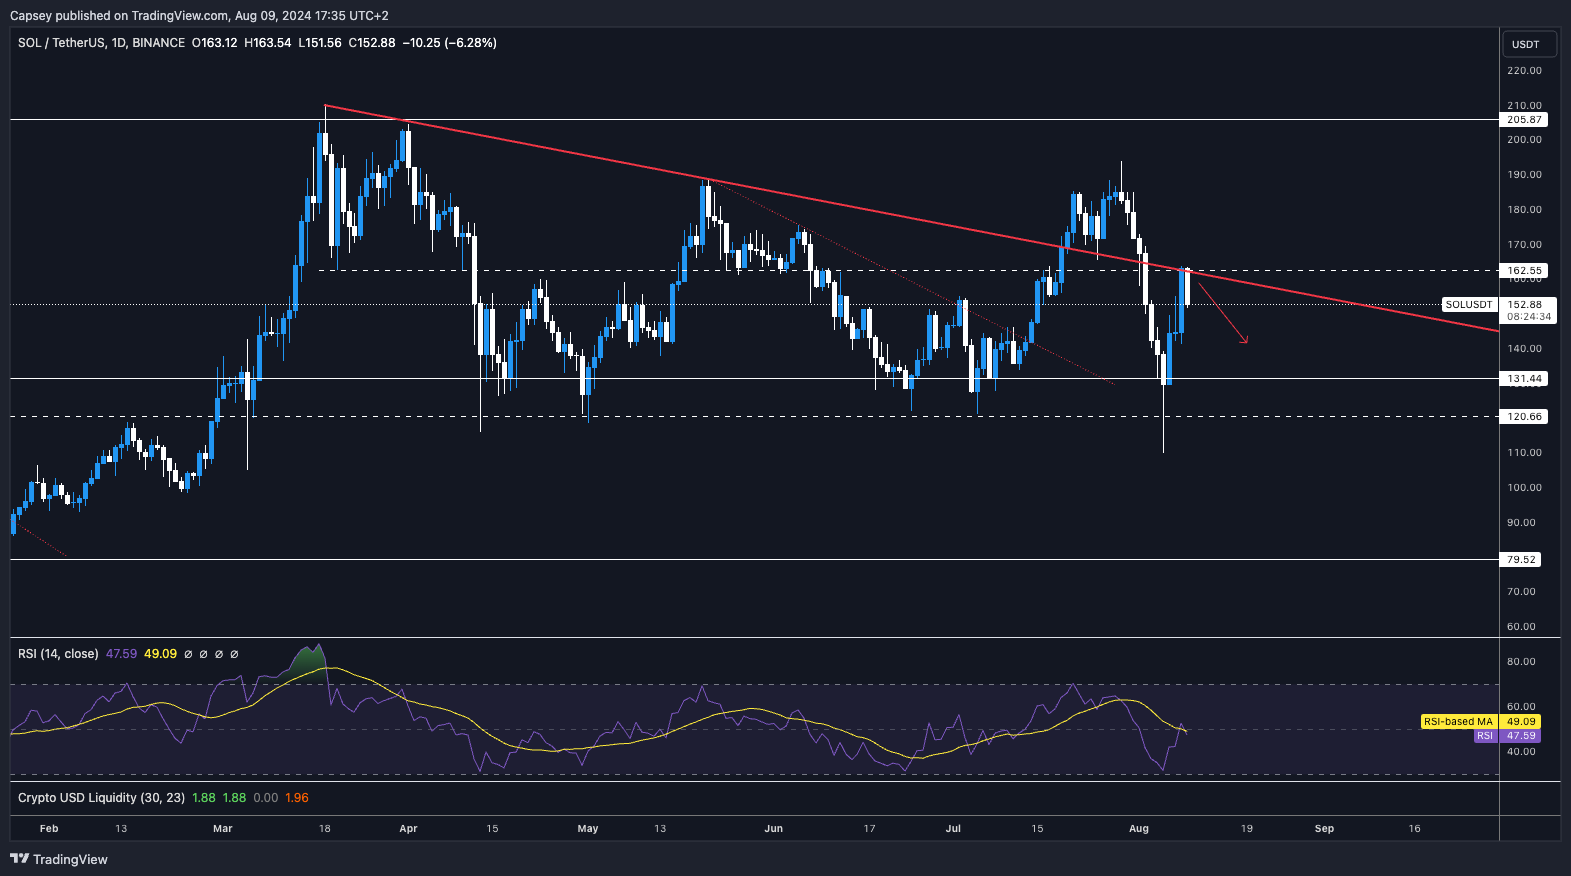
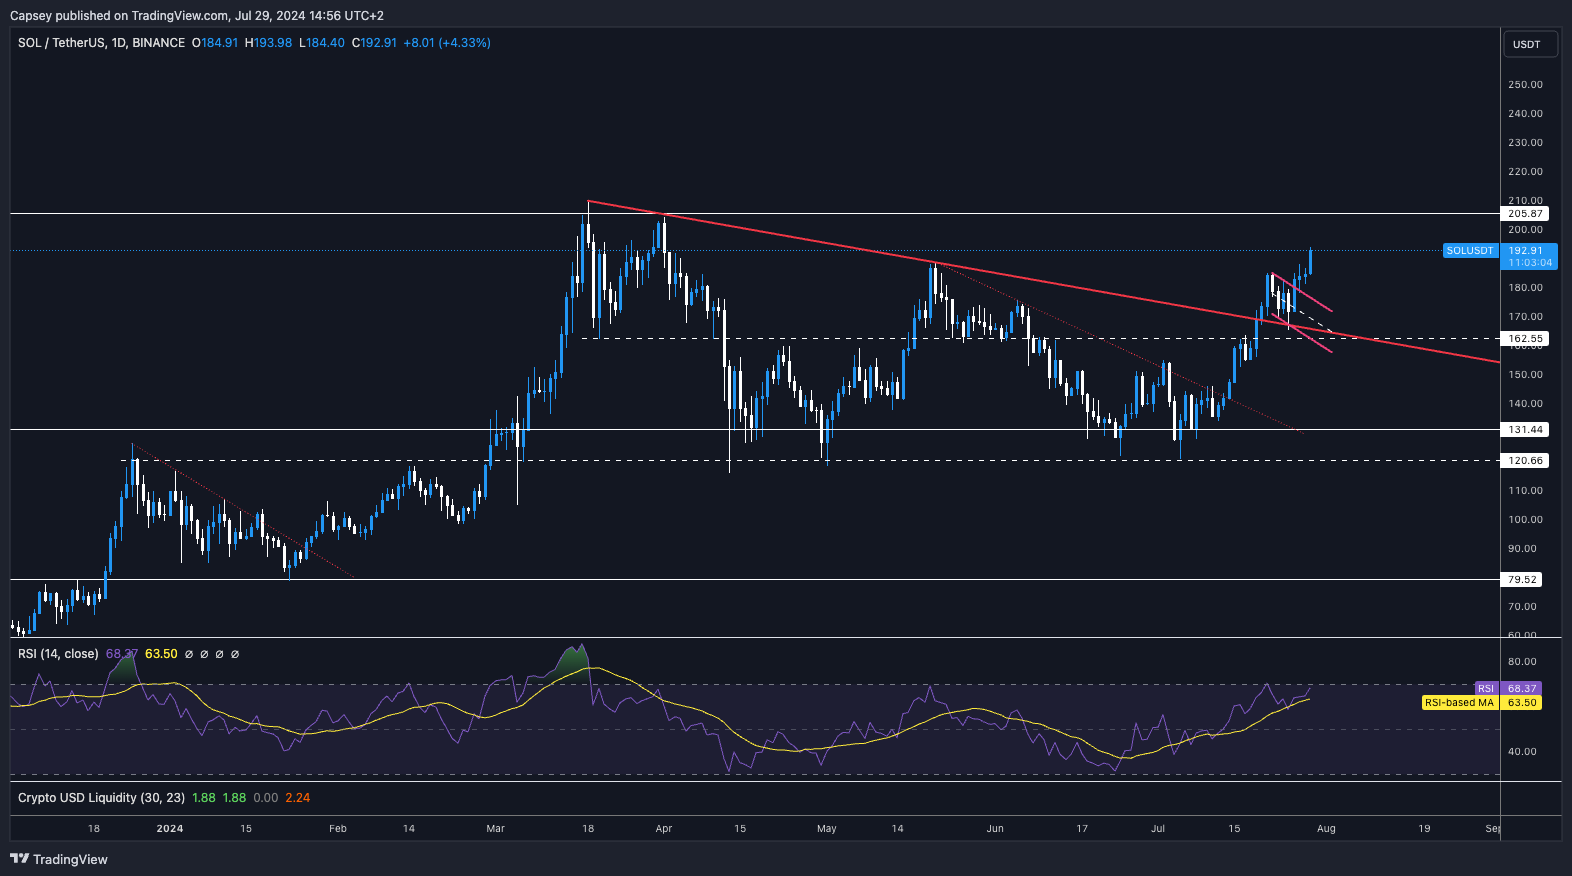
We previously identified the Yellow Box as a key area for SOL and its price. Above the Yellow Box, and price action should remain bullish; below it, and we can see further downside.
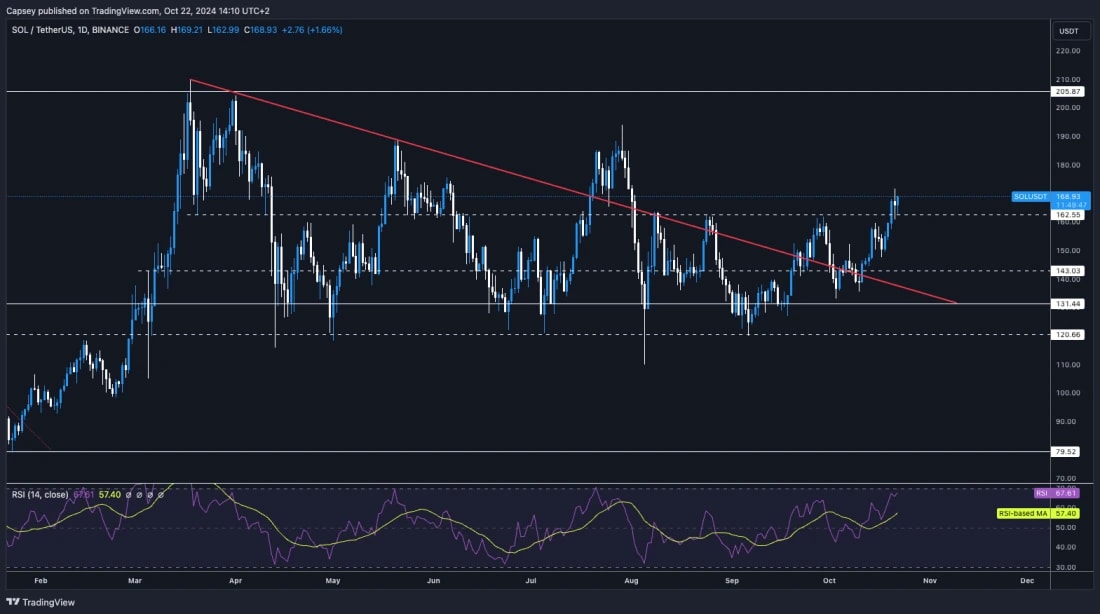
SOL has pulled back to a key horizontal support at $144 where price has then bounced from.
Price is now retesting the underside of the Yellow box, which is a local resistance at $157.
SOL could now potentially be range-bound, like ETH, between the $144 support and the $164 horizontal resistance.
If the price breaks down from the $144 horizontal support, then $135 is the next local support. If the price breaks out of $164, the next upside target is $184.
The RSI is in a healthy position. It's in middle territory, but above its moving average.
Next Support: $144
Next Resistance: $164
Direction: Neutral
Upside Target: $184
Downside Target: $144
Cryptonary's take
Like ETH, SOL may stay range-bound between $144 and $157 for now, with upside bias above $157. We're watching for signs of a convincing breakout in either direction, although we'd expect the breakout to be to the upside rather than the downside. The key upside levels for price to clear above are $157 and then $164.
If price were to fall below $144, we'd look to add SOL to our long-term bags, between $120 and $144. However, our expectation is that the price remains range-bound between $144 and $157 in the short term.
Bears take aim as SOL weakens further
06 June 2025
SOL is under pressure after a failed retest of resistance. With shorts growing and downside levels in focus, the next move could define the medium-term trend.
Disclaimer: This is not financial or investment advice. You are responsible for any capital-related decisions you make, and only you are accountable for the results.
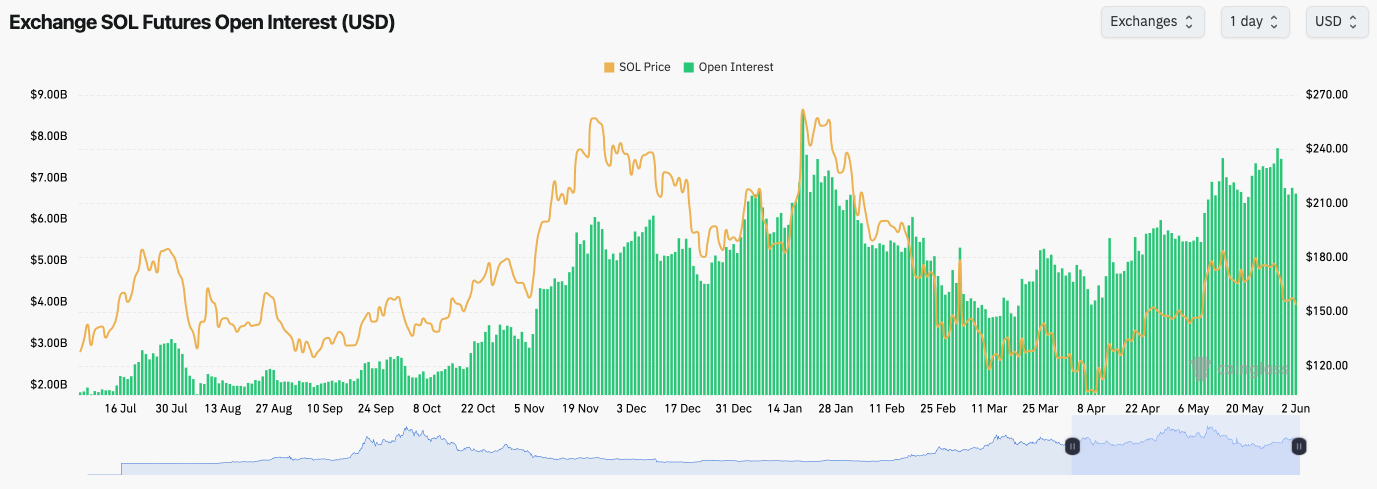
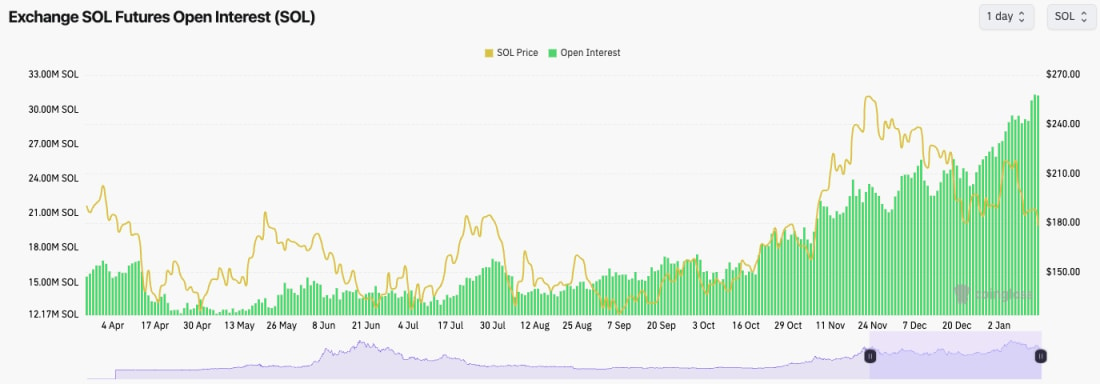
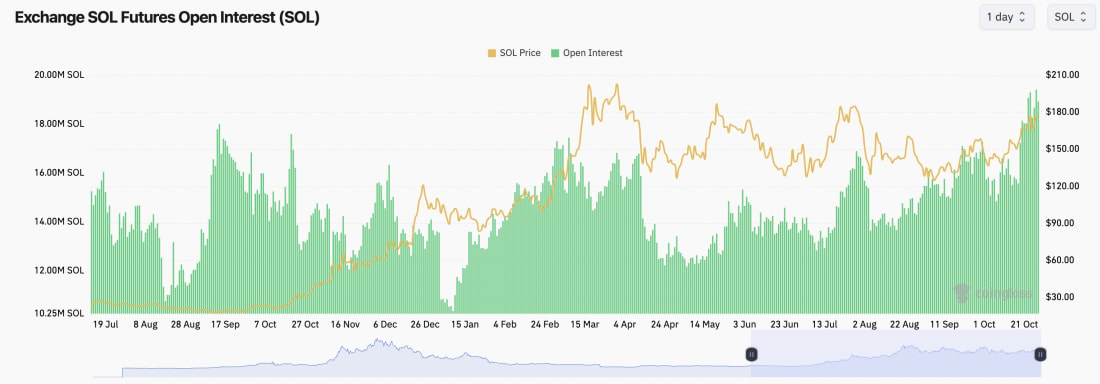
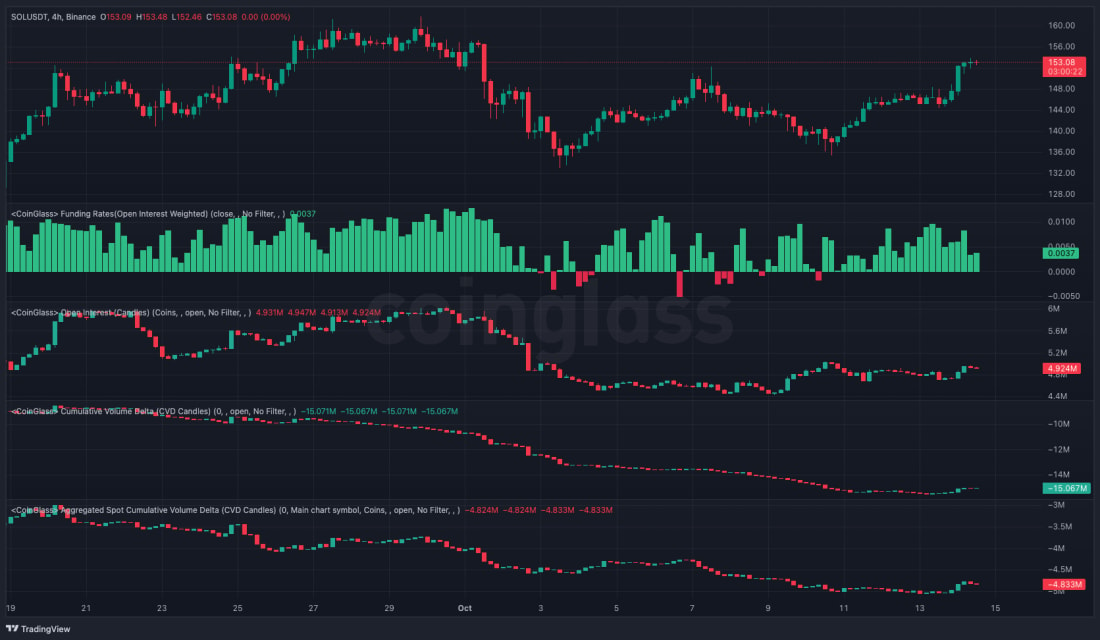
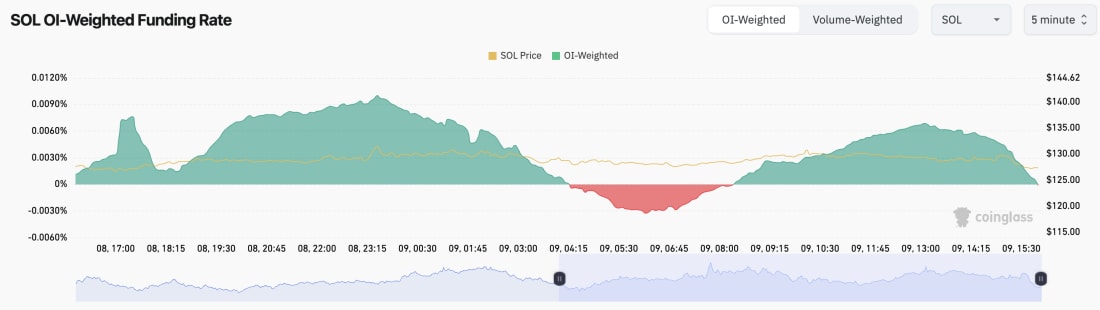
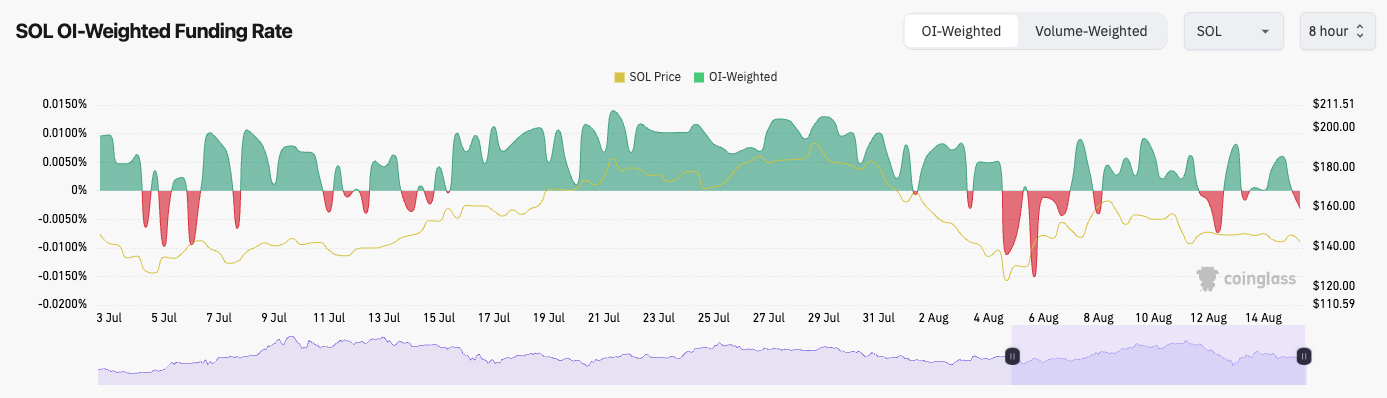
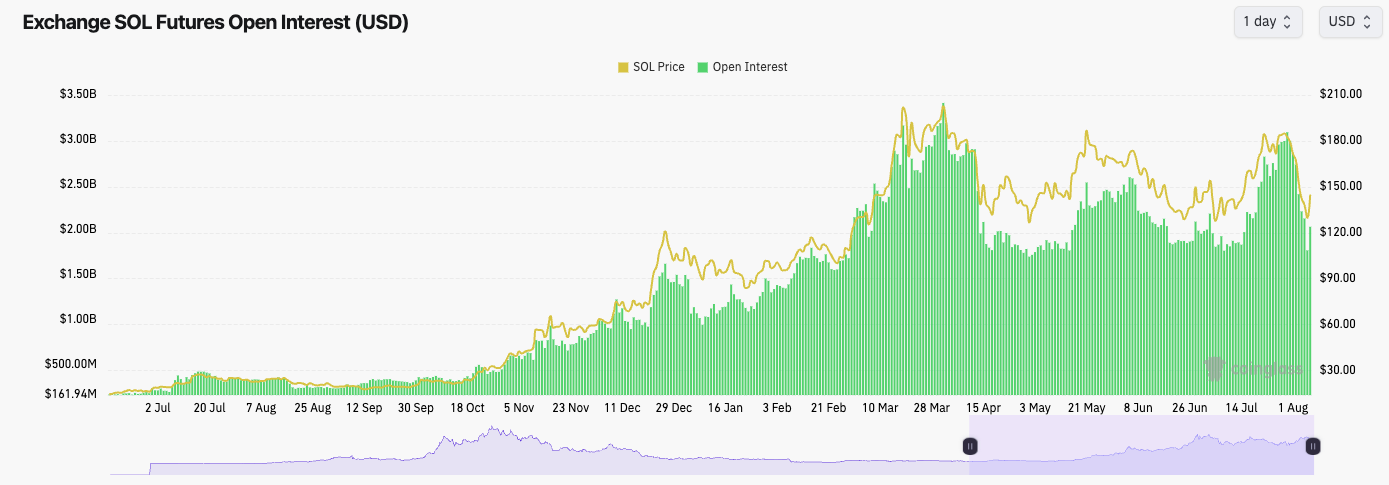
SOL's Open Interest remains quite high considering the approximate 20% pullback we've seen in price.
SOL's Funding Rate is negative at -0.01% indicating that there are more Shorts than Longs, and this might open the door for a potential Short-squeeze, although it would unlikely be of huge magnitude.
SOL's Open Interest (by USD value):
Technical analysis
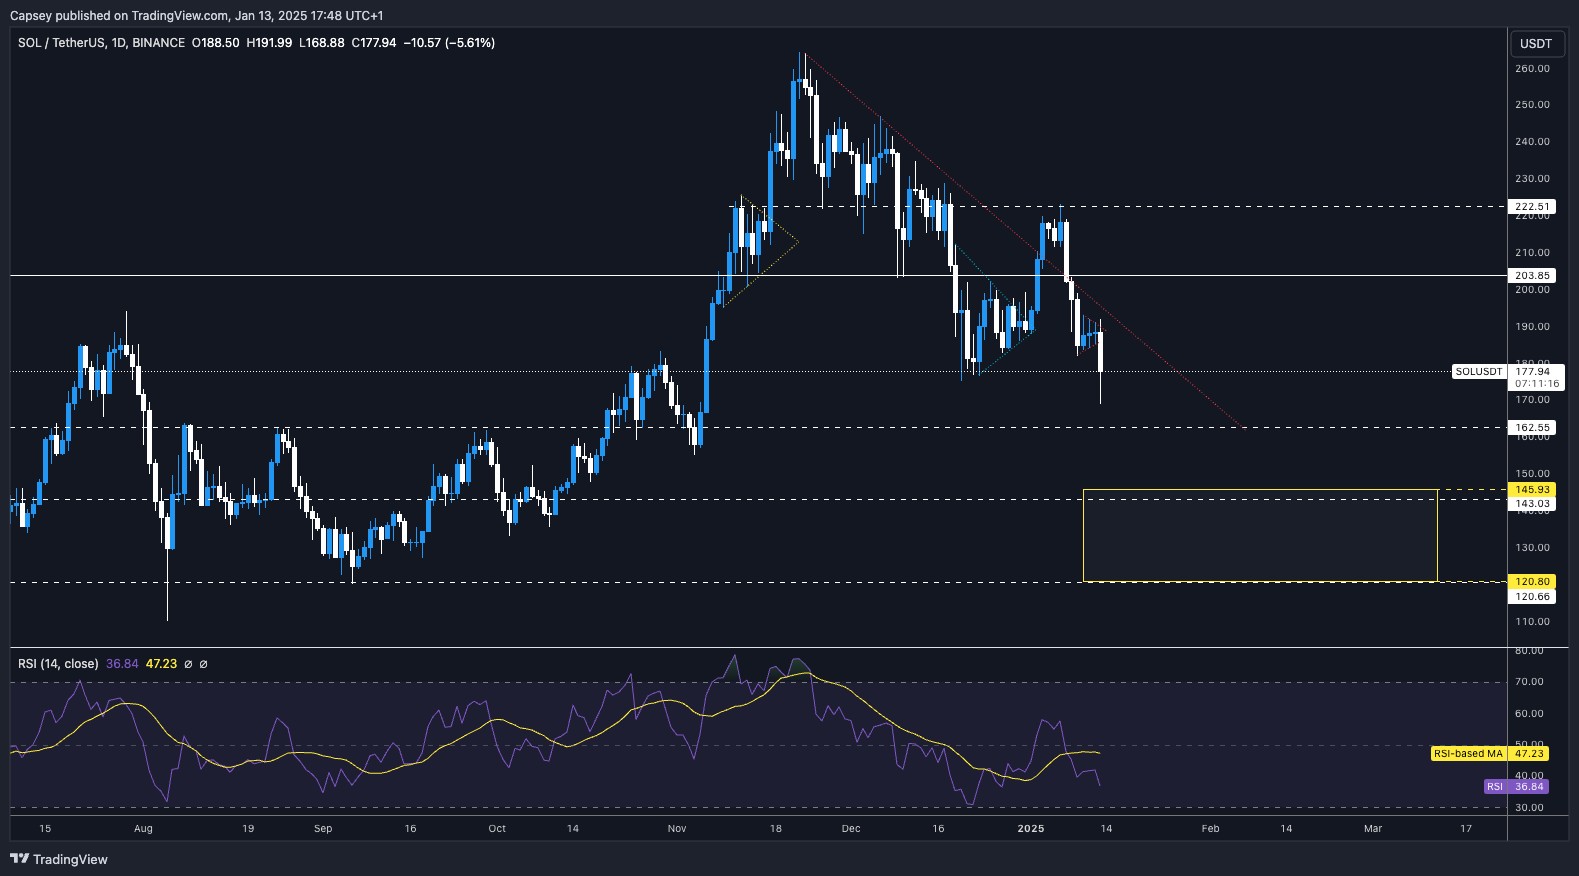
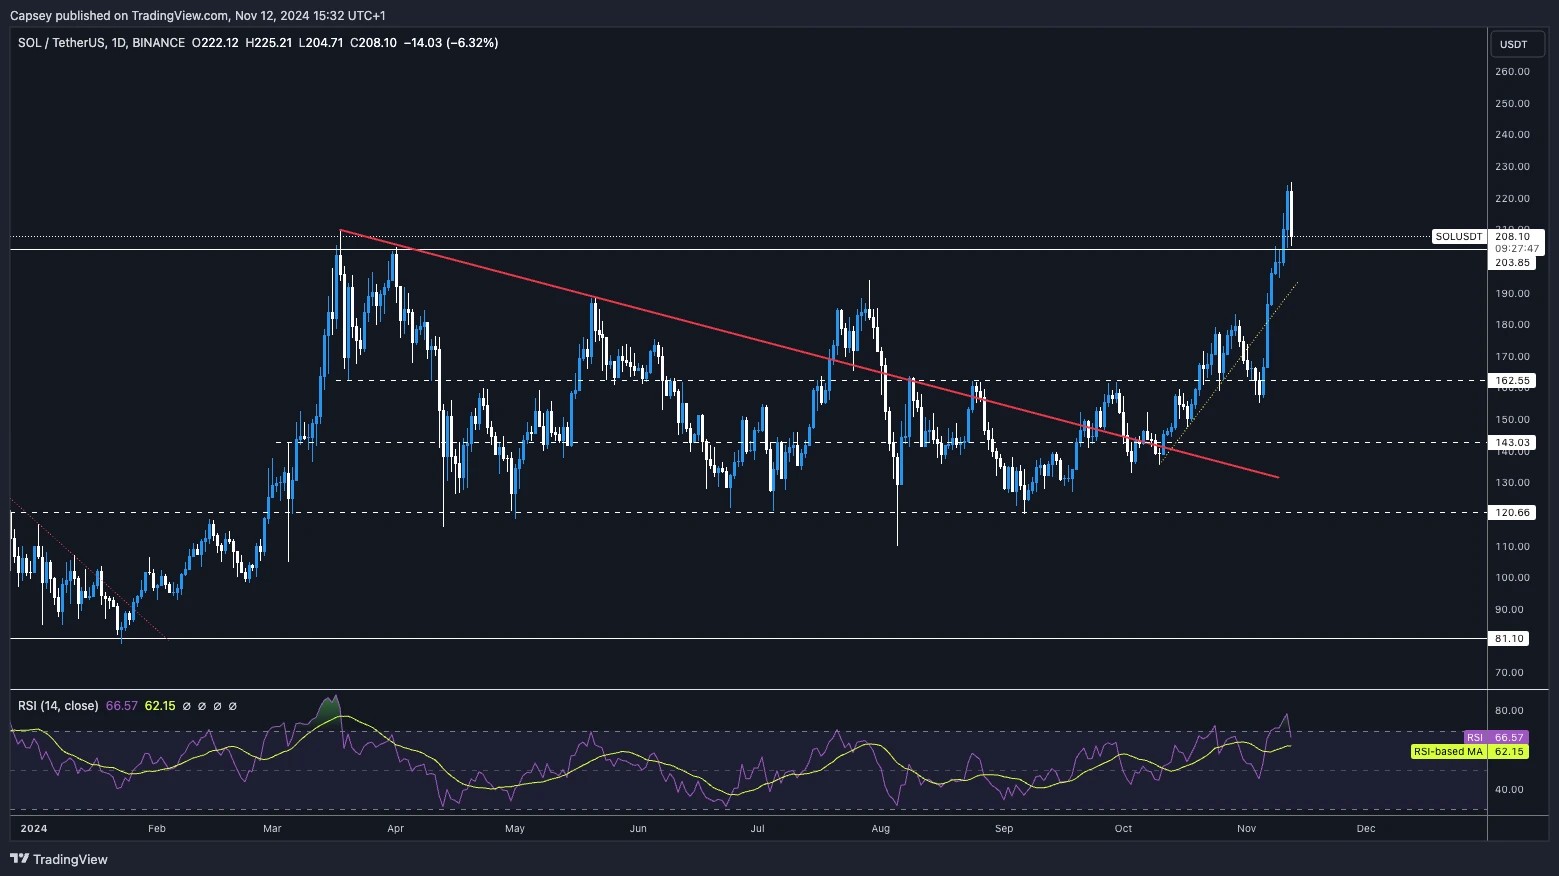
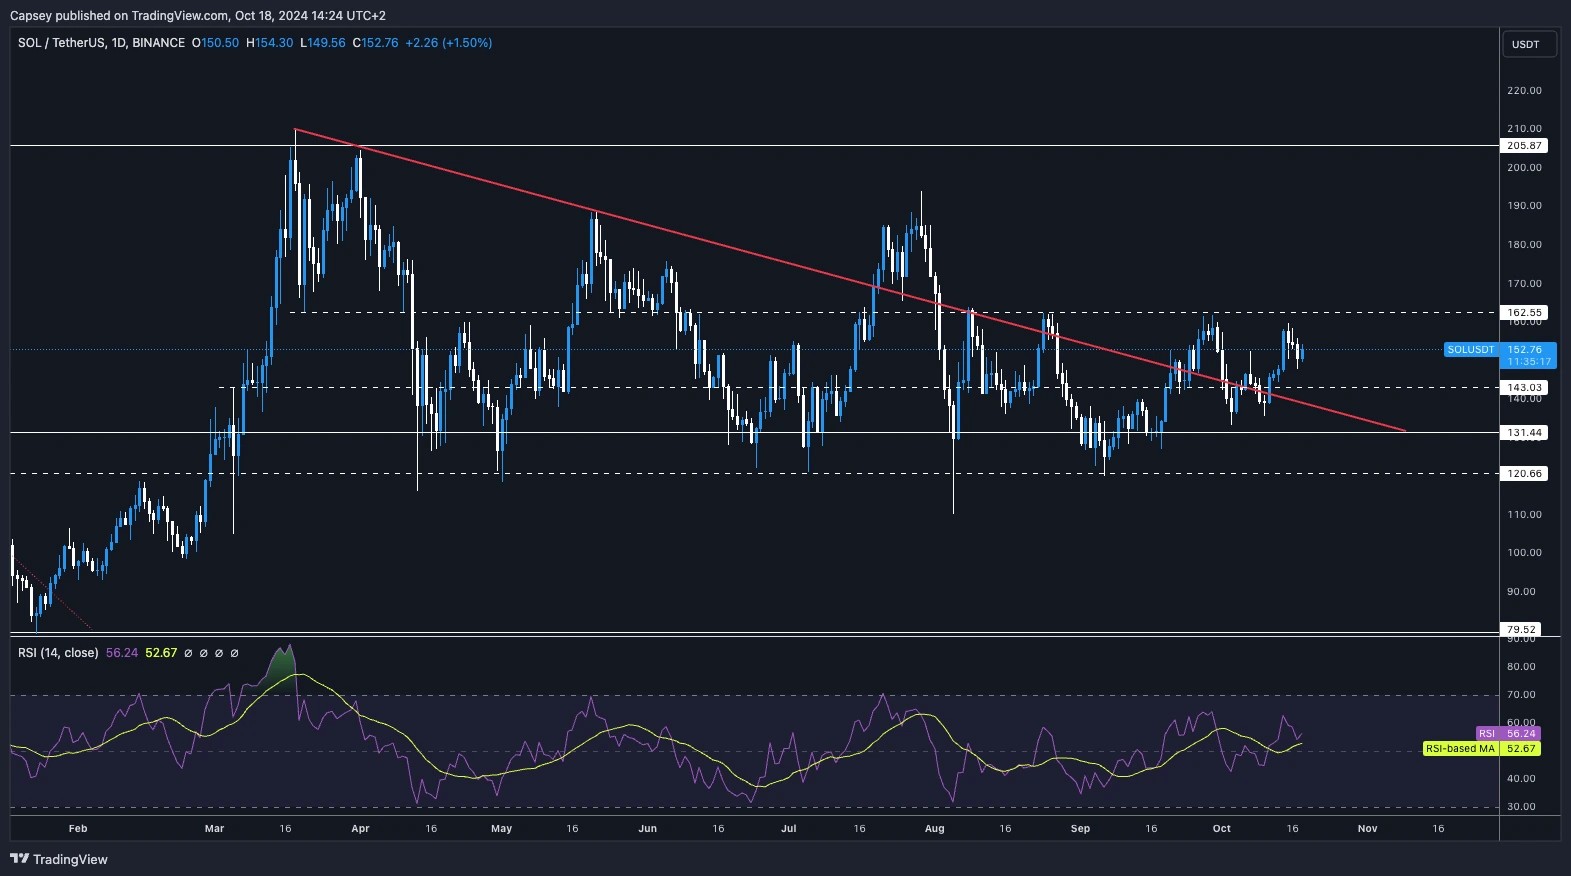
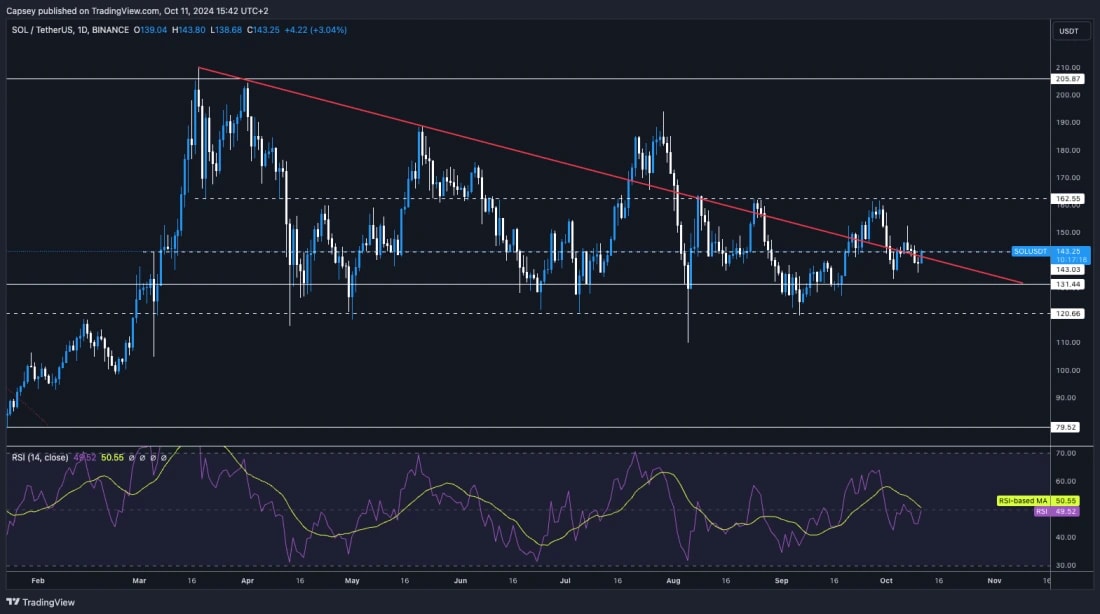
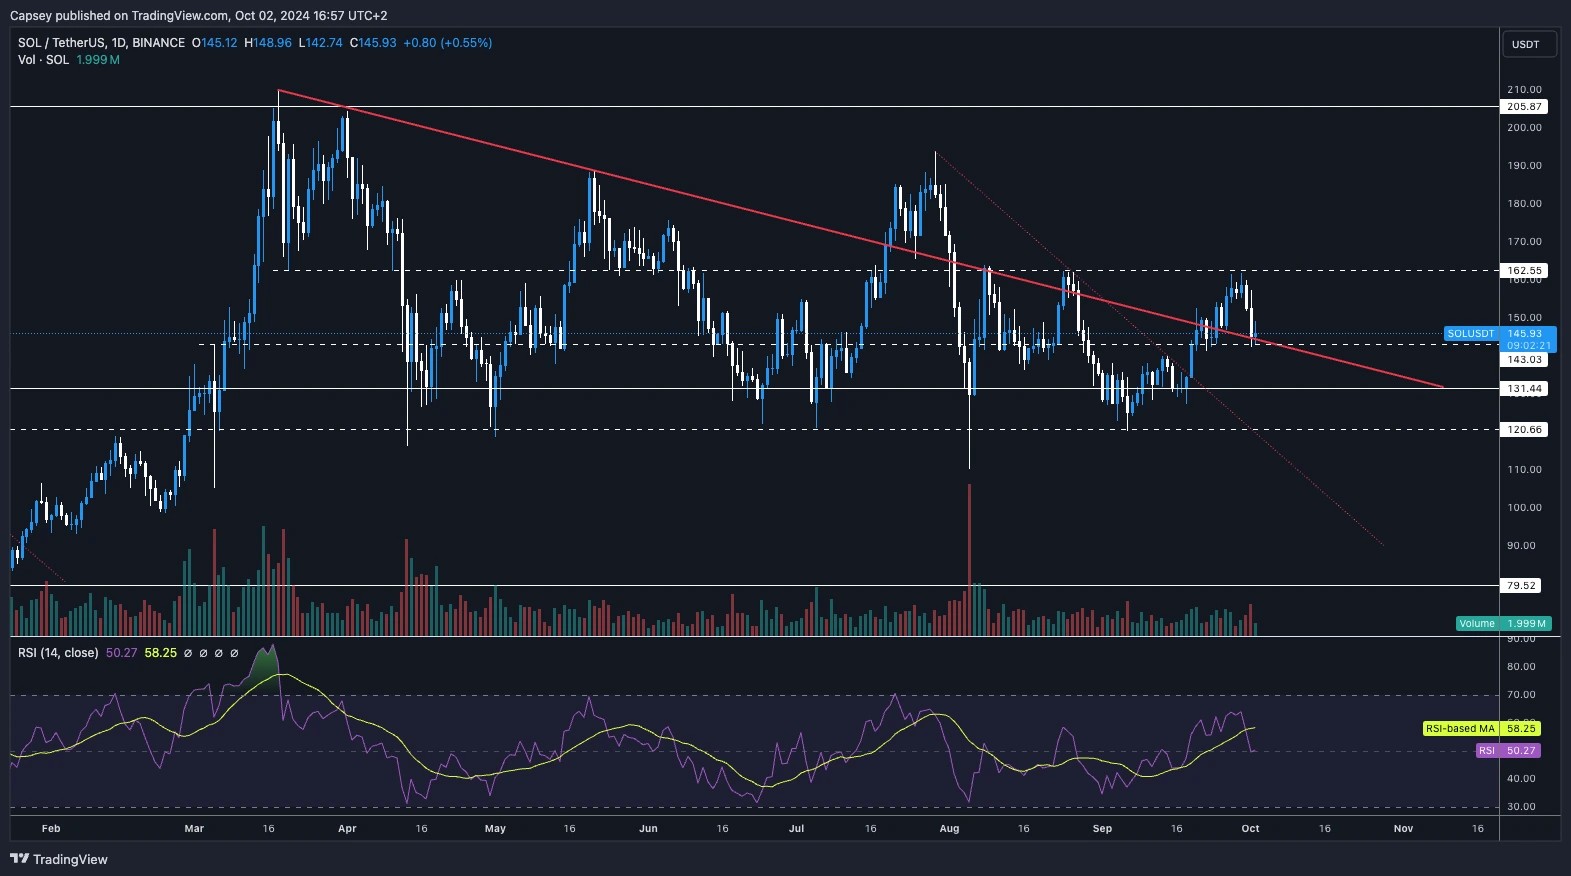
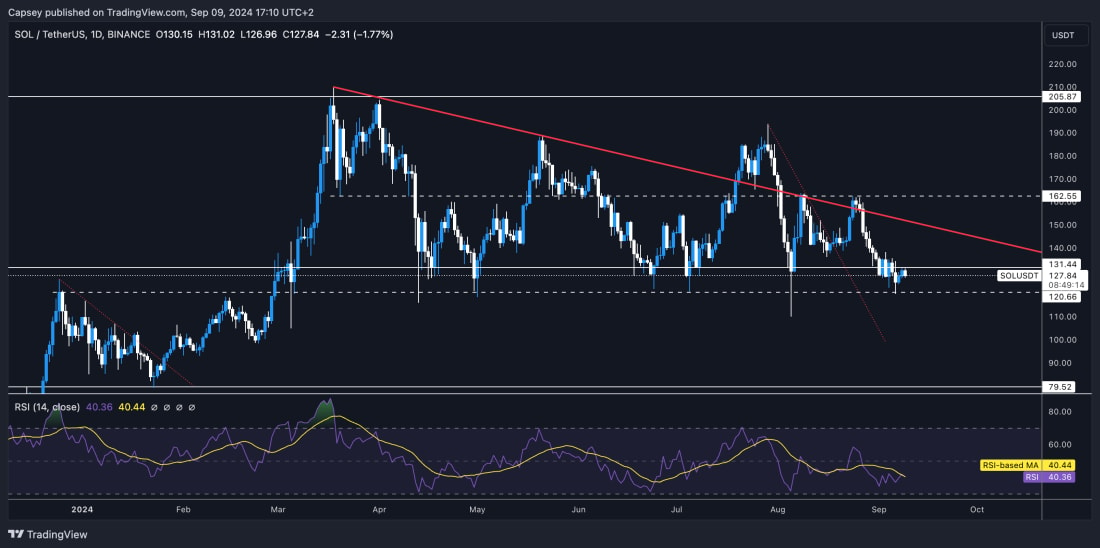
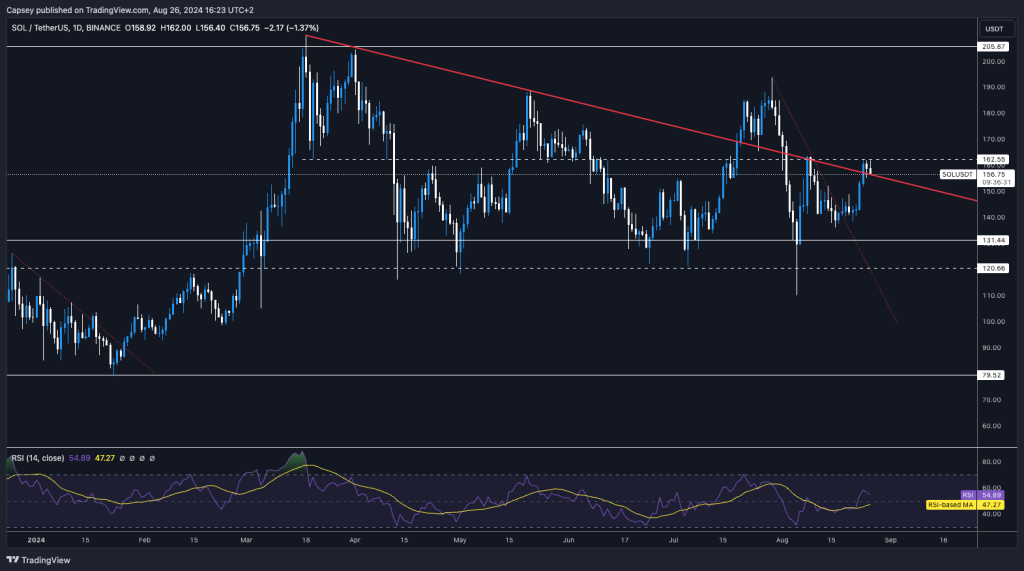
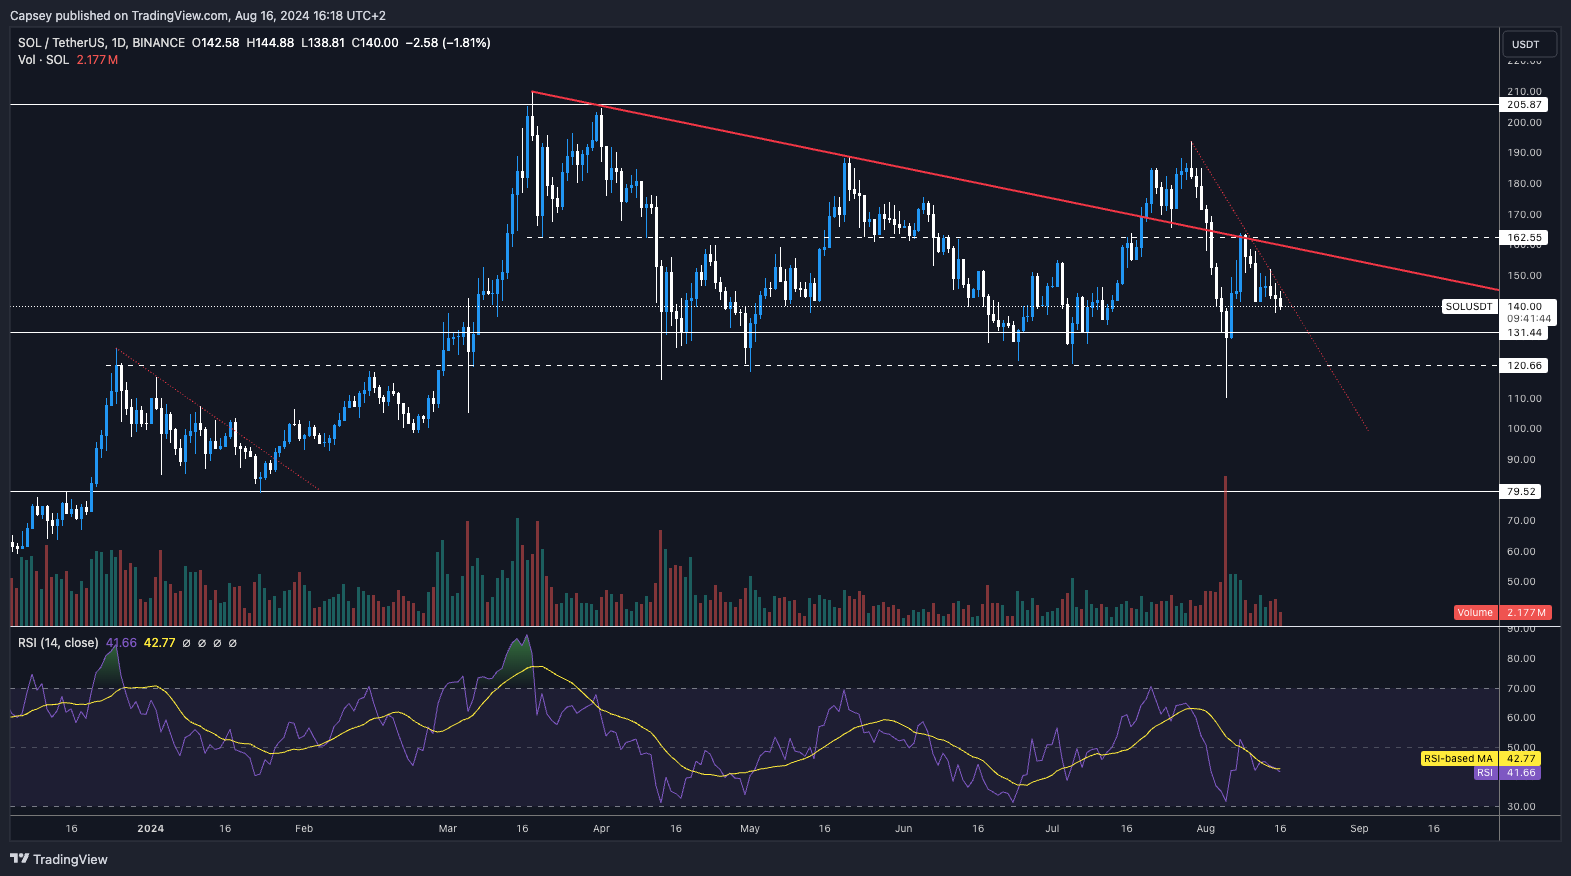
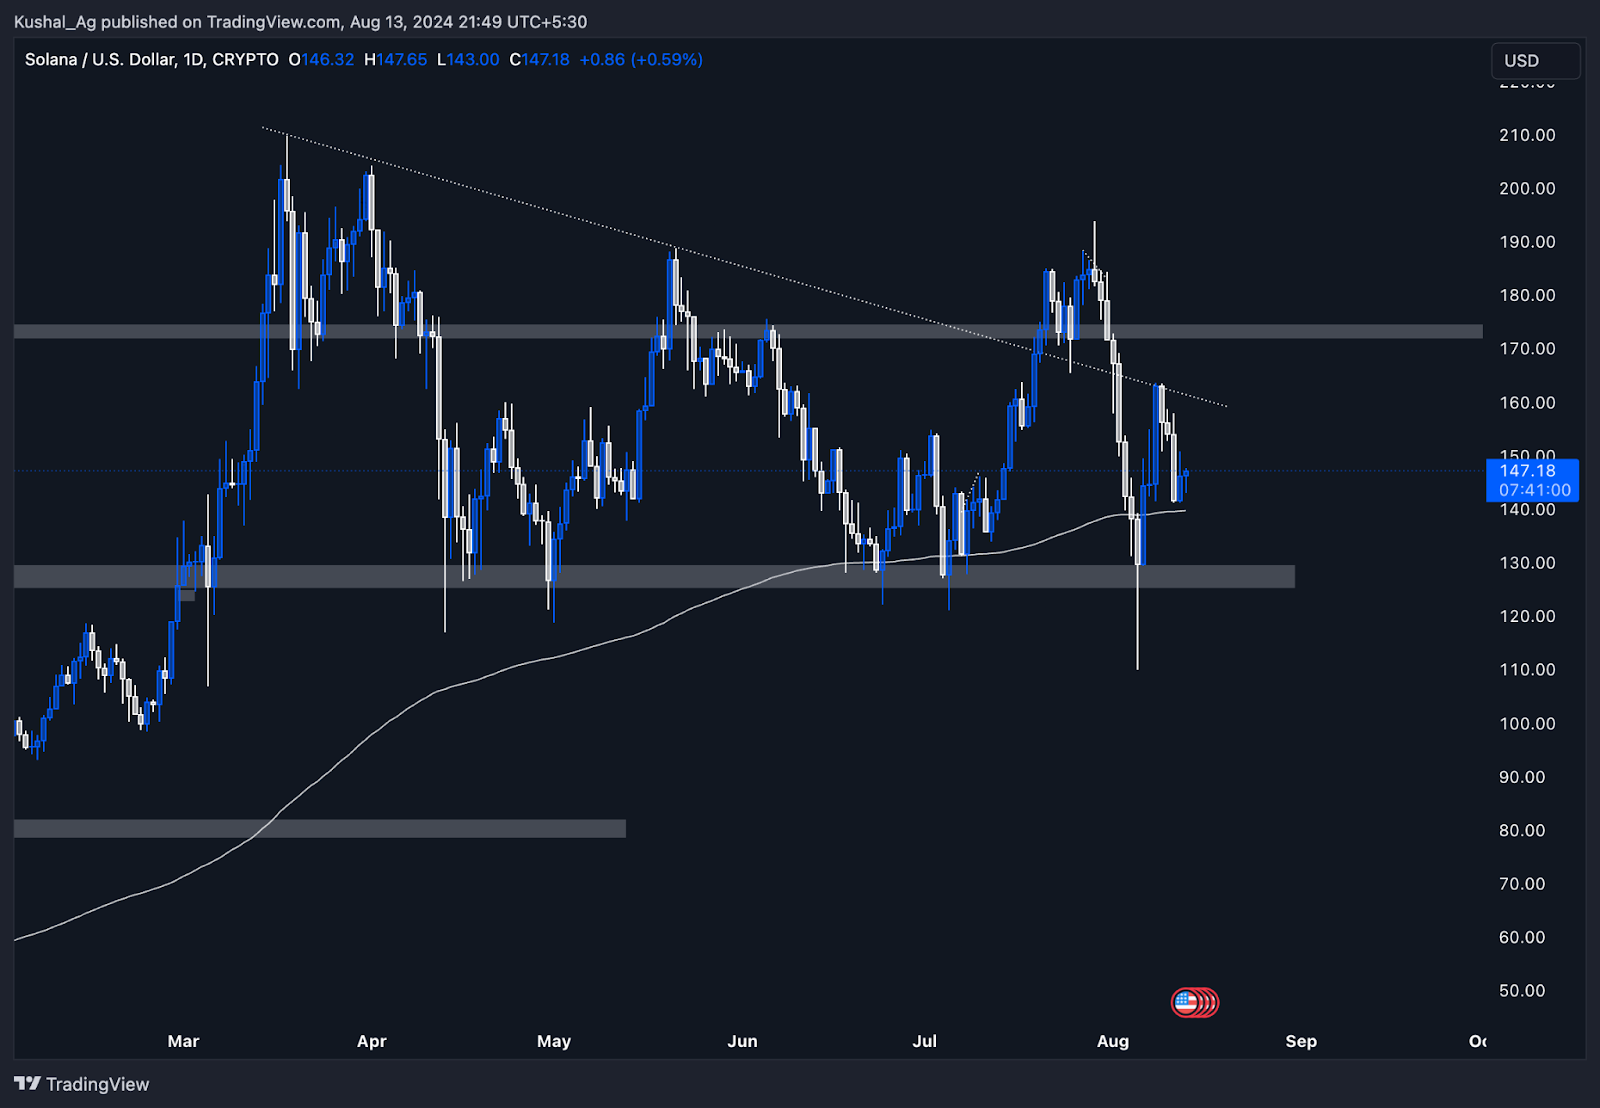
After price broke down from the main uptrend line and it couldn't find support at $162, price revisited $150.
SOL put in a small bounce at $150, which saw a bearish retest - a move up into the underside of the horizontal resistance of $162, which then rejected.
Price has then put in a small bounce from $144 which we're now using as the local support, but upside looks capped with $153 now being a local horizontal resistance.
The key level for price to reclaim to the upside is the horizontal line at $162. Above that bullish, below it, bearish.
To the downside, if price loses the $144 level, then $130 is likely next, although it might take some days/a week to move down to $130.
One positive takeaway is that the RSI has meaningfully reset now, and it is now close to oversold territory.
Next Support: $144
Next Resistance: $153
Direction: Neutral/Bearish
Upside Target: $162
Downside Target: $120
Cryptonary's take
SOL has pulled back from the $180 highs and price is now in a strong support area between $144 and $153. We'd expect price to chop around here for a few days, maybe even a week, although we do expect the next move to be a continuation lower, even if there is a small move higher first (to say $153), before breaking lower to $120 to $130.
For now, we're not looking to act. However, if price pulls back to the $120 to $130 area, and we expect it can do in the medium term, then we'll look to begin lightly allocating (buying SOL) for the long-term, so with a view to holding the position for 12 months.
SOL stalls after trendline breakdown
02 June 2025
Solana has broken key support at $162, with indecisive funding and neutral RSI. A move below $147 could trigger a sharper drop to $130—or even $120.
Disclaimer: This is not financial or investment advice. You are responsible for any capital-related decisions you make, and only you are accountable for the results.
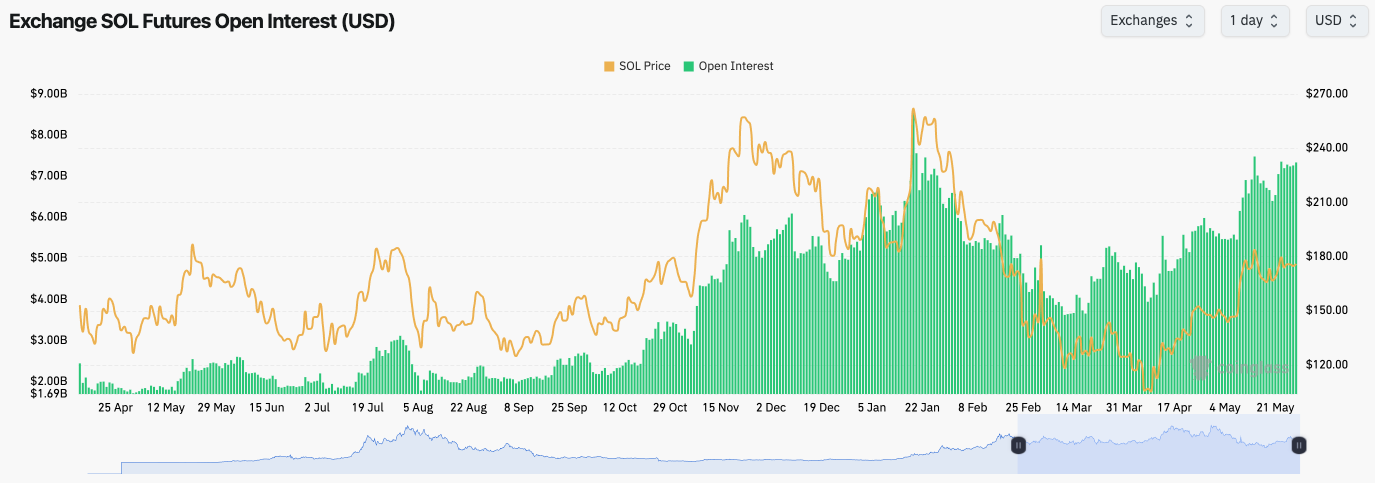
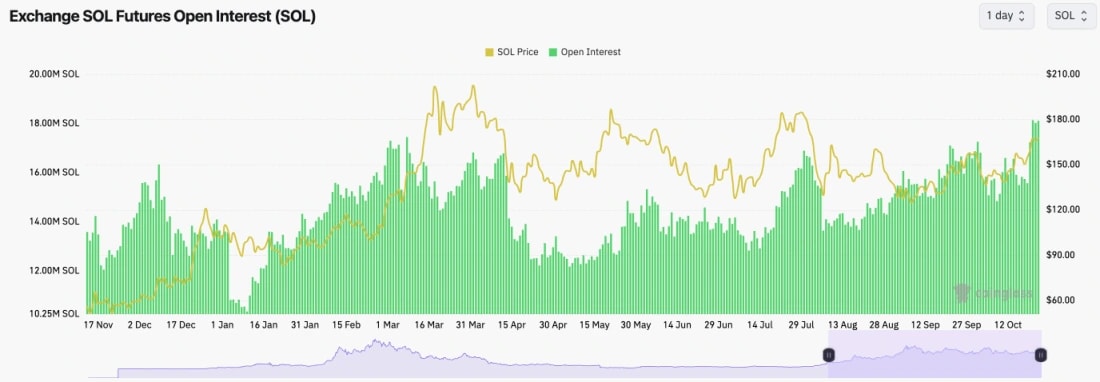
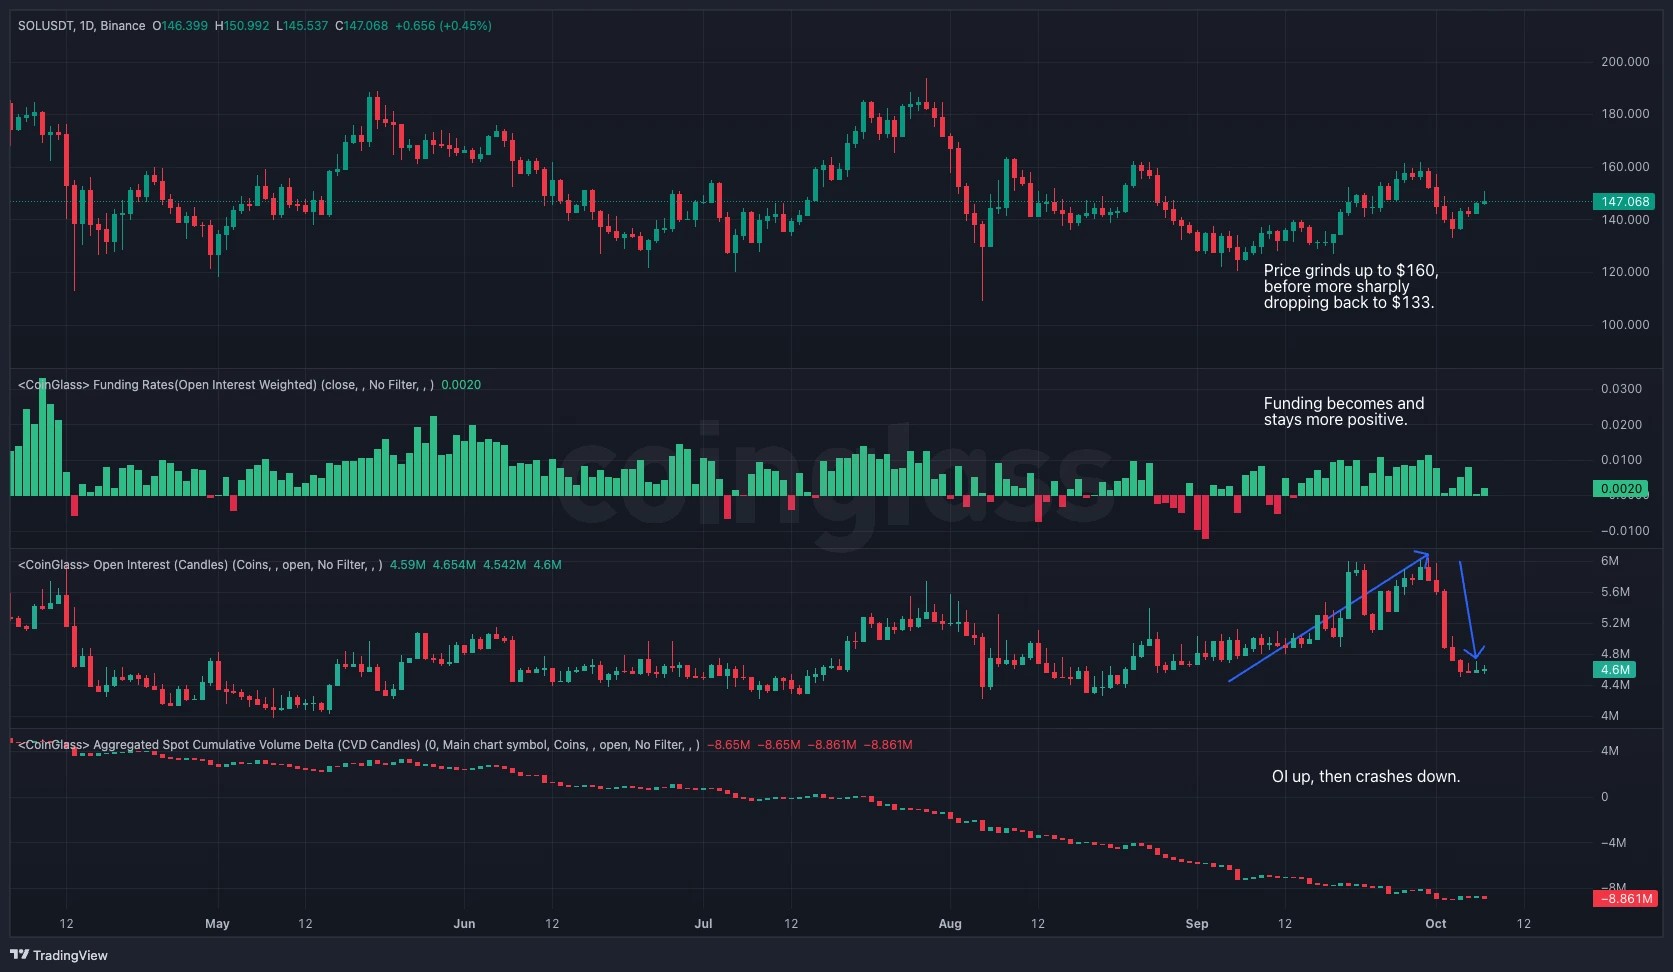
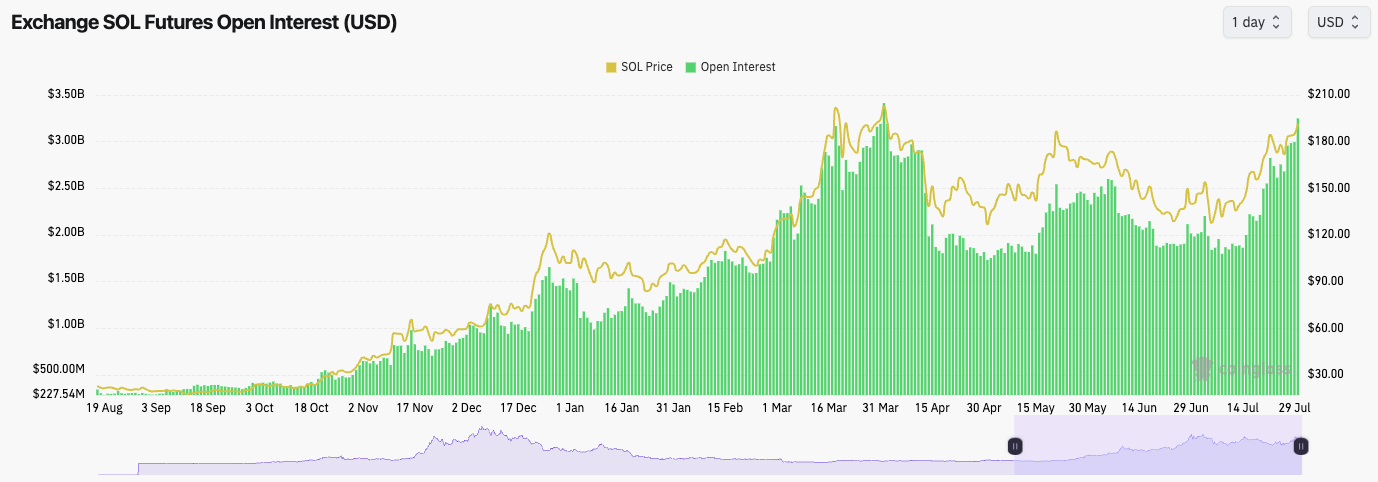
SOL's Open Interest has pulled back slightly over the last few days following the price pullback, with Funding Rates holding close to neutral, but whipsawing.
Ultimately, this shows indecision amongst traders.
SOL's Open Interest (by USD value):
Technical analysis
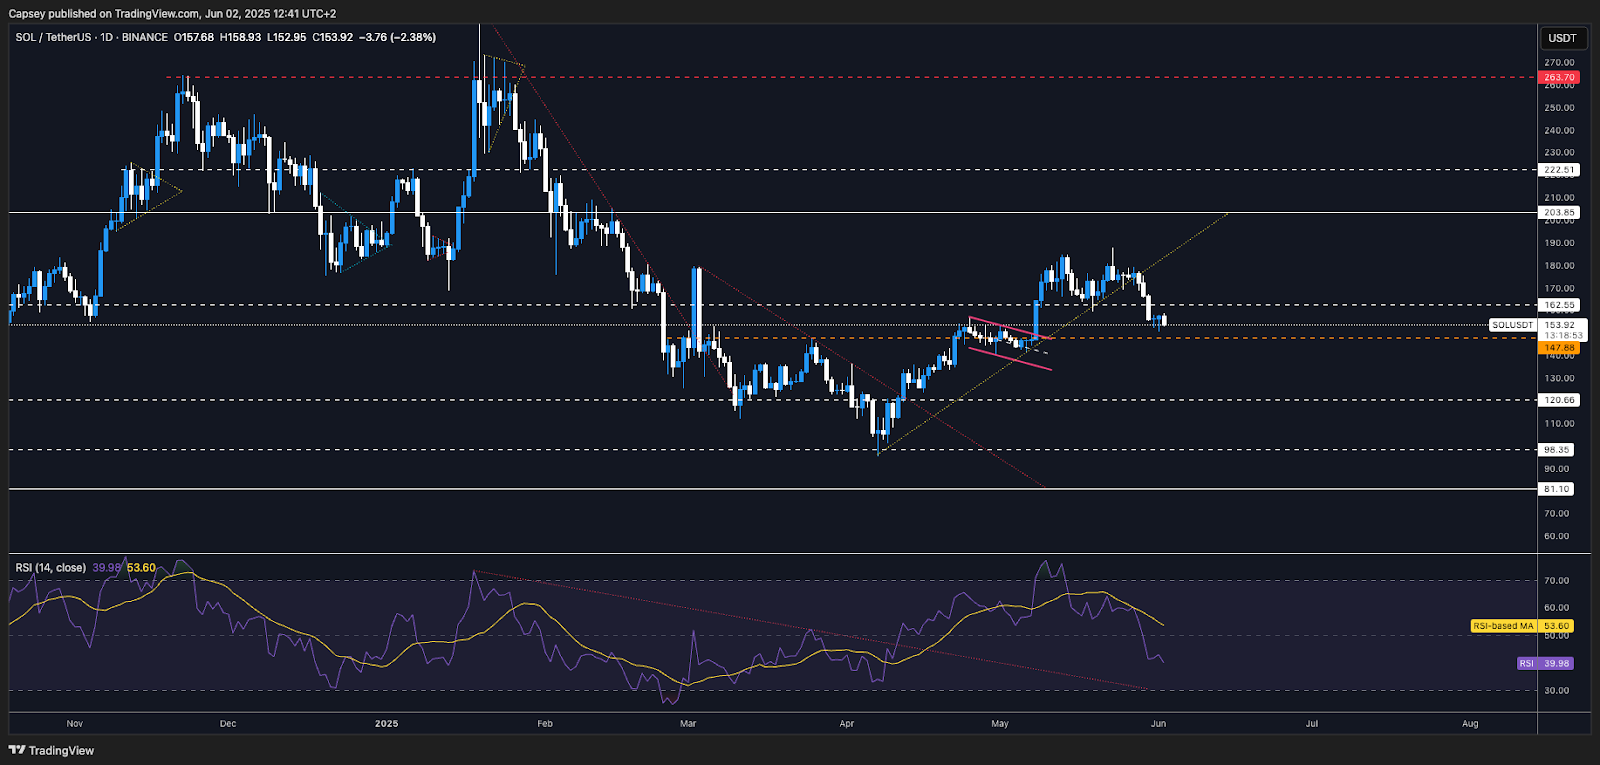
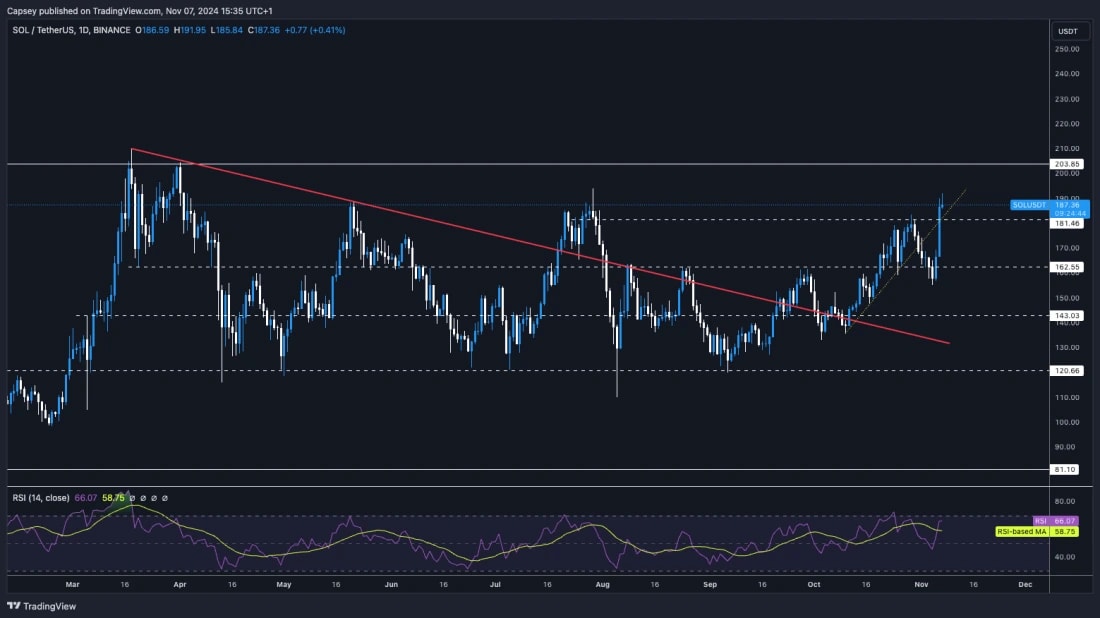
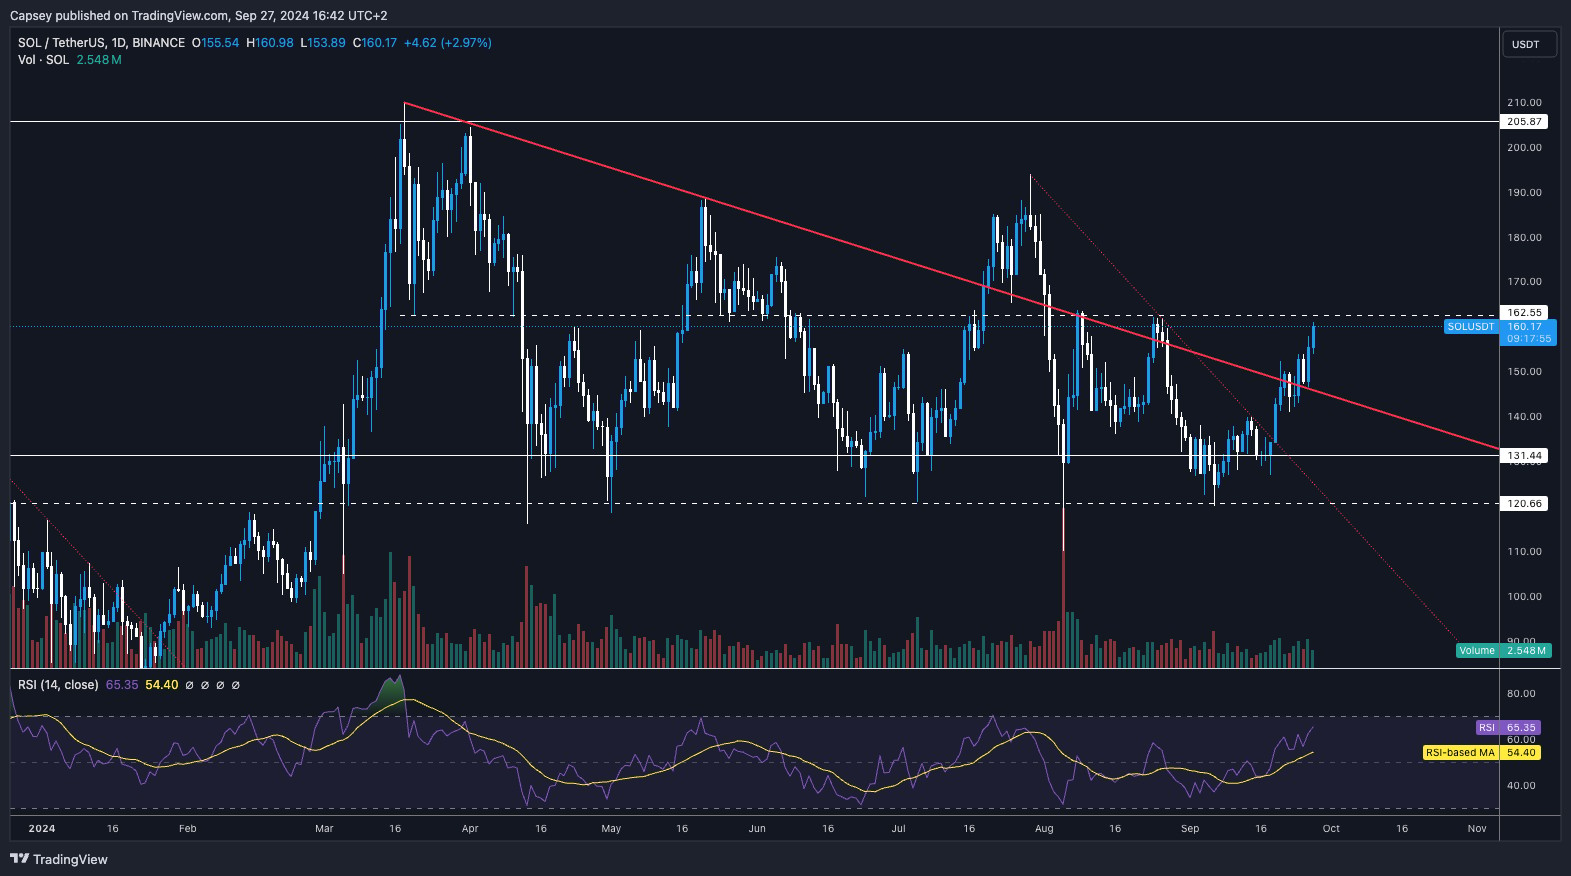
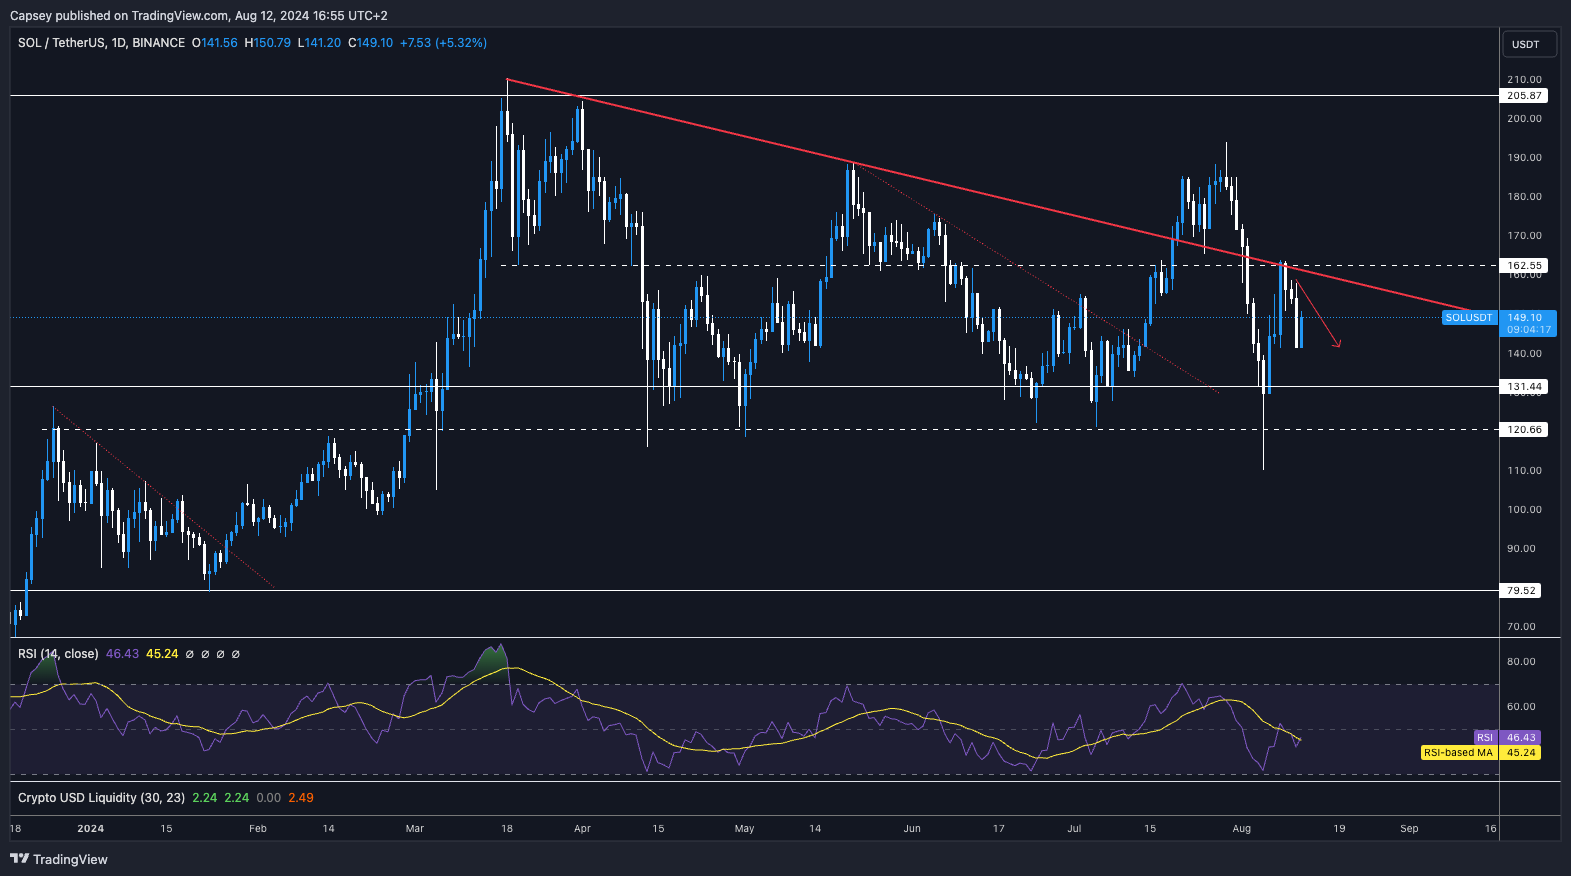
SOL broke below its horizontal support of $162 as we expected it would do, following the loss of its main uptrend line.
Price is now holding at the prior highs at the $150 level, whilst there is also a main horizontal support just below $150 and $147.
If price were to lose to the horizontal level at $147, then price would likely pull back to the $120 to $130 zone. If this were to happen, we would consider buying SOL for the long run in that range ($120 to $130).
It's possible in the immediate term that SOL bounces and retests $162 as a new horizontal resistance. We expect the price to reject there in the short term, and pull back further.
If price can break above $162, though (as we said, we don't expect it to), then $180 is the next horizontal resistance.
The RSI has meaningfully reset on this pullback, and it's now in middle territory, so not overbought or oversold.
Next Support: $147
Next Resistance: $162
Direction: Neutral/Bearish
Upside Target: $180
Downside Target: $130
Cryptonary's take
SOL has pulled back more substantially, as we expected it would, following the breakdown of the main uptrend line. SOL is now in a critical zone between $147 and $162, where the price will need to show strength if a general uptrend is to be continued. Our expectation is that the price may chop for a few days (potentially even retesting the underside of the horizontal resistance at $162) before breaking below the horizontal support of $147 and moving back down to $130.
In terms of our positioning, we'll remain sat in USD for now, although a retest of $120 to $130 would likely encourage us to begin lightly stepping back in (buying). But for now, we're patient and we see little reason needed to rush in here.
Solana faces tight range as bulls battle
27 May 2025
Solana remains range-bound with building long interest and a key technical setup forming. Price action near support may offer opportunity as bulls and bears test trendline control.
Disclaimer: This is not financial or investment advice. You are responsible for any capital-related decisions you make, and only you are accountable for the results.
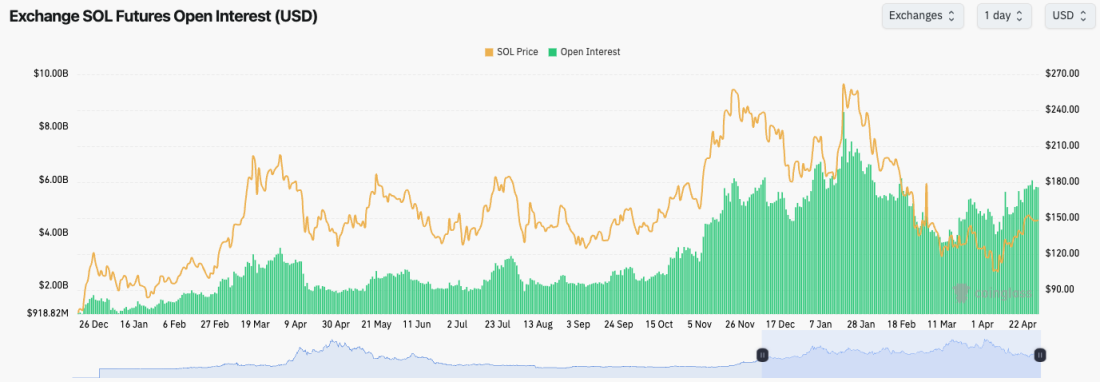
SOL's Open Interest has increased whilst Funding is now positive, suggesting that the increase in OI is Longs.
We were seeing periods of negative Funding for SOL, suggesting that there was demand to shorten it. A sizeable amount of those Shorts have been squeezed or closed out, though now.
SOL's open interest (by USD value):
Technical analysis
SOL has remained above its horizontal support of $162, but it's still finding resistance at the horizontal level of $184.
Since the early April lows, SOL has respected its uptrend line, although the price is now squeezing against its uptrend line.
To the upside, the horizontal resistances are at $184 and then $203.
On the downside, the horizontal supports are at $162 and $147.
SOL has consolidated above $162 for the last few weeks. This has allowed the RSI to reset from overbought territory. However, the RSI is now below its moving average.
Next Support: $162
Next Resistance: $184
Direction: Neutral
Upside Target: $203
Downside Target: $147
Cryptonary's take
SOL is at a crucial point here. It's contained in its key range between $162 and $184, whilst its battling against its major uptrend line. If the uptrend line is lost, then a revisit of $162 is likely. However, if SOL can hold above the uptrend line, then a breakout of $184 and a push to $203 is on the cards. We wouldn't be surprised to see a small flush lower to $162 before a move higher, a reclaim of the range, and then a breakout of $184. A retest of $162 would therefore be a constructive setup. This is still a bullish setup, just not as bullish as ETH's current setup.
Solana consolidates near resistance with rising leverage
23 May 2025
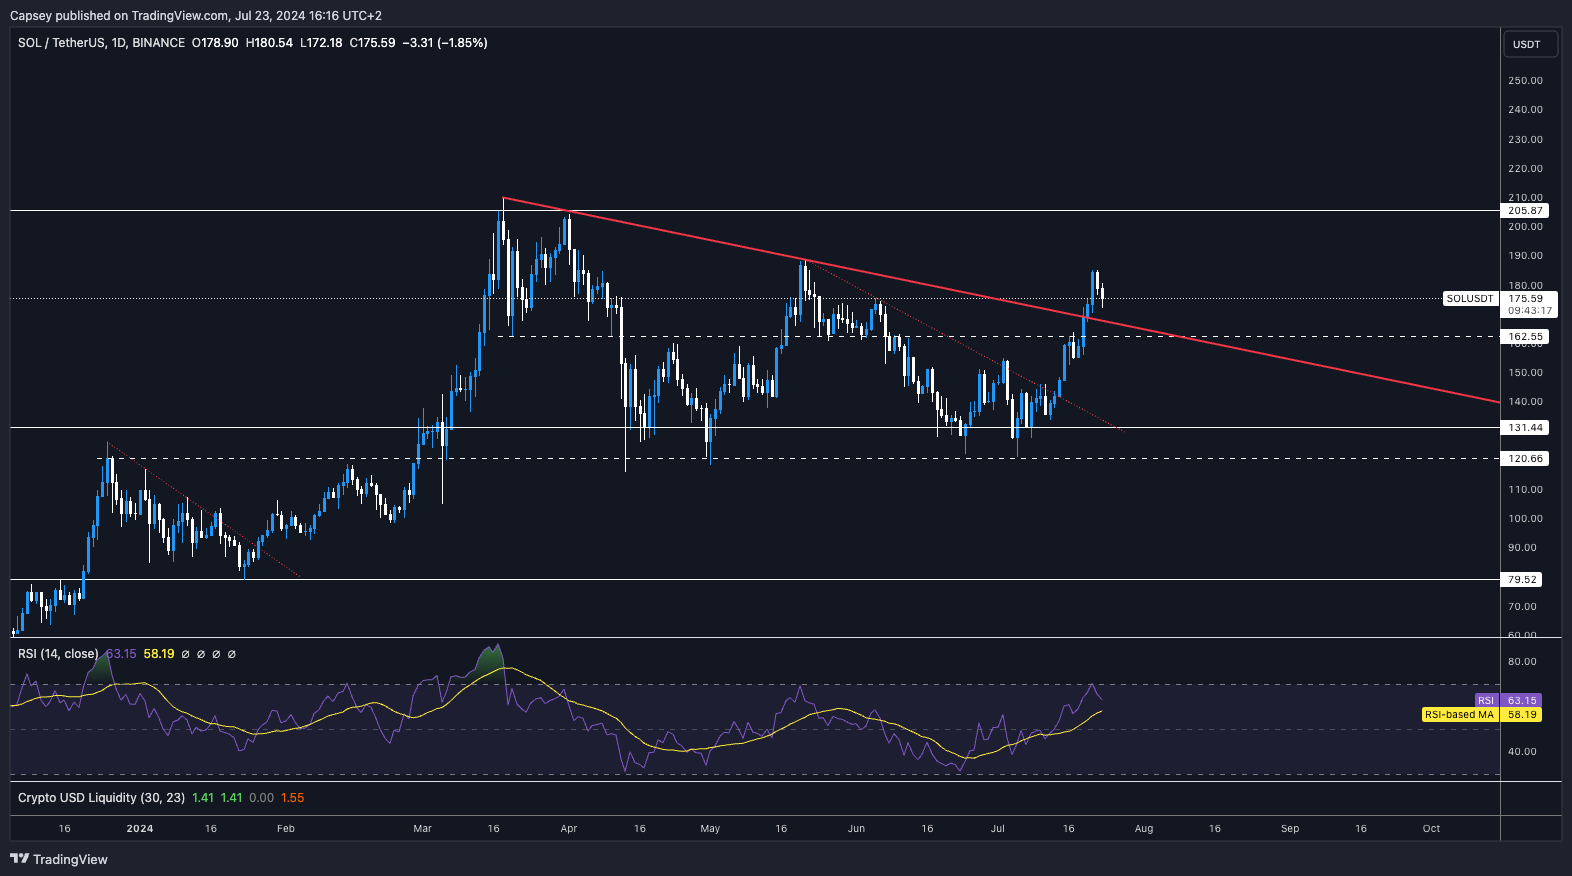
Solana is consolidating between $162 and $180, building energy for a potential breakout. With open interest surging and funding turning bullish, $200 is in sight—but $148 remains a possible dip target.
Disclaimer: This is not financial or investment advice. You are responsible for any capital-related decisions you make, and only you are accountable for the results.
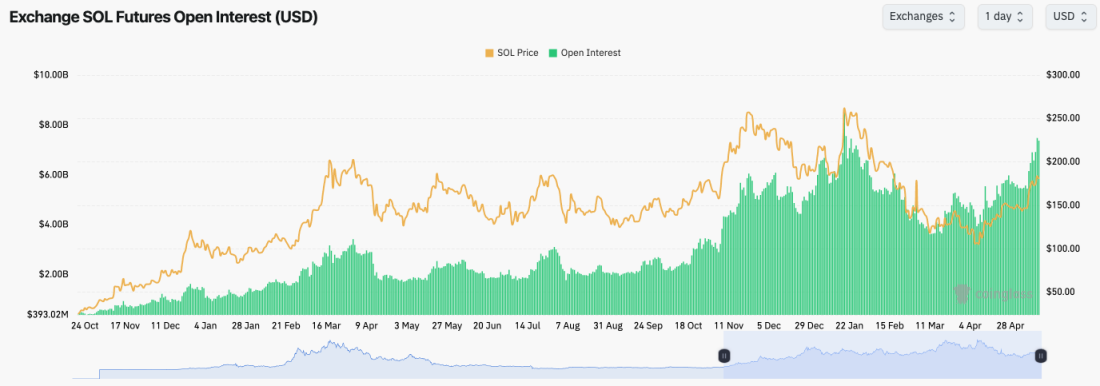
SOL's Open Interest has increased to new local highs as the Funding Rate returns to more positive territory.
This suggests that most of the leverage built up is now Longs.
SOL's open interest (by USD value):
Technical analysis
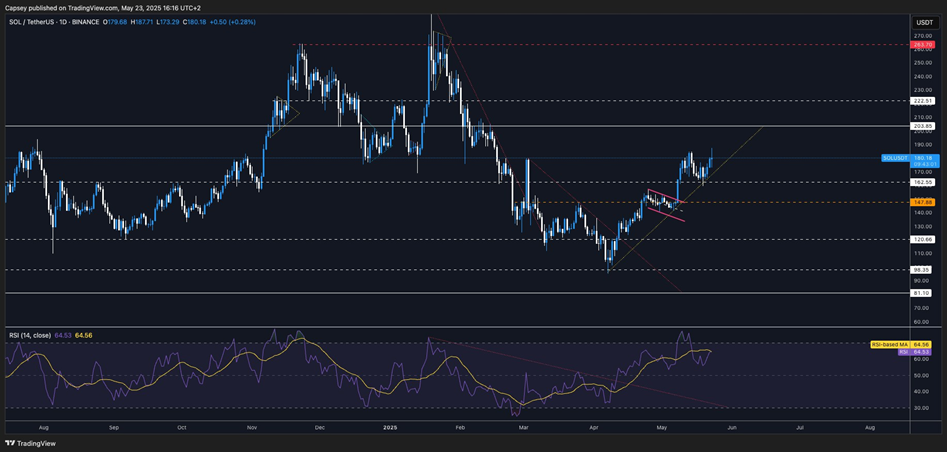
SOL has since consolidated between $162 and $180, following the breakout from its bull flag.
Price is currently supported by the main uptrend line and the horizontal support at
$162.
To the upside, the resistances are at $184 and $203 ($200 psychological level).
A breakout above $184 (that stabilises and closes above $184) would likely see the price retest $200. This would be a clean 10% move higher.
The RSI has pulled back from overbought territory, although it is below its moving average, which is currently acting as a resistance.
If price closes a new local high (higher than the May 14th high), the RSI will form a bearish divergence (higher high in price and a lower high on the oscillator). For now, this isn't a concern, although it's something we're closely watching.
Cryptonary's take
It looks doable for SOL to break out to $200 in the short term, however, we would expect that to be a key testing area where we would then expect price to pull back from. But, if price loses its uptrend line, we expect price to decline to $148, although this area would likely see dip buyers step in.
We would also look to take advantage of a pullback like that and buy SOL at $148 should it pull back to there. We expect it ca,n it just might take more time with further upside beforehand (in the short-term).
Next Support: $162
Next Resistance: $184
Direction: Bullish
Upside Target: $200
Downside Target: $148
SOL sits on support — but $120 looms
19 May 2025
The SOL Open Interest is up substantially, and it's currently now short-dominated. We can see this in the fact that the Funding Rate is meaningfully negative (at -0.018%), i.e., Shorts are paying a premium to Longs to be Short.
This opens the door for a small Short-squeeze in the medium term, that might take the price up to $170, but we would then expect the price to roll over from there.
SOL's open interest (by USD value):
Technical analysis
SOL was rejected from the $180 level, and the price has since pulled back into the horizontal support of $162.
Price is also currently sitting on top of the main uptrend line. If this uptrend is lost, we can expect the eventual landing zone to be $148, and potentially $120 to $130.
$180 is the key level to the upside.
To the downside, the key level is $148, and then you have the $120 to $130 zone.
The RSI has meaningfully reset on this pullback, and it's now also putting in a hidden bullish divergence (higher low in price, lower low on the oscillator).
Next Support: $148
Next Resistance: $180
Direction: Bearish
Upside Target: $180
Downside Target: $120
Cryptonary's take
SOL does have some bullish elements here, but it is also battling bearish elements like many of the other charts. SOL is at a key level here, sitting on top of its uptrend line, and the horizontal support of $162.
If price can get a small bounce in the short term, this still wouldn't change our view that we do expect to see a more significant SOL pullback to at least the $120 to $130 levels over the coming 3-5 weeks. In that area, we'll likely begin becoming constructive again and looking to add to our long-term Spot bags in that $120 to $130 area. In the meantime, once again, patience.
$190 Possible Before SOL Corrects
14 May 2025
Like BTC and ETH, SOL's Open Interest has rallied substantially, whilst the Funding Rate has returned to the positive level of 0.01%. This suggests that the build-up in OI is mostly Longs, but not to a point where it's excessive and vulnerable to a squeeze.
SOL's open interest (by USD value):
Technical analysis
SOL formed a bull flag that then coincided with a push into the horizontal resistance of $147. Price was able to break out, and it shot up to $180.
Price has now moved into a resistance zone. We would expect SOL to top out at least locally in the coming days/week between $180 and $200.
To the downside, the key supports are at $162, $147, and then the major level is at $120. Yes, it is still possible that this area can be retested.
SOL's RSI is well into overbought territory, with its moving average at its highest level in the past 6 months, whilst a bearish divergence has also just formed (higher high in price, lower high on the oscillator).
Next Support: $162
Next Resistance: $200
Direction: Neutral/Bearish
Upside Target: $200
Downside Target: $147
Cryptonary's take
It's possible that SOL has one more move higher in the immediate term to say $190, but further upside seems limited here. Our expectation is that in the short term, price pulls back, likely to the $147 to $162 zone. At this point, we'll likely look to begin building a position whilst also looking for other opportunities in the SOL ecosystem as well.
Price has moved up substantially in a short amount of time, so it would be very reasonable for the price to consolidate for a period of time. Even if price retested $120 to $130, this wouldn't be bad, and it would just be a retest of the base. If the price were to revisit $120 to $130, we'd look to aggressively add SOL for the long term.
SOL breaks trendline, eyes next support
05 May 2025
SOL faces a potential breakdown as price slips below key support, and conviction remains low. Traders eye a short-term bounce before a likely move to $135 or $120.
Disclaimer: This is not financial or investment advice. You are responsible for any capital-related decisions you make, and only you are accountable for the results.
SOL's Funding has fluctuated a lot recently. This suggests huge indecision and low conviction amongst traders as to the next direction.
SOL's Open Interest remains very high, suggesting that there is still appetite amongst traders to take on leverage.
SOL's funding rate:
Technical analysis
SOL is at a really interesting level here, battling at the horizontal level of $148, with price currently falling below, but battling at the key horizontal level.
To the upside, the major horizontal level is the $162 level.
To the downside, the local support is at $135, and the major support is at $120.
Price has broken below its local uptrend line, and since then, it has struggled for upside. We do expect a move into $136 to eventually be a landing spot for SOL, although we are watching the potential bull flag pattern, which we see a breakout to $150-$160 first. But again, we wouldn't be looking to bet on upside here.
The RSI is back in middle territory and well below its moving average. This suggests a move higher is possible to retest the underside of that moving average.
Next Support: $135
Next Resistance: $162
Direction: Neutral/Bearish
Upside Target: $162
Downside Target: $120
Cryptonary's take
There's the potential for a small move higher in the short term for SOL, but we expect it to pull back to $135 either first or after retesting $150. Beyond that, we do expect a further breakdown to $120, even if that takes more weeks.
For now, we remain out of the market, and we still hold the strong view that this is a relief rally, and that we'll get our entry prices over the coming 1-2 months. For now, we're still patient. If price gets to $150-$162, we may consider fresh Shorts for SOL, but we probably prefer BTC for a Short should it move into $98-99k.
SOL battles key resistance amid risk appetite
29 April 2025
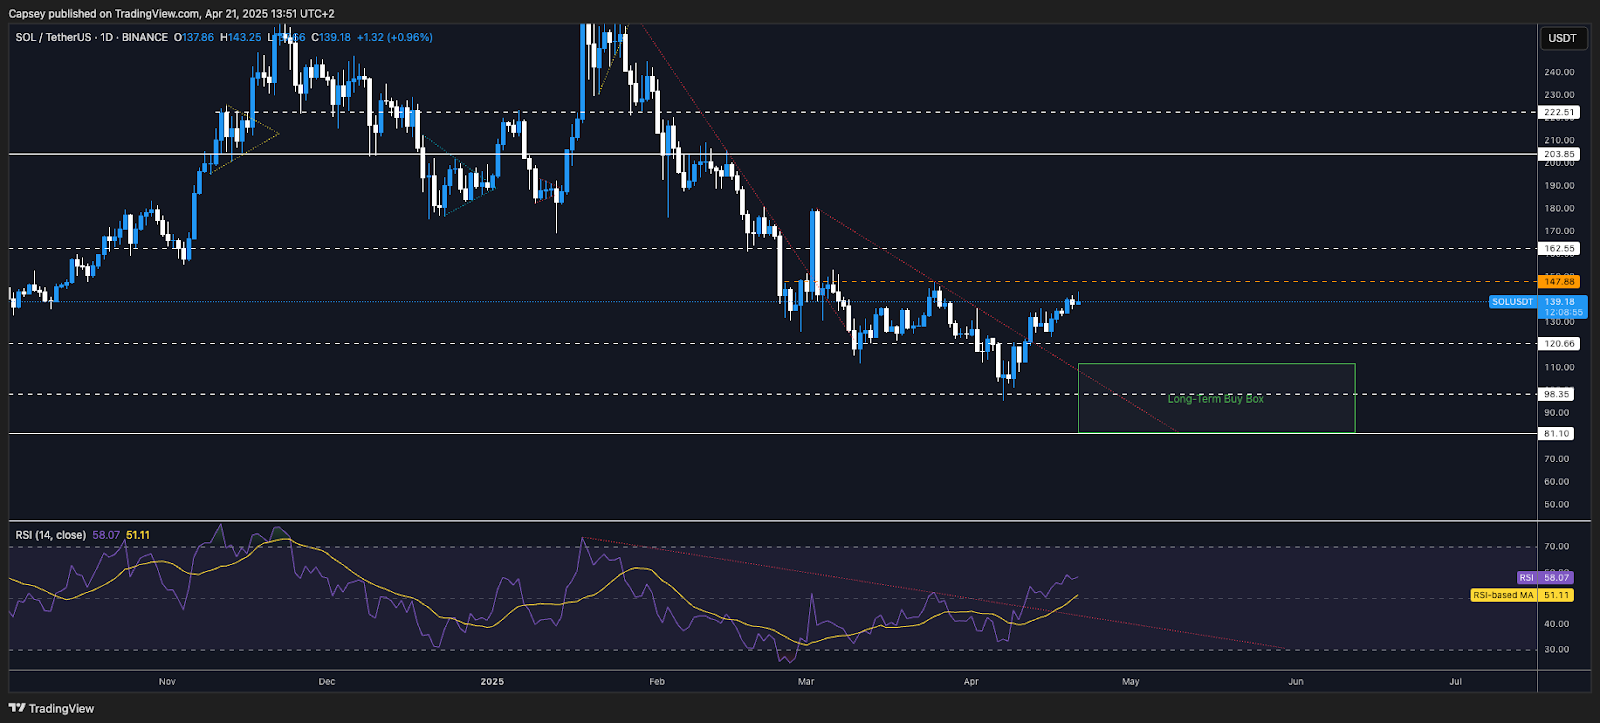
SOL's price is testing $148 support, with $162 as a key resistance. Upside is limited, and a potential pullback to $120 is expected over the next few weeks. Watch for a short squeeze.
SOL's Open Interest has kicked up quite substantially, suggesting that traders still have an appetite to take risks.
The Funding Rate is flat, however, suggesting that Longs are matching Shorts. A move to $155 could potentially lead to a short squeeze.
SOL's open interest (by USD value):
Technical analysis
Price broke above the prior high (March high), which was positive to see, and price is now battling at a key horizontal level of $148.
To the upside, the key resistances are at $162 and $180.
To the downside, $134 is a local support, with $120 a more significant support below that.
Interestingly, price was in a local uptrend, and it has recently lost that local uptrend line, as we can see.
The RSI isn't overbought, but it's not really in middle territory either. It is, however, currently sitting on top of and supported by its moving average. It'll be important to see if this metric holds as support.
Next Support: $148
Next Resistance: $162
Direction: Neutral/Bearish
Upside Target: $162
Downside Target: $134
Cryptonary's take
Its possible SOL can move up to $162, but we expect that might be all that's left in this move, and we're expecting a local top to either be in or be put in this week close to $162.
So, we think the next week can still give some upside, but limited upside; however, beyond that, we're not confident, and we expect $120 to be revisited again over the coming 4-6 weeks. Beyond that, and the $100 level, we do still expect that level to be in play, for June time.
SOL has recently broken out of its local downtrend, but with rising short interest and resistance ahead, the next move could be critical. Let’s dive into what’s driving SOL’s price action.
Disclaimer: This is not financial or investment advice. You are responsible for any capital-related decisions you make, and only you are accountable for the results.
SOL's Open Interest has increased as price has gone higher, whilst SOL's Funding Rate has turned very negative. This indicates that as the price has moved higher, traders have begun shorting SOL with some size. This level of negative Funding could be slightly vulnerable to a Short squeeze, though. That would be the only point to be wary of from jumping into Short's perspective.
SOL's funding rate:
Technical analysis
SOL was able to break out of the local downtrend line and reclaim the horizontal level of $120. This has what has helped SOL to break out close to the $148 level.
$148 is a key horizontal resistance, which may be a stopping zone for the price in the short term.
If price can get above $148, we'd expect the next level to be the local top ($162), however, we're not confident that price will even reclaim $148.
To the downside, the main support once again becomes $120, with $98 being the next major level below that.
The RSI has broken out of its downtrend, but it has put in a hidden bearish divergence, which is a lower high in price and a higher high on the oscillator. This can suggest exhaustion to the upside.
Next Support: $120
Next Resistance: $148
Direction: Bearish
Upside Target: $148
Downside Target: $120
Cryptonary's take
We expect in the short term that SOL is close to a local top, with this likely being around the $140 to $148 level. However, if not, then we do expect $162 as a maximum level for a local top, but we're not confident the price gets as high as that.
We are expecting more downside in the medium term, and therefore, we do expect a revisit of the $120 horizontal support. We'll be closely assessing price behaviour at that level, assuming we're right in calling for it.
We're expecting downside in the medium term, and we'll look to accumulate SOL for the long run in the Green Buy Box (between $81 and $112).
SOL breakout holds, but bearish signals build
14 April 2025
Solana has broken key resistance and flipped funding positive, but momentum is slowing. A hidden bearish divergence signals caution as the next move could go either way.
Disclaimer: This is not financial or investment advice. You are responsible for any capital-related decisions you make, and only you are accountable for the results.
SOL's Open Interest (by number of coins) has spiked higher again, suggesting leverage traders are chasing this move higher.
This is also reflected in the Funding Rate moving from negative to positive (Longs chasing in), although Funding has cooled off again in the last 12 hours.
SOL's open interest (by number of coins):
Technical analysis
SOL has broken out of its local downtrend, and price has also comfortably closed above the key $120 horizontal resistance.
Price is currently at a very local horizontal resistance here at $134. However, the main horizontal resistance is higher up at $148.
The RSI has also broken out of its downtrend line with the RSI also above it's moving average. But, a hidden bearish divergence is now forming (a lower high in price and a higher high on the oscillator).
To the downside, $120 is the horizontal support, with $98 the major horizontal support still.
Next Support: $120
Next Resistance: $148
Direction: Neutral
Upside Target: $148
Downside Target: $120
Cryptonary's take
Price has broken out, and SOL may have completed most of this leg higher, but a push to $148 is still possible. There are some positives for SOL that suggest this move higher can continue, but there also some suggestions that a good portion of the move may have happened already, although we wouldn't be surprised to also see price continue on to $148. This is tricky to call here.
We're still of the view that we're in the midst of a relief rally and that price can test lower again over the coming weeks and months, and therefore we'll be looking to accumulate longer-term Spot bags of SOL between $81 and $112. Patience until then.
SOL bulls hope for breakout above $120
11 April 2025
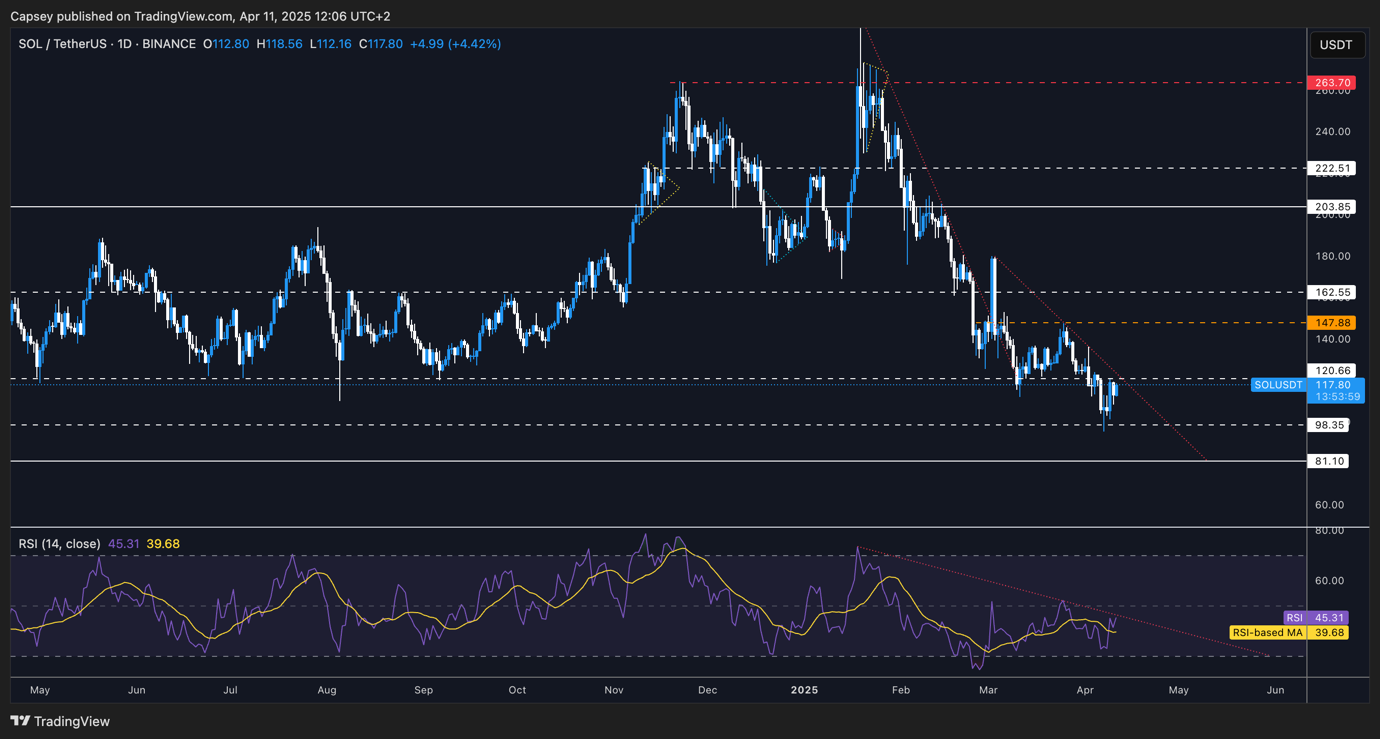
SOL tests key resistance at $120, showing bullish divergence. With support levels at $98 and $81, traders are looking for a potential breakout and upside movement toward $140 and $147.
Disclaimer: This is not financial or investment advice. You are responsible for any capital-related decisions you make, and only you are accountable for the results.
SOL's Open Interest (by number of coins) remains very high.
The Funding Rate is positive, meaning there is a slight bias amongst traders to be Long. We would also rather be Long SOL rather than Short here.
SOL's funding rate:
Technical analysis
SOL broke down from the $120 horizontal support and swiftly moved down to the next horizontal support at $98.
At $98, SOL put in back-to-back bullish divergences (lower lows in price, and higher lows on the oscillator). This could help fuel a move higher.
The RSI is in a downtrend, but it's above its moving average, and also now with those back-to-back bullish divergences.
Price is currently butting up into the underside of the horizontal resistance at $120, which also converges with the local downtrend line. If SOL can flip this level, then $140 to $147 is possible.
To the downside, the horizontal supports are at $98 and $81. We'd be accumulating in that range should the price revisit there over the coming weeks.
Next Support: $98
Next Resistance: $120
Direction: Neutral/Bullish
Upside Target: $140
Downside Target: $98
Cryptonary's take
In the short term, SOL could breakout to the upside here if it flips the $120 horizontal support and the downtrend line, although this is a tricky level to flip. We'll be watching the reaction at this price point very closely.
In terms of long-term accumulation, we're eyeing $81 to $110. We'll look to accumulate in this range should price retest this range, and we'll build positions over the coming weeks/months.
SOL faces critical support at $100 level
07 April 2025
As market uncertainty persists, SOL has fallen below crucial support levels. Let's explore the latest price action for SOL and other major assets to determine the next moves in these volatile times.
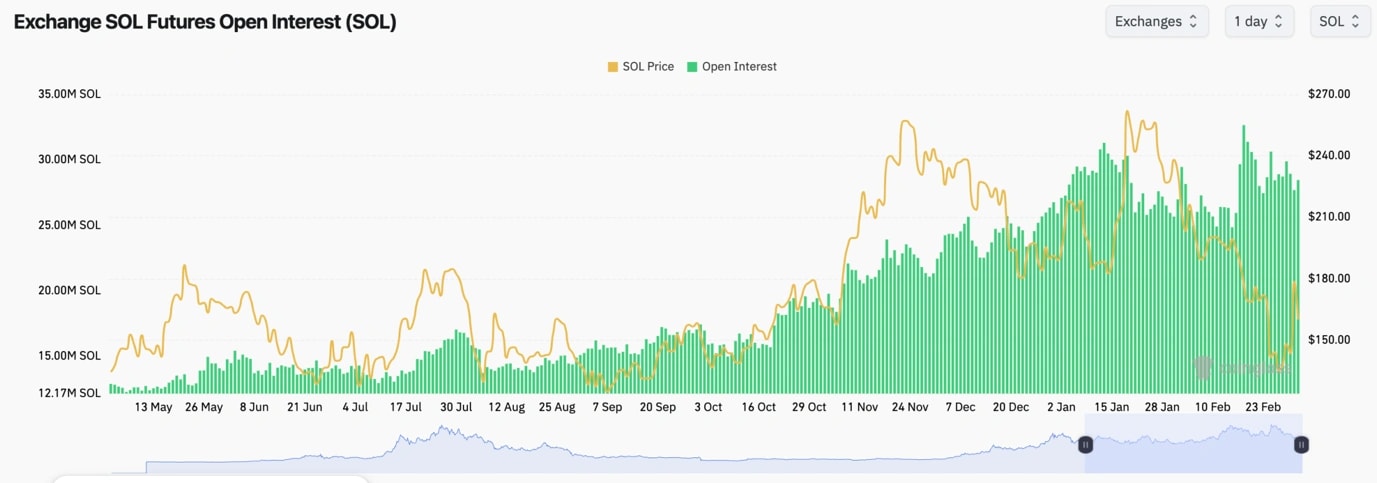
Like ETH, SOL's Open Interest (by number of coins) is up, due to the price of SOL falling and it becoming cheaper to leverage 1 SOL. However, the USD value of OI is down substantially.
Funding is fluctuating between slightly positive and slightly negative, but it's more on the side of slightly negative. This suggests more appetite amongst traders to Short.
Ultimately, there is less appetite to leverage a bet on SOL here, but what appetite there is there is slightly weighted toward Shorts.
SOL's open interest (by number of coins):
Technical analysis
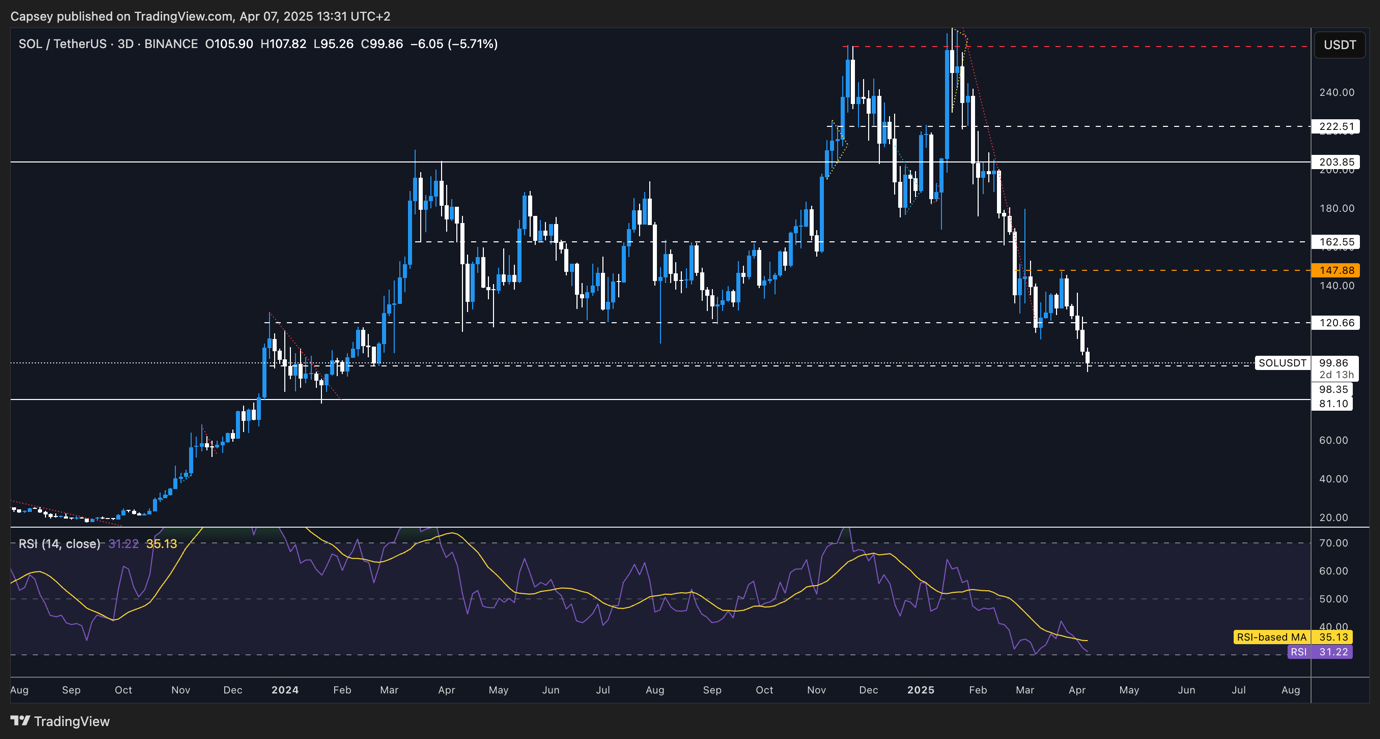
Chart-wise, we're looking at SOL on the 3D timeframe.
Price broke below the major horizontal support at $120, and it swiftly headed down to the next horizontal and psychological level of $98/$100.
If the $98/$100 horizontal support is broken to the downside, the next major horizontal level is at $81. At that point, we'll see where we are on the macro front, but we might consider chipping in with buys at $81 (assuming price can get there).
If the $81 level is lost, then $52 is next. If we did get that, it'd be a strong buy.
The RSI is entering oversold territory on the Daily timeframe, and it's also very close to oversold territory on the 3D timeframe, whilst also putting in a bullish divergence.
To the upside, the major horizontal resistances are at $120 and $148. We'd struggle to get bullish before a reclaim of $120. That may take time.
Next Support: $81
Next Resistance: $120
Direction: Neutral/Bearish
Upside Target: $120
Downside Target: $81
Cryptonary's take
In keeping this really 'short and sweet', SOL has broken a really key level of $120, and the price has swiftly moved down to $100. We expect the $81 level to be tested in the coming weeks. If the price trades at $81, we'll consider buying at that level. However, we'd want to see less retaliation on tariffs and deals starting to be done.
There seems to be more to the tariff uncertainty and markets responding with downside. For SOL, we're not looking to buy yet.
Solana struggles at $148 resistance
01 April 2025
As Solana faces strong resistance and key support levels, the market's outlook remains cautious. Let’s dive into the technical landscape of SOL and explore what’s next for its price movements in this uncertain environment.
Disclaimer: This is not financial or investment advice. You are responsible for any capital-related decisions you make, and only you are accountable for the results.
SOL's Open Interest (by the number of coins) remains really high, but the Open Interest in USD isn't close to its highs. This therefore just tells us that OI is high by a number of coins because the price of SOL has halved in the last few months.
Funding Rates like ETH and BTC are close to 0.00% but are very slightly positive. There is little signal here from a leverage perspective, to be honest.
SOL's open interest (by number of coins):
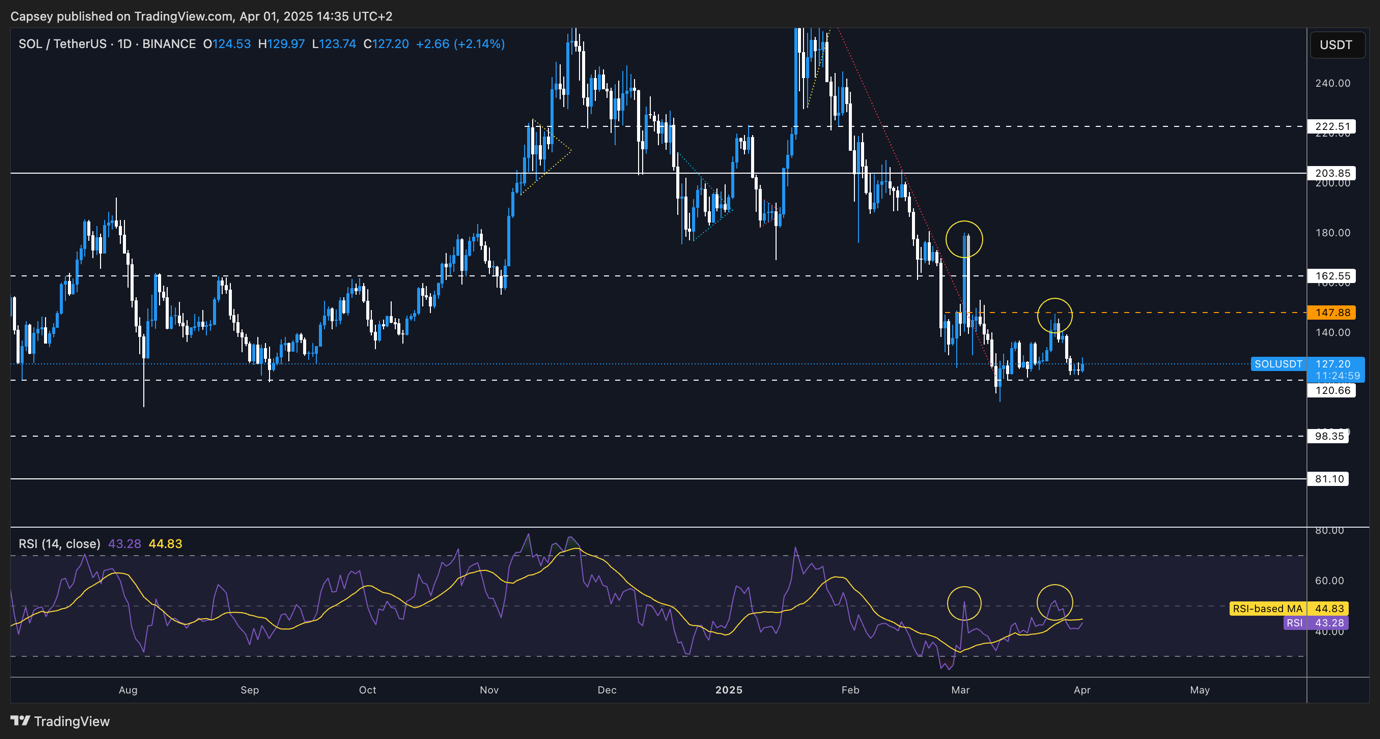
Technical analysis
SOL rejected off the local horizontal resistance at $148, having put in the hidden bearish divergence (lower high in price, higher high on the oscillator).
Price has since pulled back to the horizontal support of $120 and retested that area as support, as we expected it would do.
Price is now attempting to bounce, but the RSI is moving into the underside of it's moving average. It's possible this is a local stalling area for SOL's price here in the short-term.
Price is essentially in this tighter zone between the $120 horizontal support and the $148 horizontal resistance. Beyond that, $98 is the major support and $162 is the major horizontal resistance.
Next Support: $120
Next Resistance: $148
Direction: Neutral/Bearish
Upside Target: $148
Downside Target: $98
Cryptonary's take
In the short term, we expect the price to remain range-bound between the levels we've identified ($120 to $148); however, in the short/medium term, we do expect the price to break down and test $98. At that point ($98), that's where we'd be strongly considering buys.
For now, though, our bearish bias remains as we expect a continuation of the fiscal unwind and the uncertainty surrounding the new Trump administration.
If you're a range trader, you can play the range. If not, remain patient, and we'll look to play the wider range ($98 support of $162 horizontal resistance).
SOL likely to retest $120 support
28 March 2025
Solana ($SOL) continues to be range-bound, with price fluctuating between key support and resistance levels. Traders are cautious, waiting for a possible breakdown below support or a breakout above resistance.
Disclaimer: This is not financial or investment advice. You are responsible for any capital-related decisions you make, and only you are accountable for the results.
SOL's Funding Rate has also fluctuated from slightly positive to slightly negative, showing indecision amongst traders.
SOL's Open Interest (by number of coins) has interestingly spiked to new highs, showing that there's still appetite to trade SOL with leverage.
SOL's open interest (by number of coins):
Technical analysis
SOL saw some relief from the major horizontal support of $120, however price has seemingly rejected into the local resistance level of $148.
In the short term, price is likely to remain range-bound between $120 and $148.
Beyond $148, the major horizontal resistance is at $162. We don't expect this area to be reached in the short term.
If the $120 horizontal support is broken and we still believe this is a possibility over the coming weeks, then $98 is the next major horizontal support. If that level is reached, we'd strongly reassess at the time, but our thinking is that we'd be considering buys there.
The RSI is in middle territory and it's up trending, however, the RSI is resting on top of its moving average. It'll need to use the moving average as support here. If not, the rice can drive lower.
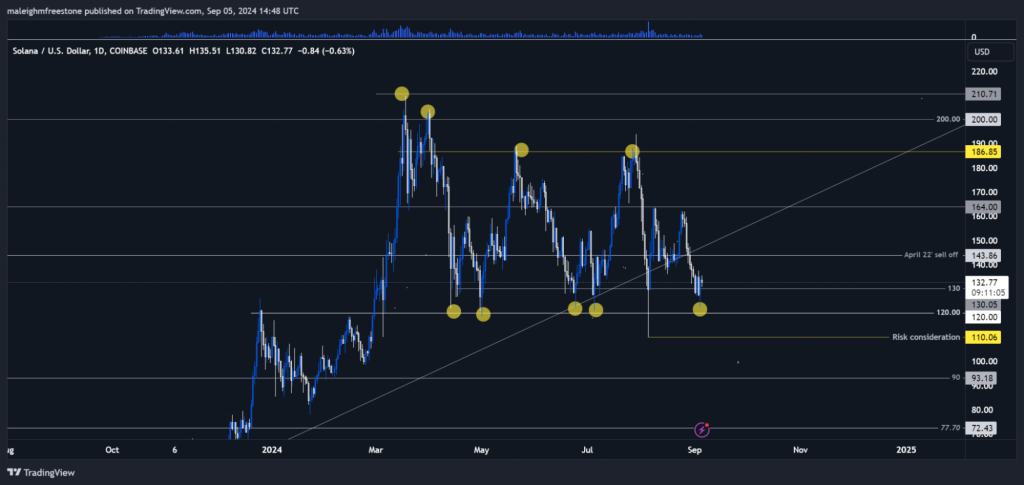
The RSI did also put in a hidden bearish divergence when price spiked into $148. This is when price makes a lower high and the oscillator makes a higher high. We've marked this out on the chart (yellow circles).
Next Support: $120
Next Resistance: $148
Direction: Bearish
Upside Target: $148
Downside Target: $120
Cryptonary's take
Whilst SOL did show some signs of life, and we did see that in some memes which had strong rebounds, SOL is still unable to reclaim some key levels. This is, however, the case with many coins.
For now, we expect SOL to be range bound between $120 and $148, however, we do expect a breakdown (of $120) to be more likely than a breakout to the upside. Therefore, we remain patient in the near-term, and if we're right, we'll reassess upon a break below $120 (again, assuming we're right).
SOL fights key $120 support
18 March 2025
SOL:
SOL's Open Interest has come down in USD terms but not so much in coin terms. This doesn't give us a clear trading signal.
SOL's funding rate has been mostly negative over the last few days, showing traders are trying to Shorten these small bounces. This will likely set up a short squeeze at some point in the medium term. We wouldn't be looking for Shorts in SOL anytime soon - although that doesn't mean we're looking for Longs either.
SOL's funding rate:
Technical analysis:
SOL is currently fighting at the main horizontal support of $120 which has been the major support for SOL throughout the last year.
If the $120 horizontal support is lost, and we expect it will in the medium term, then the next key horizontal level is at $98.
The RSI is out of oversold territory, and it put in a bullish divergence which is likely what has helped price move up very slightly.
To the upside, the horizontal resistances are at $136 and $162, although we don't see $162 being retested anytime soon.
Next Support: $120
Next Resistance: $136
Direction: Neutral/Bearish
Upside Target: $136
Downside Target: $98
Cryptonary's take:
SOL has moved into the mid-$130's and rejected there. It's currently battling at the $120 horizontal support, and the price will need to hold that level, or it risks moving down to $98. $98 is where we'd start looking to bid. If we're right, then this might take more time to play out, potentially weeks.
However, $98 seems like it would be good, at least for a meaningful bounce play, if not long-term buys. For now, we'll remain patient, and we'll bid SOL if it moves down to $98. We expect in the short-term that the price just grinds between $120 and $136 before it breaks down to $98. This'll likely come on BTC's next big breakdown.
Relief rally or rejection at $142?
14 March 2025
SOL's Open Interest has fallen off a cliff since its mid-January highs. However, this is also due to the coin's price falling so dramatically as well. OI, measured by the number of coins, is relatively high, but we have to take that with a 'pinch of salt' because it now takes less $ to leverage 1 SOL (price is now substantially less than it was 8 weeks ago).
Therefore, SOL's OI doesn't provide us with a strong trading signal here, but it is important to still be watching it.
SOL's Funding Rate is flat at 0.00%, so there's no clear bias between Longs and Shorts.
SOL's Open Interest (by $):
Technical analysis
SOL dipped below the major horizontal support of $120, but fortunately, it was quickly reclaimed.
The RSI was in oversold territory, but it hadn't printed any bullish divergences. It now has, and that might be enough for the price to get a small local relief bounce.
The local resistance level is likely in the zone of $138 to $142. So, if there was a small relief rally, we'd expect $138 to $142 to be a potential sticking point.
Above $142, the major horizontal resistance is at $162.
To the downside, if the $120 level is lost (and we think over the medium term, it can be lost), then $98 is the next major horizontal support.
Next Support: $120 (then $98)
Next Resistance: $138
Direction: Neutral
Upside Target: $138
Downside Target: $98
Cryptonary's take
SOL could also potentially be set up for a small relief rally here in the immediate term. However, we'd expect $138 to $142 to be the sticking point.
We also wouldn't look too long for these bounces (potential bounces). However, we would be more inclined to short local highs, although BTC seems to be the better play in the immediate term.
SOL upside target remains at $138
10 March 2025
Solana is holding key support at $120 while traders lean bearish. A relief rally is possible, but resistance looms. Will SOL break out, or is there more downside ahead?
SOL's Funding Rate has turned negative over the last 12 hours, indicating that there is now a bias amongst traders to be Short rather than Long. However, it's worth noting that this can change quickly.
SOL's Open Interest has been down only since the price's all-time high. This has been due mostly to the price of SOL going down. SOL's OI (by the number of coins) is up over the last few days though, indicating that there is still some appetite amongst traders to take on leverage.
SOL's funding rate:
Technical analysis
From a TA perspective, SOL doesn't look too bad here.
SOL is at the bottom of the range and the price is just above the major horizontal resistance of $120.
The RSI has broken out of its downtrend line, whilst it's also sat on top of its moving average.
SOL has now also put in a bullish divergence on the RSI (a lower low in price, into support by the way, and a higher low on the RSI).
On the upside, the local resistance is at $137. Beyond that, it's $148 and $162.
On the downside, so if the $120 level is lost, then $98 is the next key level of support.
Next Support: $120
Next Resistance: $138
Direction: Neutral
Upside Target: $138
Downside Target: $98
Cryptonary's take
SOL is at major support here, having also just put in a bullish divergence. This might help SOL to get a small relief bounce, especially if the S&P and the Nasdaq can also get a small relief bounce just simply due to them being close to oversold.
In the medium term, we do expect more downside, so that potentially does put us off Longing SOL here at $130 into say $137. A Long here would be a trade against the macro trend, which we believe, for now, is still down.
SOL eyes $203 if momentum builds
3 March 2025
Solana’s breakout from its recent downtrend has traders on edge as the price pulls back to a critical level. With leverage fading and uncertainty rising, the next move could define SOL’s short-term trend.
SOL's Open Interest spiked when the price collapsed in mid-February. This is mostly just due to it then being much cheaper to leverage 1 SOL coin. This Open Interest is now decreasing again though, suggesting there's less confidence amongst traders to use leverage.
SOL's Funding Rate has fluctuated between slightly positive and slightly negative, again indicating indecision amongst traders.
SOL's open interest (by number of coins):
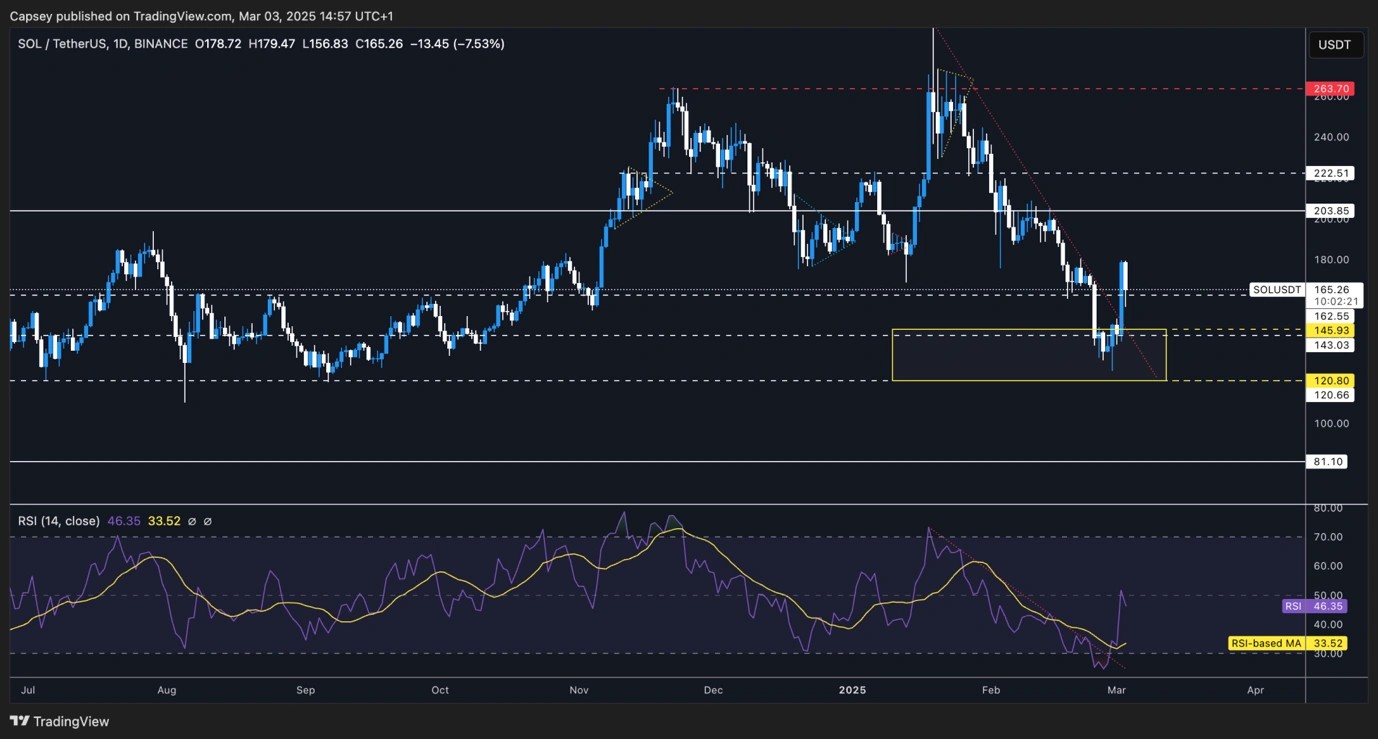
Technical analysis
SOL bounced perfectly from the Yellow Box, and the price broke out of the downtrend line.
Price also broke above the key horizontal level of $161, with price now having pulled back to this horizontal level and testing it as new support.
If the $161 horizontal support can't hold, it'll be important for the $143 level to hold, as to then put in a higher low.
To the upside, $182 and $203 are the next major horizontal resistance levels.
The RSI has broken out of it's downtrend line, which is a positive, but it has run potentially further than expected.
Next Support: $143
Next Resistance: $182
Direction: Neutral/Bearish
Upside Target: $182
Downside Target $120
Cryptonary's take:
SOL has broken out of what was a drastic downtrend. However, we don't expect this break out to last or push higher from here in the short-term. Our current expectations are that SOL will battle at the $161 level for a day or so and then likely break down to $143.
In the short and medium term, we're not expecting any fireworks from SOL. Of course, there is the possibility that Friday's Summit might bring some news, but we are expecting it to be a 'sell the news' event.
Will SOL reclaim $180 resistance soon?
24 February 2025
Solana faces bearish pressure as it breaks support, with traders uncertain about direction. While a relief bounce is possible, overall sentiment remains weak as funding rates fluctuate and shorts dominate.
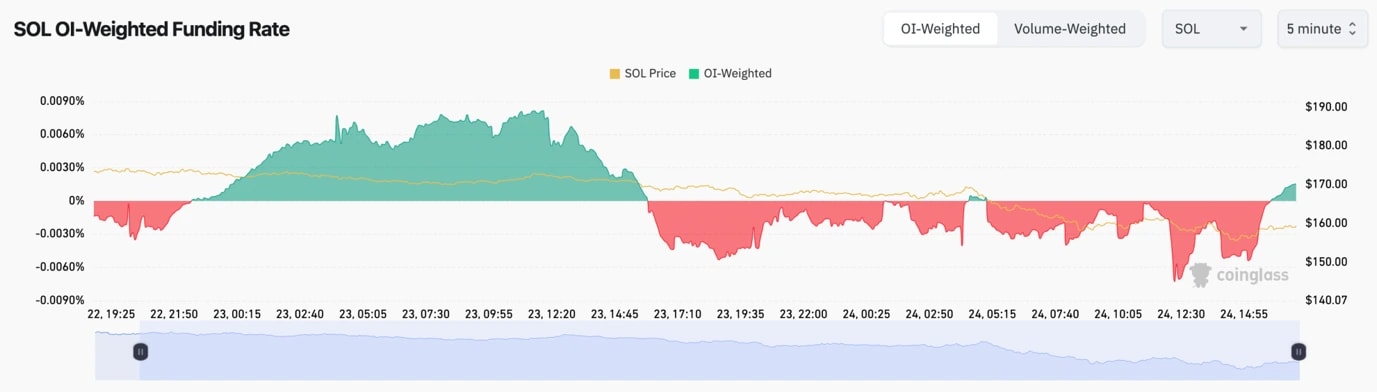
SOL's funding rate has fluctuated between positive and negative. But mostly it's been negative, suggesting that Shorts have been more dominant.
SOL's Open Interest is at new highs (measured by a number of coins). However, this is partly due to there still being a lot of interest, and also the price is much lower ie, less $ needed to Long or Short 1 SOL.
Ultimately, OI is high, and we're seeing traders flip-flop meaning there's a lot of uncertainty around positioning. Not an attractive setup here.
SOL's funding rate:
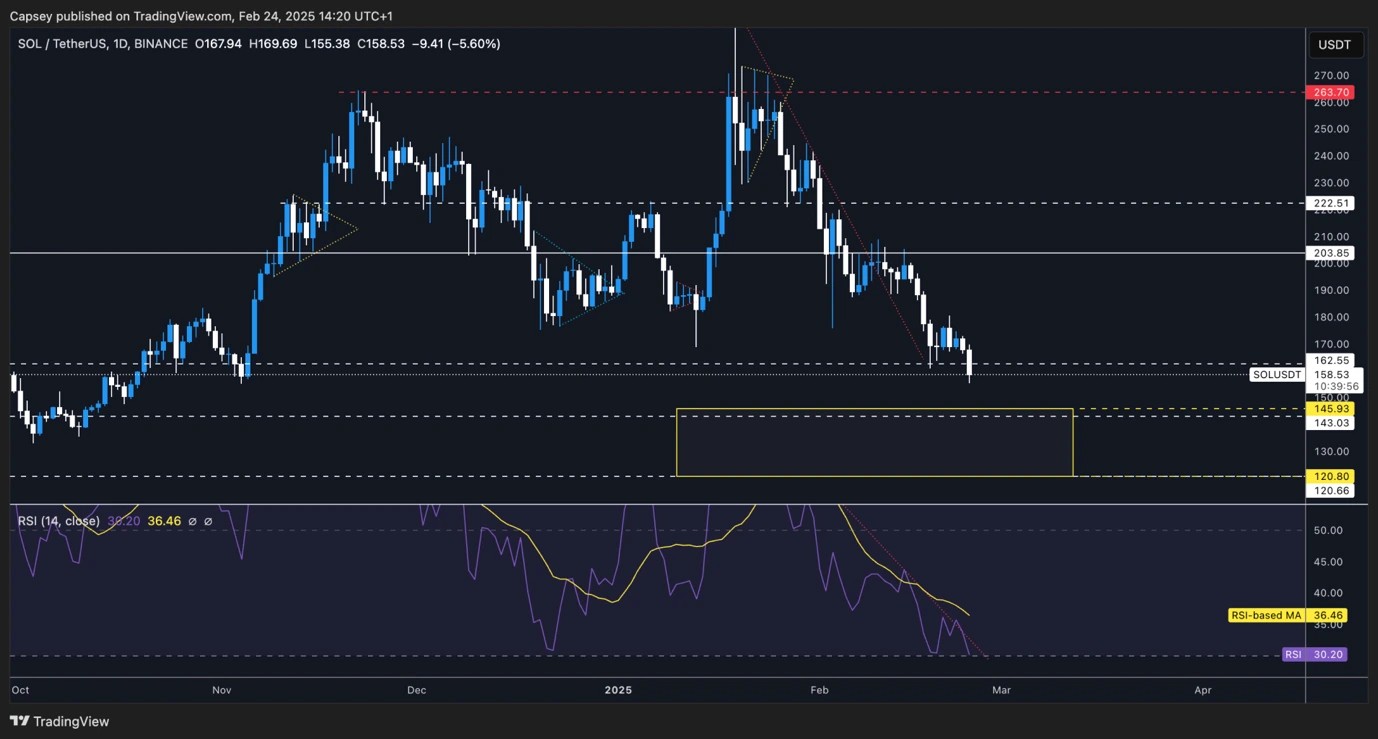
Technical analysis
SOL has just breached its horizontal support of $162, however, this support does extend to $158, so it's more of a zone of support.
Price has pulled back substantially and it's now only 10% above the main Yellow Buy/Support box, we outlined 6-8 weeks ago.
Interestingly, SOL's RSI is very close to being overbought, and it can put in a bullish divergence today (assuming the price closes a new low and the oscillator closes a higher low). This might be what's needed for SOL to get a small relief bounce.
In terms of horizontal resistance, the low $ 180s is likely to be that level.
Next Support: $145 (then $120)
Next Resistance: $180
Direction: Neutral/Bearish
Upside Target: $180
Downside Target: $120
Cryptonary's take
Overall, it's just not a great chart, even though a potential relief bounce is possible. We're seeing a cleanse in the SOL eco-system, or rather we're on the cusp of a cleanse after meme's crime season ($TRUMP, $MELANIA, $LIBRA etc).
In the short term, a relief bounce is possible, we're just not sure we'll play it, as the narrative around SOL right now isn't great. We still expect the Yellow Box to be retested in the upcoming weeks.
SOL holding $162, next $145?
18 February 2025
Solana ($SOL) struggles to hold $162 as Bitcoin’s move looms large. With resistance at $188 and $203, can SOL reclaim higher levels or is $145 next? Let’s analyze the latest price action and key levels.
Disclaimer: This is not financial or investment advice. You are responsible for any capital-related decisions you make, and only you are accountable for the results.
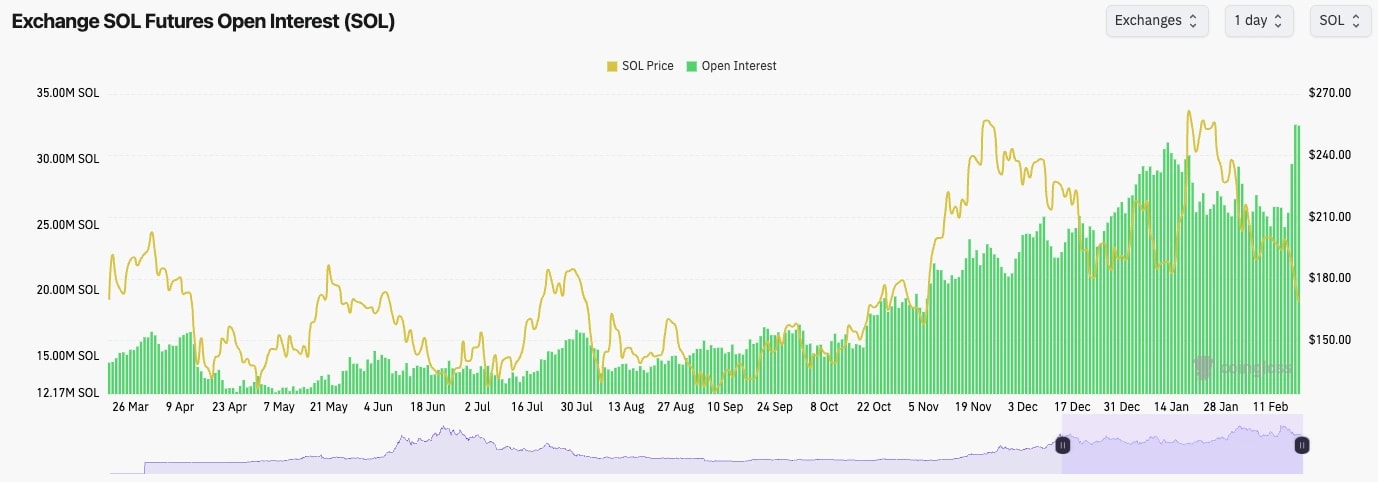
SOL's Open Interest has gone from 24m SOL to now 32m SOL, as the price has gone from $200 down to $165.
SOL's Funding Rate has fluctuated between negative and positive.
Overall, this may need more reset, and this will likely be a time capitulation/reset rather than a price reset.
SOL's open interest:
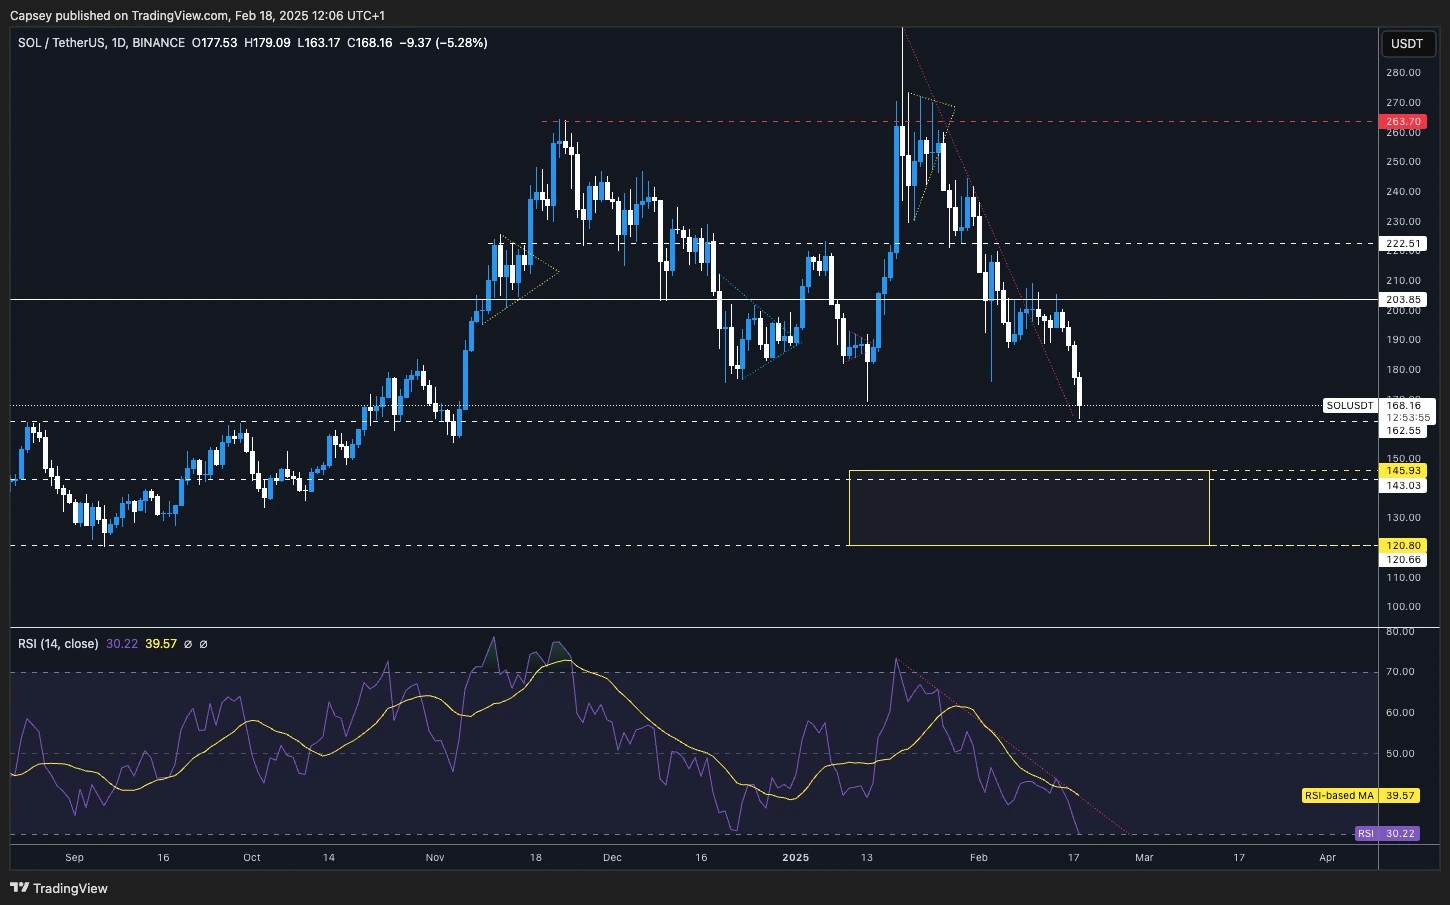
Technical analysis
SOL broke out from its main downtrend line, but it couldn't reclaim the horizontal level of $203. The price was then rejected from there and the price immediately moved down to the next horizontal support at $165. This is a good example of how crucial key horizontal levels can be for price.
The price is now at the next horizontal support of $162.
Beneath the current support, we have $145 and $120 as the next two key levels to the downside.
The RSI on the Daily and on smaller timeframes is now in oversold territory, whilst it's also well below its moving average.
To the upside, $188 is likely to be the next local resistance.
Next Support: $162
Next Resistance: $188
Direction: Neutral
Upside Target: $188 (maybe $203)
Downside Target: $145
Cryptonary's take
If BTC doesn't break down here, then SOL might be due for a small bounce in the short term. We're at a key horizontal support, with the indicators being quite oversold. However, we wouldn't expect $188 to say $203 to be flipped. It's possible we get into that zone, but we don't expect the price to reclaim $203 and move higher from there in the short term.
Solana’s next stop: $162 or $222?
10 February 2025
Solana ($SOL) is attempting to break out of a downtrend but faces strong resistance at $203. Support sits near $180, with the next upside target at $222. Can SOL sustain momentum?
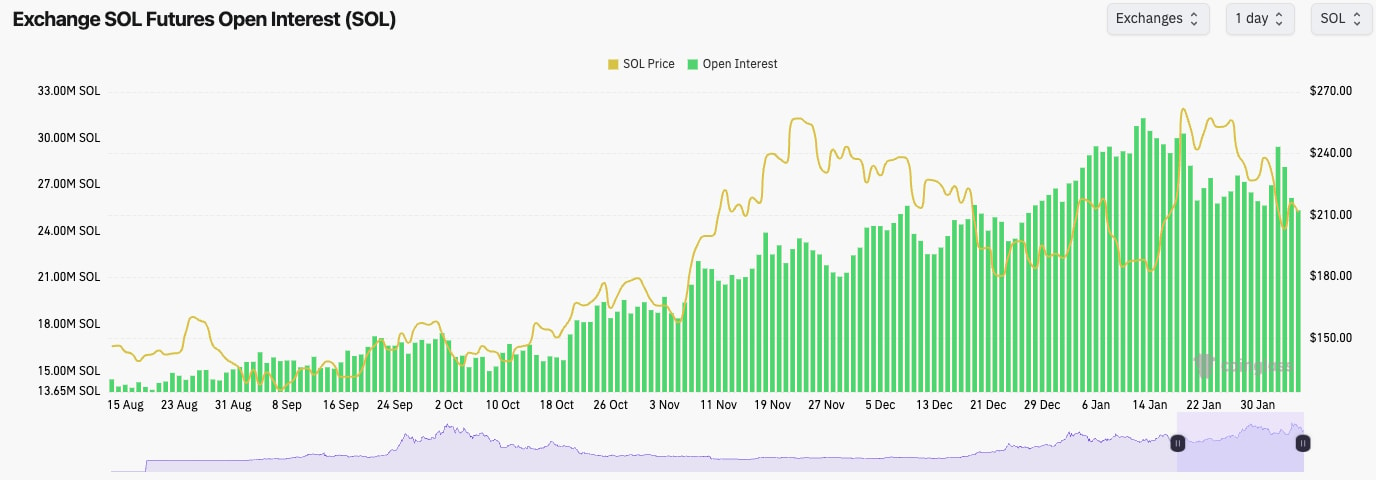
SOL's Open Interest (by number of coins) has been generally downtrending since early January, and since the price spike, it's remained flat. This essentially means that there aren't many signs of froth currently.
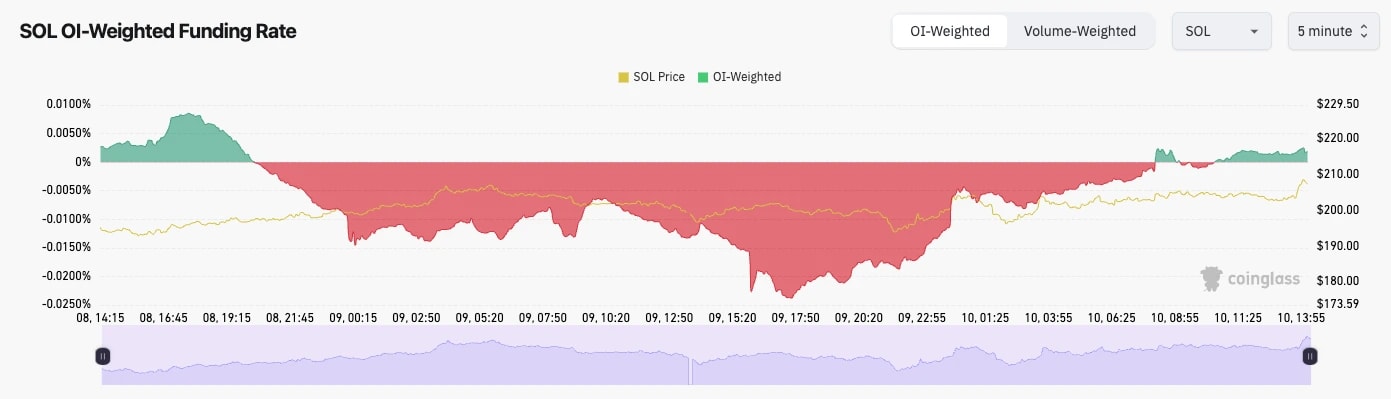
SOL's Funding Rate has fluctuated between slightly negative and positive, showing real indecision amongst traders. Funding was negative, and as price has ground higher in the last days, it's reset back to slightly positive.
SOL's funding rate:
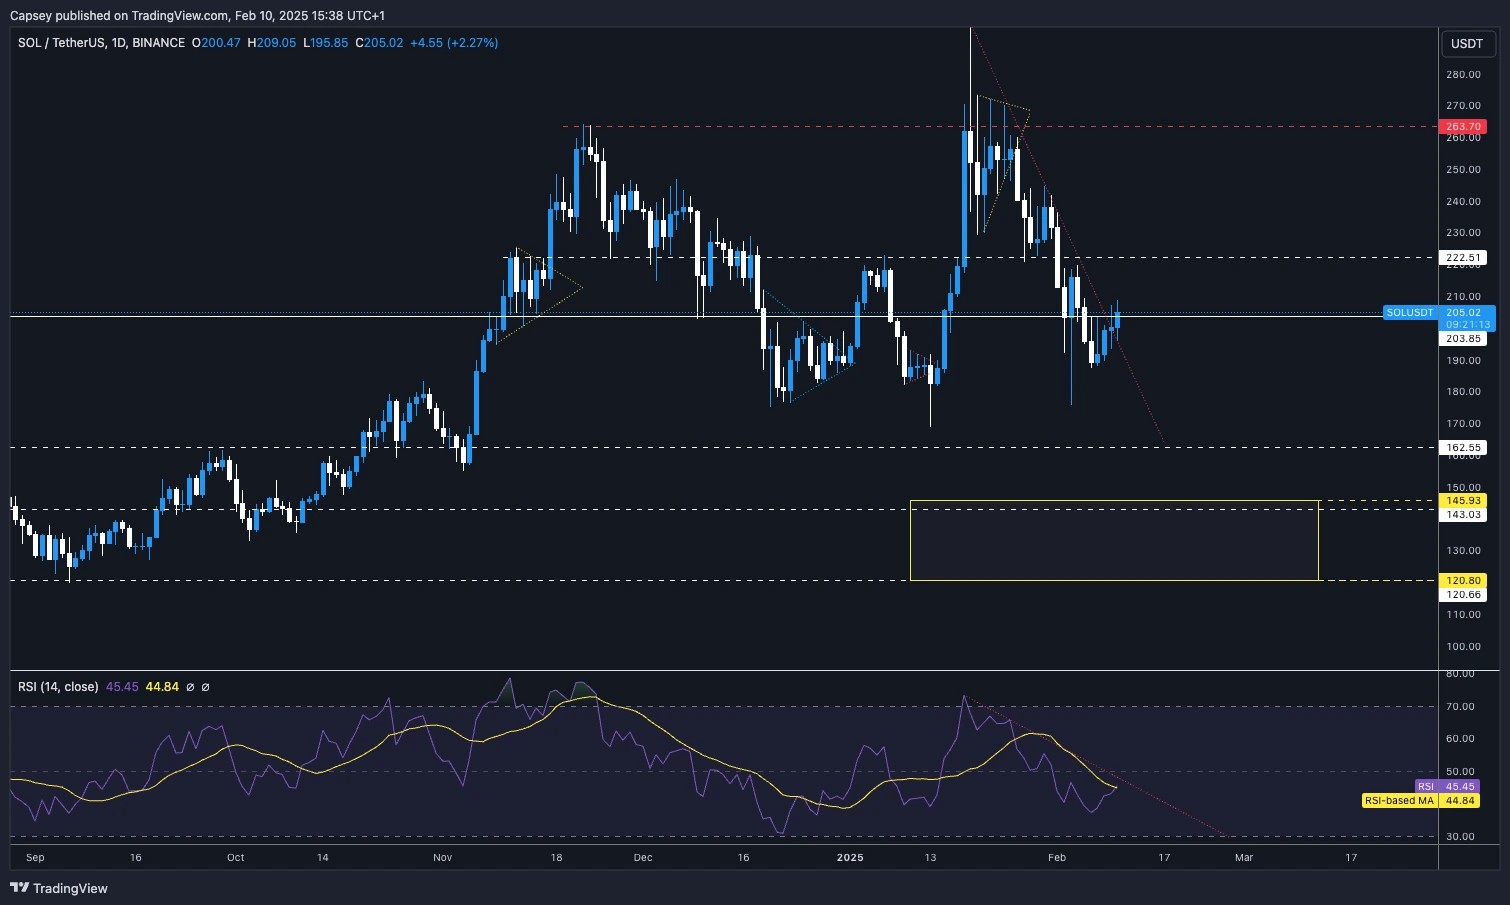
Technical analysis
SOL has found some support in the short term from an old level between $180 and $190.
SOL is now attempting to break out of its downtrend line, and also reclaim the horizontal level of $203.
If SOL can break out that might mean we see a further move higher, however, we think this might stall out around the horizontal level of $220 (the next horizontal resistance).
The major supports are at $180 to $188, and then at $162.
The RSI remains in a downtrend and it is now butting up to its moving average. The moving average and the downtrend may provide too much of a resistance from the price to break out from.
Next Support: $180
Next Resistance: $222
Direction: Neutral/Bullish
Upside Target: $222
Downside Target: $180
Cryptonary's take
Price is at a key point here in that it's attempting a breakout. In the immediate term, we're unsure if SOL gets the breakout or not. But, if BTC can drive up to $100k to $104k say, then SOL could potentially see $222. However, we would expect $222 to be a local stopping point, and maybe an entry for a potential Short - but again, we'll reassess around the time.
Solana eyes $240 but risks $183 drop
04 February 2025
Solana remains in a downtrend, struggling below $222 resistance. Open interest declined, and funding rates are fluctuating. SOL must hold $200 support to prevent further downside towards $180.
Disclaimer: This is not financial or investment advice. You are responsible for any capital-related decisions you make, and only you are accountable for the results.
SOL's Open Interest kicked up but then pulled right back down again as the Sunday/Monday liquidation event unfolded. Ultimately, the OI has remained in a downtrend since the start of the year.
Like ETH, SOL's Funding Rate fluctuates from positive to negative, indicating indecision amongst traders who are likely also being whip-sawed by the price action.
SOL's open interest (by number of coins):
Technical analysis
SOL did really well in bouncing aggressively and recovering at the $203 horizontal level.
Today, the price has moved lower and bounced off $203 as new support.
For now, the price remains below the horizontal level of $222. A reclaim of that level would be the bullish reversal we'd be looking for.
If the price breaks back below $200, the key level to then hold will be $182.
The RSI is in the middle territory, but it's currently well below its moving average, which may mean the price can rebound higher in the short term.
Next Support: $203
Next Resistance: $222
Direction: Bearish/Neutral
Upside Target $240
Downside Target: $183
Cryptonary's take
SOL has broken down into the lower end of the major range (between $200 and $260). Ultimately, SOL needs to remain above $200, but we wouldn't rule out a revisit to $180 in the short term. To get the bullish reversal, we'd need to see a breakout of the downtrend line and a breakout of the horizontal resistance of $220. Until we see that, we'd remain patient, and in the immediate term, we're open to seeing some more downside (possibly $180).
SOL eyes $263 for breakout
31 January 2025
Solana continues to trade in a tight range between $220 and $263, with no major moves yet. Bitcoin holds its support, and Ethereum struggles for a breakout. Will the market remain choppy, or is a shift coming soon?
Disclaimer: This is not financial or investment advice. You are responsible for any capital-related decisions you make, and only you are accountable for the results.
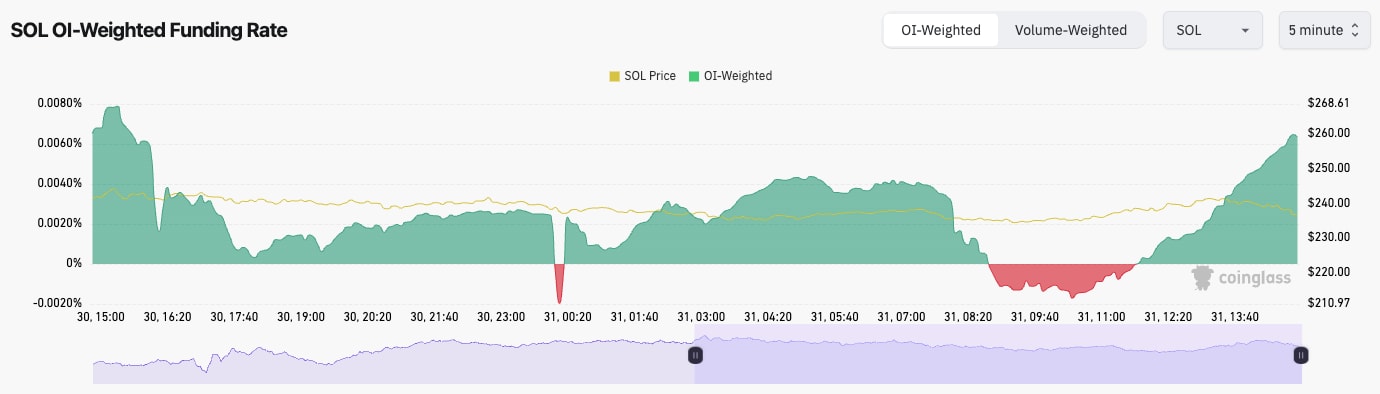
SOL's Open Interest has downtrended now for a few weeks, indicating that less leverage is being piled on.
SOL's Funding Rate is fluctuating between slightly positive and slightly negative, indicating indecision amongst traders.
SOL's leverage setup is more evenly balanced here, with no signs of any froth/or excitement.
SOL's funding rate:
Technical analysis
SOL bounced off the main horizontal support of $220, and the price has now bounced up to the local horizontal level of $240.
Price is in a larger range here between $220 (horizontal support) and the major horizontal resistance at $263.
The RSI is in the middle territory, but it's below its moving average.
Next Support: $220
Next Resistance: $263
Direction: Neutral
Upside Target: $263
Downside Target: $220
Cryptonary's take
There's no need to go heavy in detail here. SOL is just a range bound between $220 and $263, and we're expecting that to continue in the short term. Of course, a breakdown of the key levels ($220 and $263) will be the key thing to watch. Be patient with this and just let time give you/us more candles and, therefore, more information. There's no point getting stuck into (trading) something that's in the middle of a larger range. If we had to call it, we'd say there's more chance of a retest of $220 first than a retest of $260.
Solana price targets $263 – Can it break?
28 January 2025
Solana is consolidating between $220 support and $263 resistance as traders await a breakout. With funding rates flipping and open interest dropping, can SOL break higher? Let’s analyze the market and key levels to watch.
Disclaimer: This is not financial or investment advice. You are responsible for any capital-related decisions you make, and only you are accountable for the results.
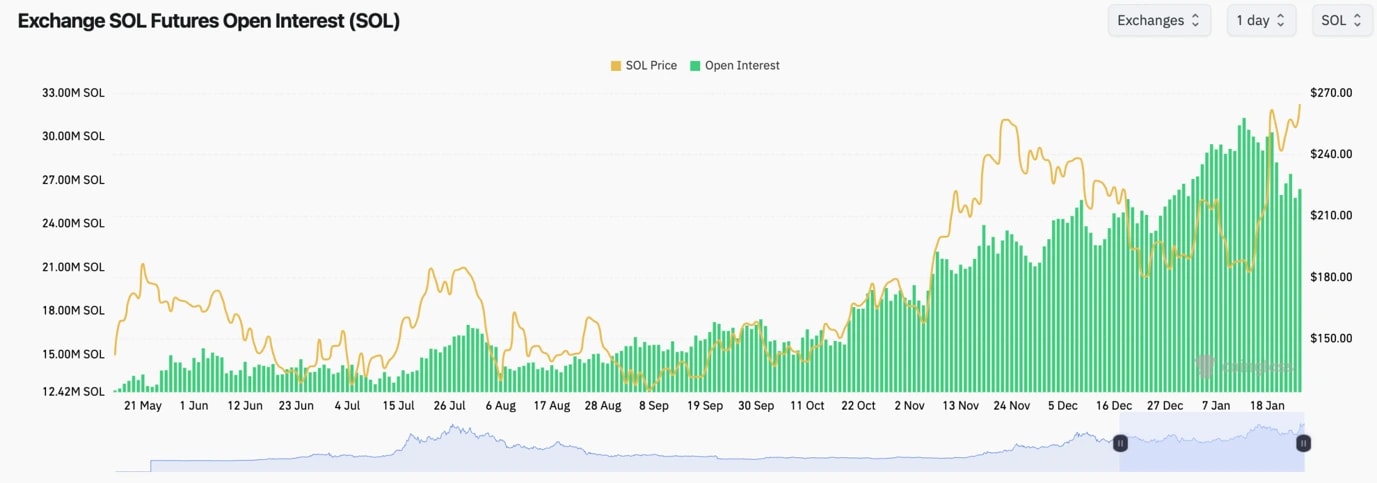
Interestingly, SOL's Open Interest (by number of coins) is down substantially but this is potentially due to the price now being much higher.
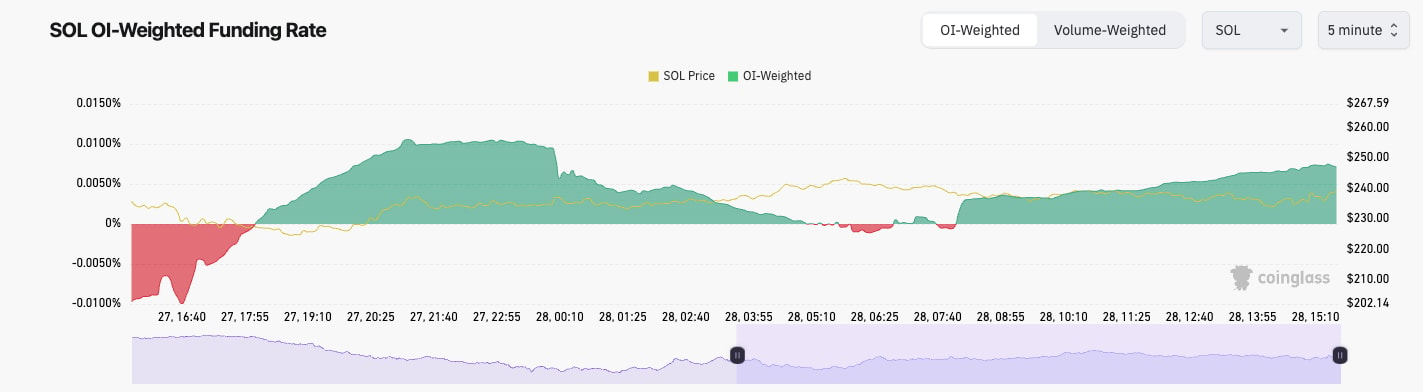
SOL's Funding Rate has been very choppy, flipping from positive to negative. This has likely been due to traders playing the range between $220 and $260.
SOL's funding rate:
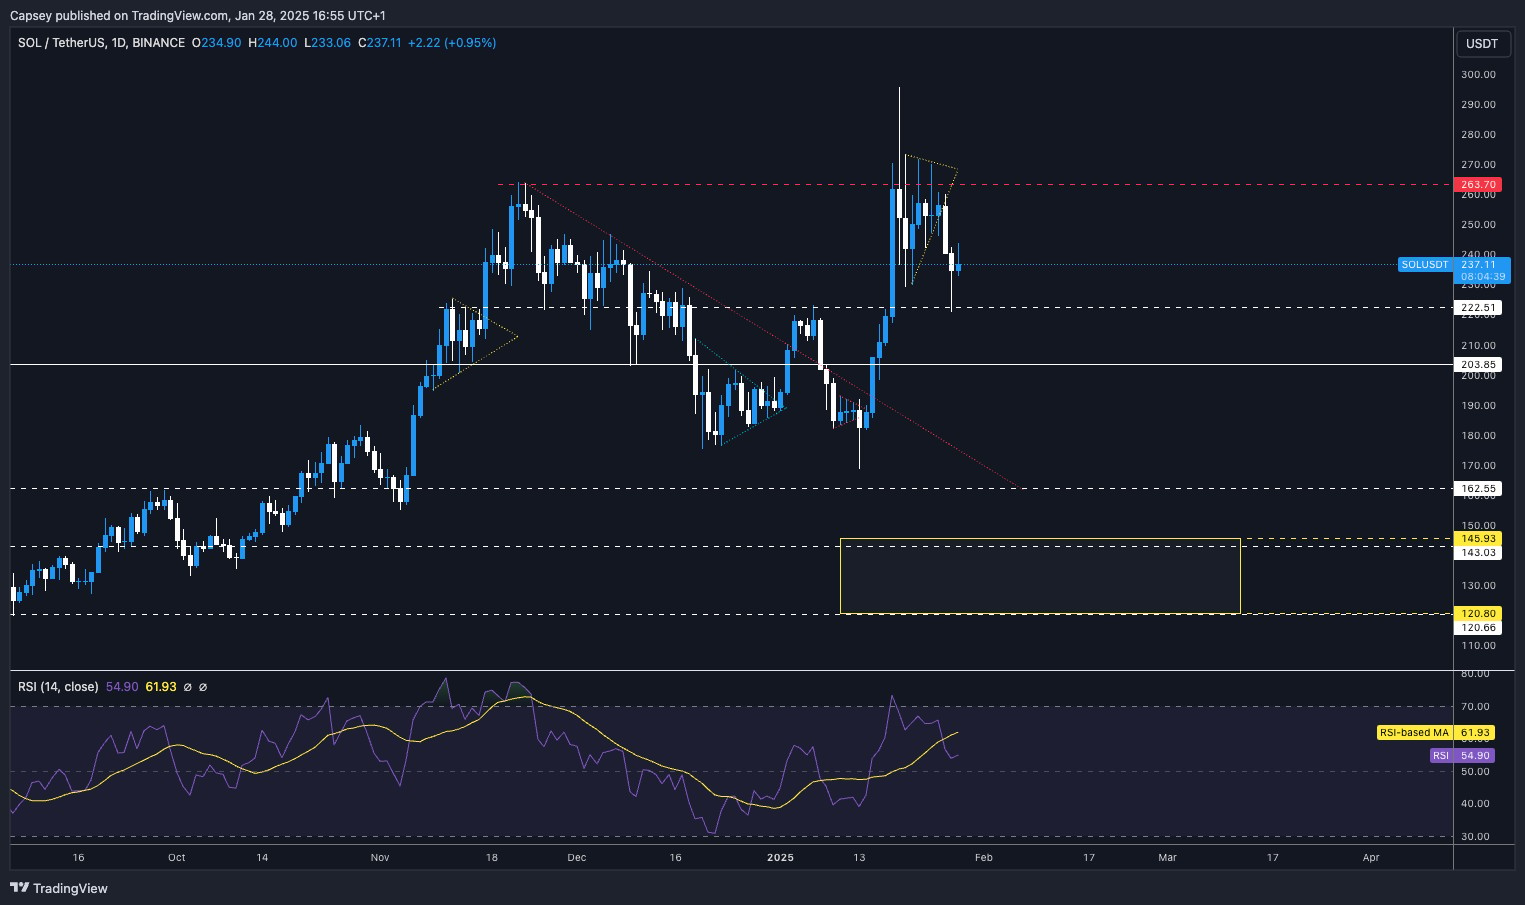
Technical analysis
SOL formed a pennant pattern but into the horizontal resistance of $263.
Unfortunately, the price was rejected from the pennant and broke down to the horizontal level of $220, where bids came in and the price bounced. These key horizontal levels we have marked are really solid and tend to work regularly.
Like many of the coins, the price is now in the middle of a larger range, between the $220 horizontal support and the $263 horizontal resistance.
The RSI is in the middle territory, but it's below its moving average, although again, this isn't a major concern for us currently.
Next Support: $220
Next Resistance: $263
Direction: Neutral
Upside Target: $260
Downside Target: $200
Cryptonary's take
Again, like BTC and ETH, SOL is in its larger range now, and we'll be waiting for the price to show us the way. However, we will also be a bit more practical with SOL in that if SOL pulls back into the $200 to $220 zone (particularly if it's around $200), we'll add to our long-term Spot positions.
In the meantime, we'll remain patient and let price action show us the way. For now, we still have a short-term bearish tilt amongst the Majors, but let's stress the short-term point.
SOL targets $300 after $270 break
24 January 2025
Solana ($SOL) is gaining attention with strong support at $220-$230 and bullish momentum pushing toward $270 resistance. ETF speculation adds excitement—will $300 be the next target? Let’s explore the latest analysis.
Disclaimer: This is not financial or investment advice. You are responsible for any capital-related decisions you make, and only you are accountable for the results.
SOL's Open Interest (by the number of coins) has declined over the last week.
However, the increase in price has been driven by significant Spot buys, which is very positive and may suggest that a Spot ETF might be approved.
SOL's Funding Rate is at 0.01%, indicating that there's a relatively healthy balance between Longs and Shorts.
SOL's open interest (by number of coins):
Technical analysis
SOL is in a really interesting spot here, having exploded higher and then pulled back from the all-time highs of around $300.
We're now seeing a bullish pennant form into a horizontal resistance, with the price now attempting to break out above it.
The horizontal resistance for the price to clear above is $263 - $270.
In terms of downside, $220 to $230 has acted as support, and we'd expect it to continue to do so going forward.
The RSI is very close to overbought territory, and a new price high would put in the bearish divergence into that overbought territory. However, if this is down to a Spot ETF being approved, then a breakout would have more legs.
Next Support: $220
Next Resistance: $260 (then $300)Direction: Neutral/Bullish
Upside Target: $300
Downside Target: $220
Cryptonary's take
Other than BTC, SOL is the coin that has shown real strength compared to all the rest. Now, this may be due to a potential ETF approval today, although this was widely unexpected just a handful of weeks ago.
We expect SOL to hold its lows, and if the price dips to $200 to $220, that would be attractive enough to us that we'd add to our SOL bags. If an ETF is approved today, then expect a more significant breakout. $300 likely being the target.
SOL battles $220-$260 resistance range
21 January 2025
As Solana stabilizes between $220 and $260, BTC and ETH maintain key levels. This week, we break down how these moves set the stage for the next market direction.
Disclaimer: This is not financial or investment advice. You are responsible for any capital-related decisions you make, and only you are accountable for the results.
SOL's Open Interest pulled back at the price lows, and it has been downtrending since, suggesting that the big move higher wiped out Shorts.
SOL's current Funding Rate is negative, but only just, suggesting that there is more interest in Shorting than Longing.
SOL's open interest (by number of coins):
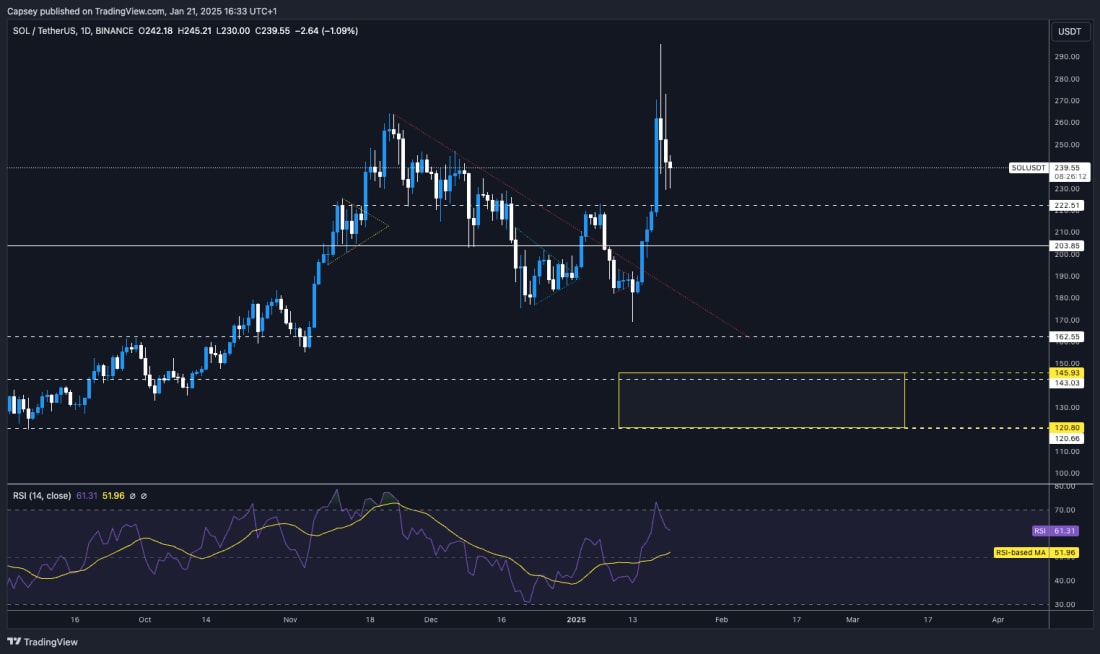
Technical analysis
This SOL move higher looks similar to WIF's big move higher to $4.80 when it was listed on Coinbase, although that doesn't mean the same will happen.
SOL has rejected $300, and it was unable to find support at the prior all-time high of $260.
SOL has pulled back, and for now, support has been found in the $ 230s. There is a major horizontal support at $220 also.
The RSI had moved into overbought territory, but it has since pulled back and reset on the price move back.
Next Support: $220
Next Resistance: $260
Direction: Neutral
Upside Target: $300
Downside Target: $200
Cryptonary's take
In the short term, it's possible that SOL needs to be range-bound for a while, likely between $220 and $260. This wouldn't necessarily be a bad thing building up a range just below all-time highs. It might set the breakout up for later. If there is a breakdown below $220, it's likely a good area to buy more SOL. However, a move into $200 would be the more attractive area if it were given.
SOL up 20% in three days
17 January 2025
SOL rebounds 20% in three days, testing $220 resistance. BTC and ETH hold steady, while upcoming policies may drive further momentum across crypto markets.
Disclaimer: This is not financial or investment advice. You are responsible for any capital-related decisions you make, and only you are accountable for the results.
SOL's Open Interest didn't take much of a dip, but it has kicked up again in the last 24 hours.
SOL's funding rates are also at 0.01%, the same as those of BTC and ETH.
This higher rebound has been Spot-driven so far.
SOL's open interest (by number of coins):
Technical analysis
SOL moved down and wicked into the tops of the old range in the $ 160s, although it was quickly bought up, and the price recovered really nicely.
SOL did really well to recover the horizontal level of $203, and the price is now butting into the major horizontal resistance of $220.
Going forward, we would expect $203 to be supported in the short term. If that level is lost, then that opens the door again to our bear case for the near term.
One thing to watch here is the RSI, which is currently close to putting in a hidden bearish divergence.
Next Support: $203
Next Resistance: $222
Direction: Neutral/Bullish
Upside Target: $240
Downside Target: $203
Cryptonary's take
Seeing the potential hidden bearish divergence, the butt up into the major horizontal resistance, and the fact that the price is up 20% in 3 days, it feels hard to FOMO in here (if I were looking for buys).
Again, SOL's price action will depend on the price next week. Ultimately, you want to see $203 held as support. A convincing breakout of $220 and SOL can really start pushing higher, especially if this is off the back of super bullish pro-crypto Executive Orders from Trump.
SOL buy box at $120-$145
13 January 2024
Solana struggles below $203 resistance and hovers near $178 local support. The Yellow Buy Box ($120-$145) could attract buyers if bearish trends continue.
Disclaimer: This is not financial or investment advice. You are responsible for any capital-related decisions you make, and only you are accountable for the results.
SOL's Open Interest also continues to grind higher, indicating that there is a large build-up of leverage.
SOL's funding rate is close to flat, at 0.00%, indicating there is an even balance between Longs and Shorts currently.
SOL's Open Interest (by number of coins):
Technical analysis
SOL broke out of its main downtrend line, but the price was rejected at the horizontal level of $222. Price then broke below the horizontal level of $203, formed a bearish pennant and broke down again.
Today, the price broke down to $170, but we've seen bidders step in and push the price back close to $180 currently. $178 is new local support for the price, with the major horizontal support beneath the current price at $162.
The Yellow Buy Box is currently between $120 and $145. We will be majorly interested if SOL visits that area, although we're not expecting this in the immediate term.
The RSI is at 37, which is just above overbought territory, although there is room to still go lower. A retest of 30 on the RSI would likely put in a bullish divergence (lower low in price, higher low on the oscillator). We'd potentially be buyers of this.
Next Support: $162
Next Resistance: $184 - $190
Direction: Neutral
Upside Target: $203
Downside Target: $145 - $162
Cryptonary's take
SOL has pulled back substantially. If the price moves below $162, we'll become interested in potentially adding to our bags. However, we'd prefer the Yellow Box for larger buys. In the immediate term, it's possible we get a move up to $184 before a further move. SOL is the more tricky one out of the majors here to call correctly. We're unsure of direction in the immediate term, but we do think prices can go lower in the coming month.
SOL leverages $203 support, targets $236
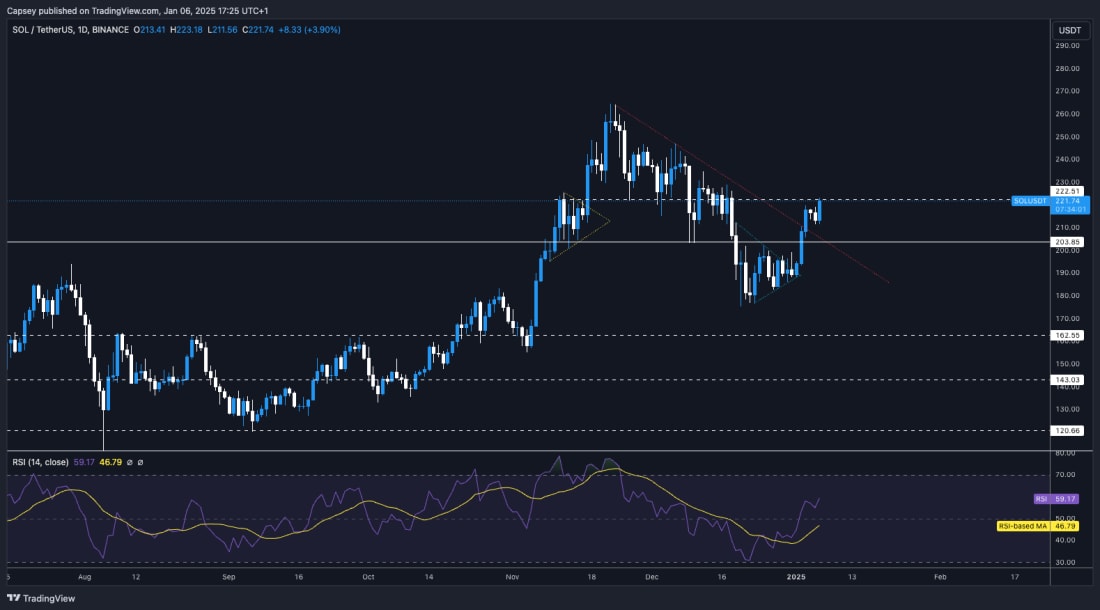
6 January 2025
Solana ($SOL) nears $222 resistance after a strong breakout, targeting $236. Rising open interest and RSI at 59 signal bullish momentum with room for more upside.
Disclaimer: This is not financial or investment advice. You are responsible for any capital-related decisions you make, and only you are accountable for the results.
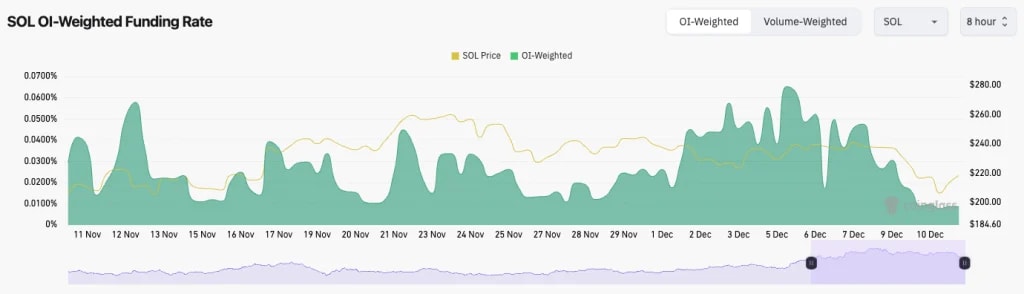
SOL's Funding Rate is at 0.0050%, which means there's more of a Short build-up in the leverage in comparison to BTC and ETH. The funding rate is still positive, though.
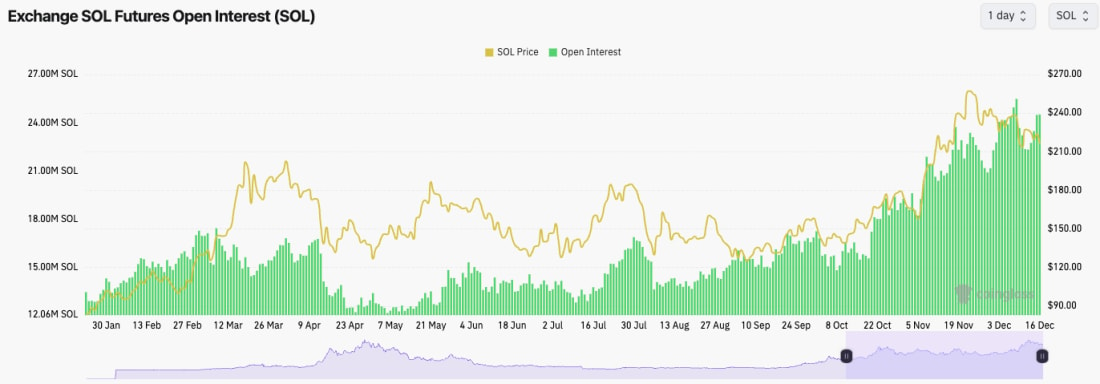
SOL's Open Interest has also now soared to new highs. Interesting. Again, there's a lot of leverage, but positioning is relatively evenly balanced. This opens the door to one side being blown out. If the price goes higher, Shorts will be blown out, and we may see a price squeeze higher.
SOL open interest (by number of coins):
Technical analysis
SOL has broken out of the main downtrend line really cleanly.
The price is now butting into the main horizontal resistance line at $222, and we'll be looking for a clean break at this level.
The price is now in this higher range, between $203 and $222, so a breakout would be fantastic. If the price were to be rejected at $222, this wouldn't be too bad as long as the price holds the local low at $211.
The major horizontal support now is at $2023.
Beyond $222, the next horizontal resistance is at $236.
The RSI has broken up from the lows and is now well above its moving average. It's also printing at 59, which is quite a bit shy of overbought territory. This, therefore, has likely more room to run higher in the short term.
Next Support: $203
Next Resistance: $222
Direction: Neutral (Bullish)
Upside Target: $236
Downside Target:$203
Cryptonary's take
Again, this is another move we called for in the last Market Direction for SOL. We probably didn't expect as much as this so soon, so really, that emphasises how good and strong this move higher is so far. If BTC keeps running, then SOL likely follows and breaks through $222 and sends to $236. However, if there is a consolidation for a few more days below $222, we wouldn't worry about this, and we'd still expect a breakout to come, just to come slightly later on.
SOL testing $215 resistance soon
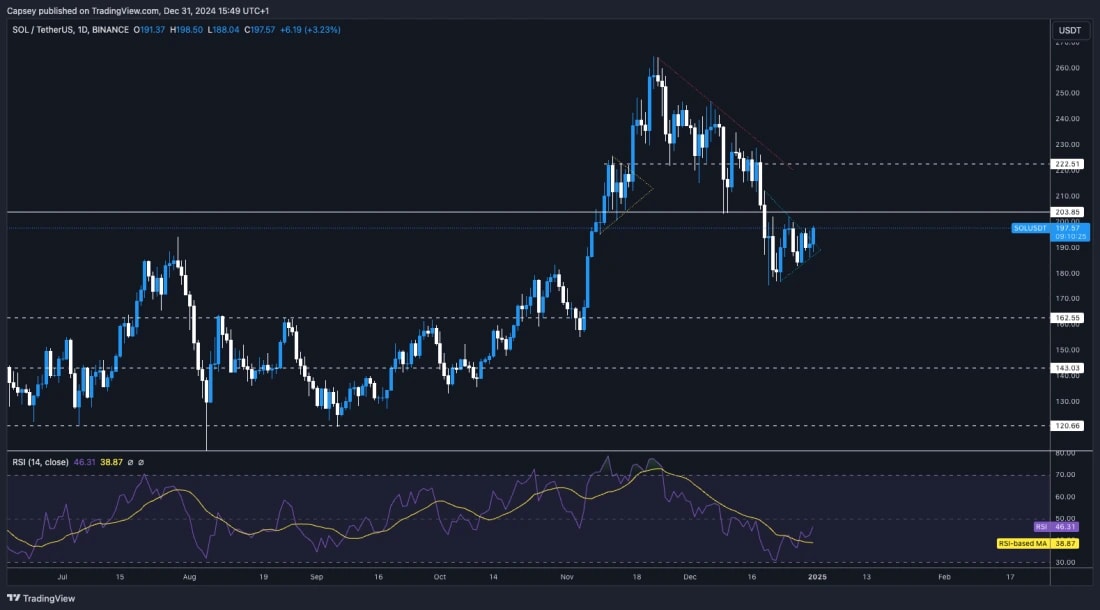
31 December 2024
Solana ($SOL) consolidates between $180-$200 after a 30% pullback. Reset indicators suggest upside potential, with $215 as the next key resistance in focus.
Disclaimer: This is not financial or investment advice. You are responsible for any capital-related decisions you make, and only you are accountable for the results.
SOL's Funding Rate also remains flat/healthy at just 0.01%. This is good to see with SOL, which is near $200, and there doesn't look to be any excessive leverage built up.
SOL's Open Interest (in USD terms rather than by a number of coins) has pulled back from approximately $6.0b to $4.5b in just a few weeks. This is a meaningful pullback, and it means that any excesses have been flushed out on what is a mere 30% pullback from the highs seen in the $250's. Good to see all around.
SOL's open interest (in USD terms):
Technical analysis
SOL broke below the key range between $200 and $220, finally finding support in the late $170's. This isn't a move we expected. However, it did meaningfully reset a handful of the indicators, with the RSI even breaching into oversold territory on the Daily timeframe.
The price has now spent some time being in a range bound between $180 and $200 and forming a pennant-like pattern, although it isn't the most accurate pennant.
The RSI has moved off of oversold territory, and it's now broken above its moving average. This may help send the price higher.
Stay updated onSolana price prediction—explore our full analysis for the latest market insights.
Next Support: $180
Next Resistance: $200
Direction: Neutral (Bullish)
Upside Target: $215
Downside Target: $180
Cryptonary's take
We're expecting the price to move to $205, potentially $215, and that'll be the crucial testing point to see if the price can reclaim higher levels. In the short-term, we think we can see a breakout to $215, but we're not sure we get much more than that in the coming week.
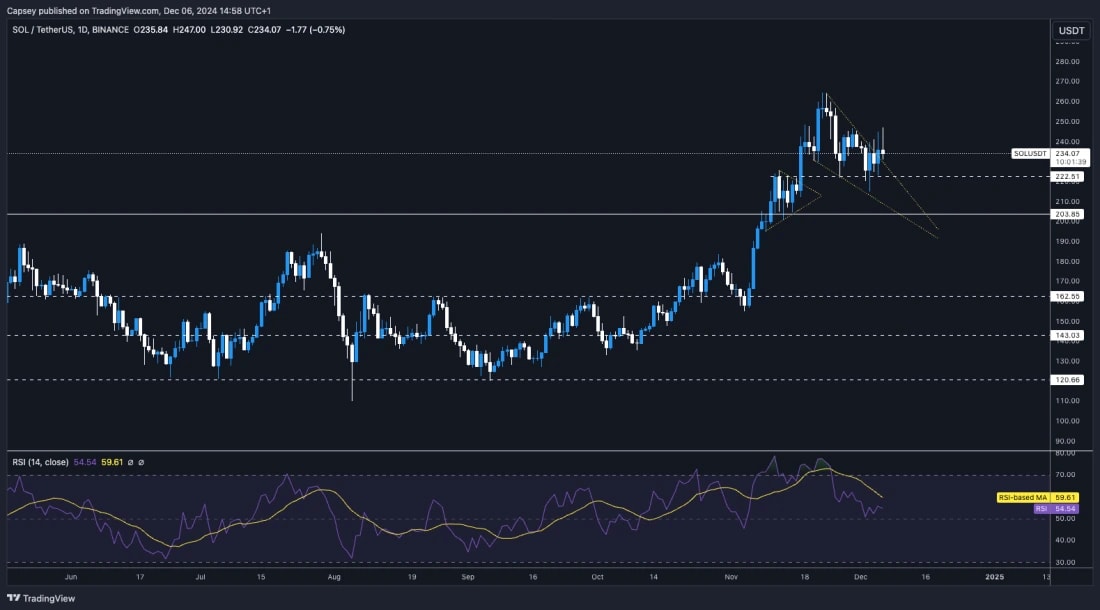
SOL resistance at $222 and $245
16 December 2024
Solana ($SOL) consolidates near key support while BTC holds highs and ETH tests resistance zones. Can SOL break out of its downtrend? Let’s dive into the latest price action.
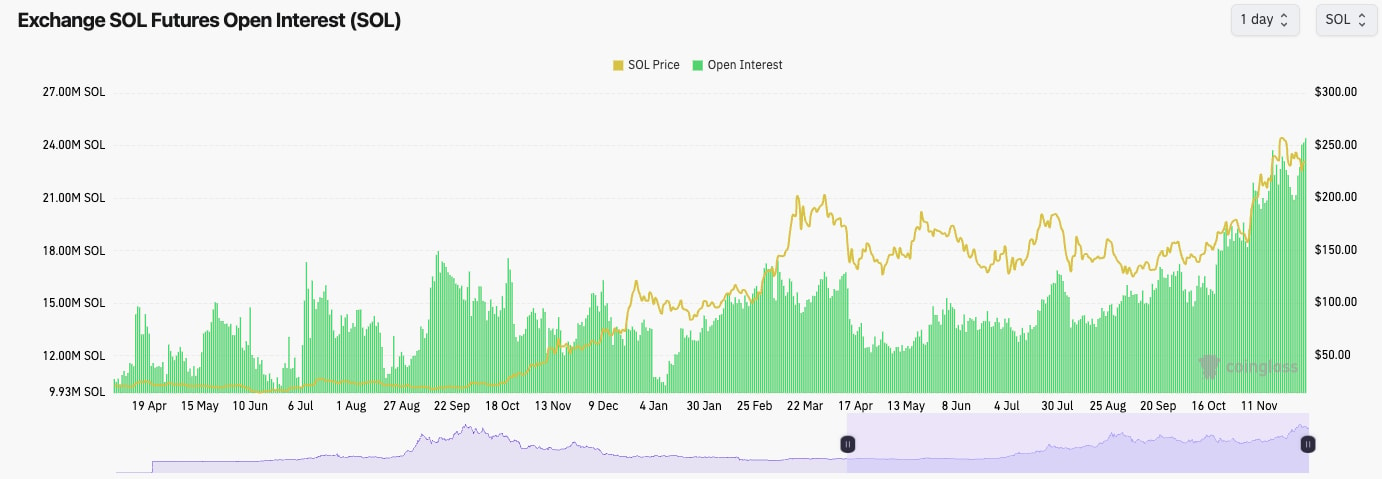
SOL's Open Interest has also ramped back up to its prior highs despite the leverage flush out a week ago.
The Funding Rate is back to the healthy level of 0.01%. This is positive.
SOL's open interest:
Technical analysis
SOL is currently in a downtrending channel, which usually does have a large breakout to the upside, assuming there is a breakout.
Price has seemingly lost the horizontal support at $222, and price now finds itself in the lower range between $203 and $222. However, we don't necessarily see this as a bad thing.
In terms of resistance, $222 is the first, and then it's $245. We'd also be looking for a breakout of the downtrend line (top border of the channel.
On the downside, $203 is the main horizontal line for the price to hold.
The RSI has also meaningfully reset to middle territory, although there aren't any divergences forming.
Next Support: $203
Next Resistance: $222 (then $245)
Direction: Neutral
Upside Target: $245
Downside Target: $203
Cryptonary's take
SOL has taken a breather here for the last month, but that's all we see it as, just taking a breather. We're looking at $203 to $222 as the zone where the price likely locally bottoms.
We remain really positive on SOL and expect it to get back to all-time highs in the coming month or two. In the immediate term, we expect the price to just remain range-bound, likely between $203 and $222, before breaking out at a later date.
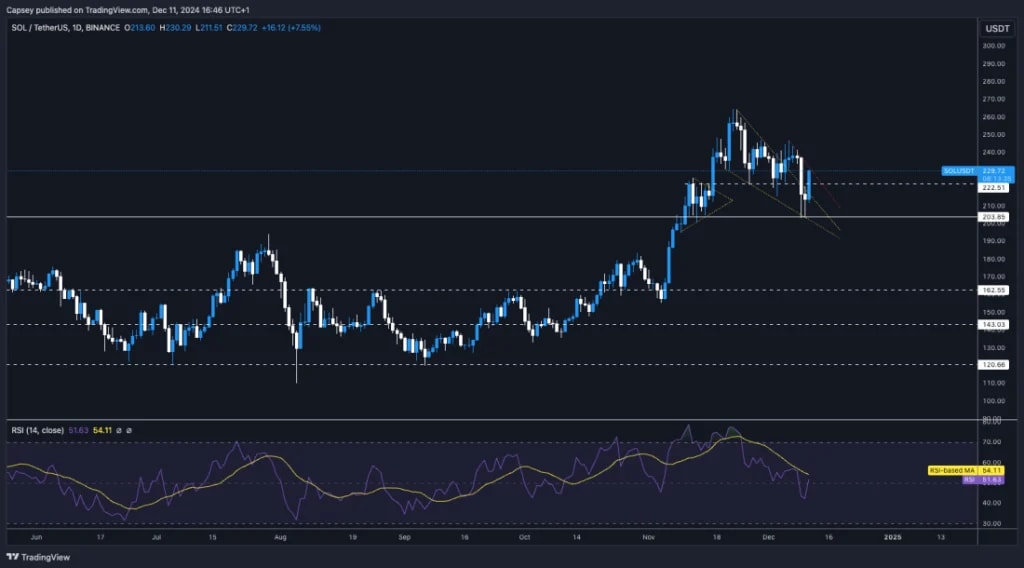
SOL struggles near $222 resistance
11 December 2024
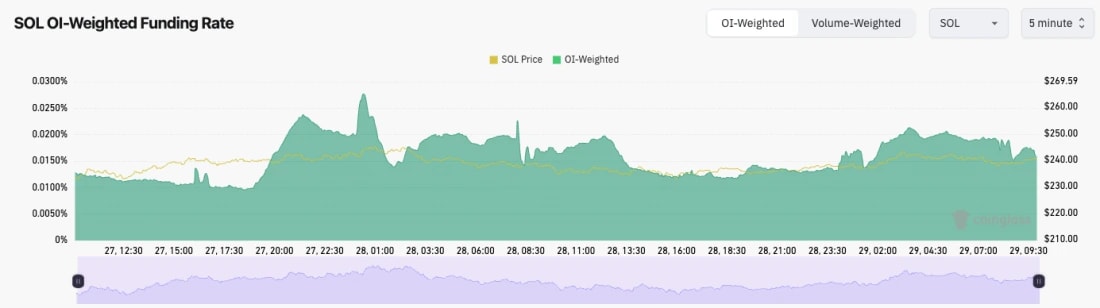
SOL stabilizes after a 12% open interest drop and funding rate reset. Support holds at $203, while resistance at $222 challenges recovery efforts. Let’s explore the latest technical setups and price action.
SOL's Open Interest has pulled back by 12%, so we have seen a deleveraging here, which is good.
SOL's funding rate has reset substantially, having been at 0.07% 5-6 days ago, and is now back to a healthy level of 0.01%. This indicates that over-levered Longs have been flushed or closed out.
SOL's funding rate:
Technical analysis
SOL attempted a breakout of its descending wedge, and unfortunately, the leverage flush outcome and the price swiped down to the major support of $203.
The price bounced at $203, and it is now trying to reclaim back above the local horizontal level of $222. However, it is also meeting the underside of a local downtrend line.
The RSI has also pulled back substantially, and it's in the middle territory, but it does remain beneath its moving average. We'd be looking for it to flip that and turn the MA into support.
Next Support: $200
Next Resistance: $250 - $260
Direction: Neutral
Upside Target: $300 (then $330)
Downside Target: $200
Cryptonary's take
It's possible that the price is rejected at these local levels here and retests the $210 to $220 area. But, if the price does retest this area, we'd expect it to be bid up quite heavily. We believe it's only a matter of time before SOL breaks out of these local downtrends, flips the $250-$260 level, and $300 to $330 is achieved relatively swiftly.
We're not sure when that might be, and we're expecting more chop in the coming days/week. But, we're holding all SOL and we're looking to sell it at prices much higher than current prices.
$220-$260 range critical for SOL
06 December 2024
Solana ($SOL) held strong at $220 support after a minor flush-out. Bulls now target $260 resistance, with $300 on the horizon as market sentiment improves.
SOL was much less affected by yesterday's leverage flush out, seeing Open Interest only fall by approximately 5%.
The Funding Rate did pull back more significantly, though, from 0.07% to 0.02%. So some late Longs were flushed out/closed out; it just wasn't a violent move.
SOL funding rate:
Technical analysis
SOL has attempted a breakout from the descending wedge. However, the price has been rejected to the $ 240s for now.
Price has remained above the key horizontal support of $220, having also used it and bounced from it a number of times already.
If the price were to fall below $220, we'd expect aggressive bids to step in between $200 to $220.
To the upside, $250 to $260 remains the key resistance zone for the price to overcome.
The RSI is down to middle territory at 53, so there is a lot of possible upside to be had.
Next Support: $220
Next Resistance: $260
Direction: Neutral/Bullish
Upside Target: $260 (then $300)
Downside Target: $210 - $220
Cryptonary's take
Overall, SOL looks good here, and despite the price recently rejecting into the $250 area, we do expect it's just a matter of time until the price breaks out of its all-time highs and heads to $300.
For now, we remain in Spot as we think there may be a few more days of range-bound action as the market shakes off yesterday's flush out. We do expect that SOL could break down all-time highs, potentially as soon as within the next 7-10 days.
SOL wedges between $250-$260 levels
04 December 2024
Solana ($SOL) showcases bullish momentum as Open Interest jumps 20% and funding rates approach 0.06%. Key support at $220 remains intact, with technical analysis hinting at a breakout to $290-$300 in the coming weeks.
SOL's Open Interest has increased by north of 20% over the last 3-5 days.
SOL's Funding Rate is also at high levels, close to 0.06%. This means there's a strong bias amongst traders to be Long here, and with Open Interest where it is, SOL is becoming more vulnerable to a potential flush-out.
Price can perform with Funding Rates at these levels, but it would be a warning sign to us if Funding Rates spiked much further from here.
SOL's open interest (by number of SOL):
Technical analysis
From a TA perspective, SOL is showing a different story - a bullish setup.
SOL is currently forming a descending wedge that would have a break-out target to the upside, with a target of $290 - $300.
The price is also nicely above major horizontal support at $220, with a large support range beneath that, which is down to $200.
On the upside, $250 to $260 remains the price resistance zone.
Another positive point with regards to SOL's price pulling back from the highs here is that the RSI has pulled back substantially and is now in the middle territory, nowhere near being overbought.
Next Support: $220
Next Resistance: $260
Direction: Bullish
Upside Target: $260
Downside Target: $220
Cryptonary's take
From a mechanics perspective, SOL does look overheated here. But the TA setup is great/bullish, and the narrative and momentum continue to be positive.
We expect SOL to hold above $220, but if there is a drop below, we expect it to be aggressively bought up, especially if this kind of move sees small leverage flush out. We're looking for SOL to move higher in the coming week/weeks, although in the immediate term, we're expecting more range-bound price action.
SOL tests $220 key support
29 November 2024
Solana ($SOL) consolidates between $220 support and $260 resistance. Open interest declines slightly while RSI resets, hinting at a potential bullish breakout soon.
Disclaimer: This is not financial or investment advice. You are responsible for any capital-related decisions you make, and only you are accountable for the results.
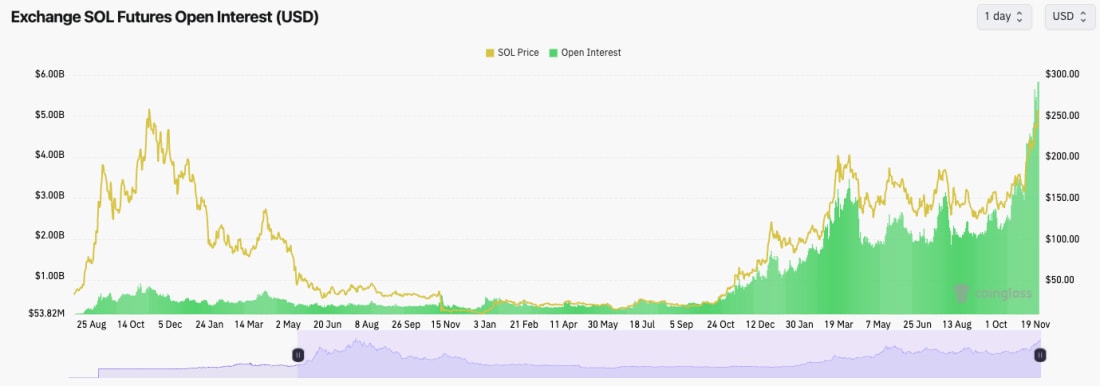
SOL's Open Interest is down slightly from the highs, indicating that some leverage was flushed out on the pullback to $220.
SOL's Funding Rate is positive, but it isn't elevated at just 0.0158%. This indicates that positioning is tilted Long, but it's close in balance between Longs and Shorts.
SOL funding rate:
Technical analysis
We're looking at this chart from a zoomed-out perspective, but we remain on the daily timeframes.
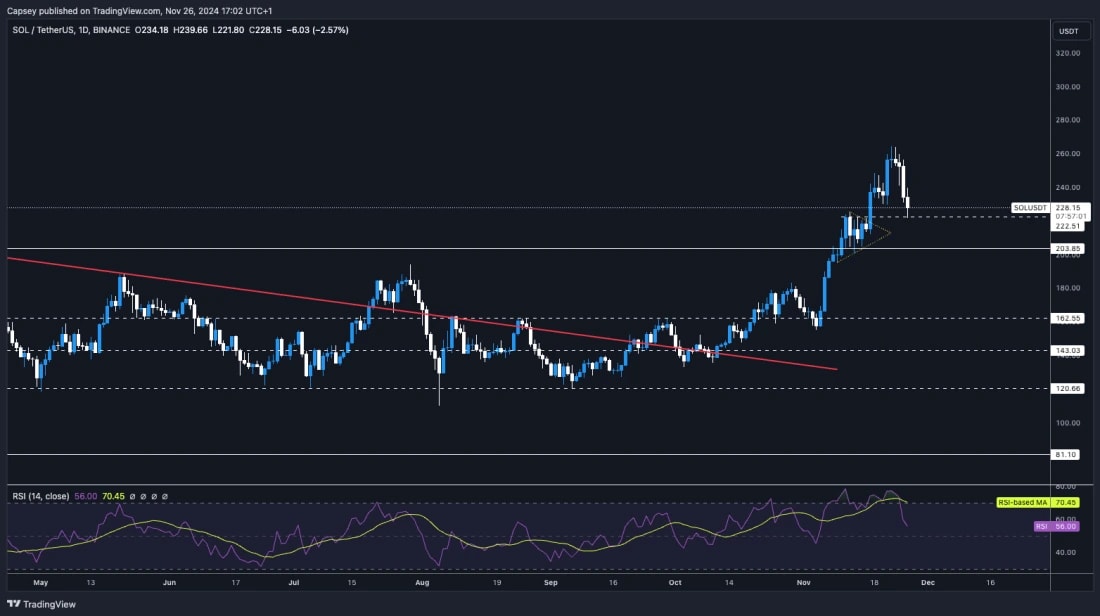
SOL moved into its all-time highs at $260, rejected, and pulled back to the prior horizontal resistance, now turning new support at $220.
SOL was able to bounce well at $220, with this pullback to $220 really resetting the RSI, now being significantly below overbought territory.
We expect the $210 to $220 area to act as strong support for SOL in the short term.
To the upside, the main horizontal resistance is the prior all-time high, $260.
Next Support: $220
Next Resistance: $260
Direction: Neutral/Bullish
Upside Target: $260
Downside Target: $220
Stay updated onSolana price prediction—explore our full analysis for the latest market insights.
Cryptonary's take
SOL still looks really strong here. We're expecting a period of consolidation, similar to BTC, and we believe we're currently in that. We expect that the price will just be range-bound between $220 and $260 for the next week before eventually breaking out to the upside again.
SOL holds support at $220 zone
26 November 2024
SOL leads the pack with a solid reset above $220, while BTC and ETH test critical supports. Funding rates hint at stability across crypto majors as markets prepare for the next move. Let’s dive in.
Disclaimer: This is not financial or investment advice. You are responsible for any capital-related decisions you make, and only you are accountable for the results.
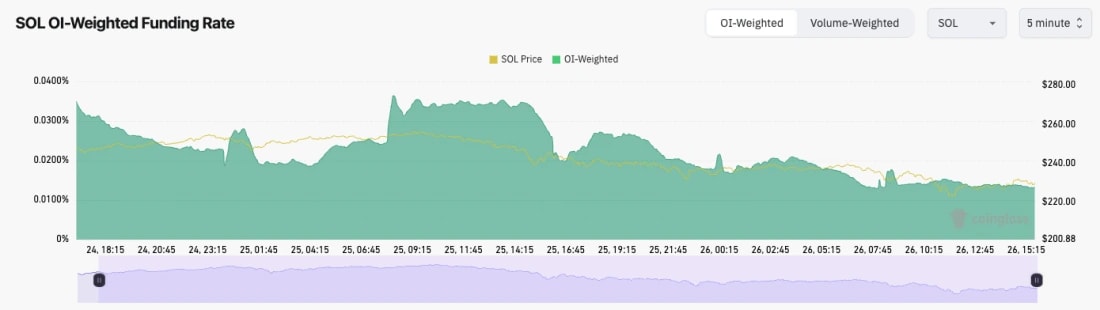
Like BTC and ETH, SOL's Open Interest is also very high despite its recent shallow pullback from the highs.
The Funding Rate is interesting. It has more meaningfully reset and is back close to the 0.01% level, indicating even positioning. Longs are not getting overly aggressive here.
SOL has a much healthier leverage setup than BTC and ETH.
SOL's funding rate (5min timeframe):
Technical analysis
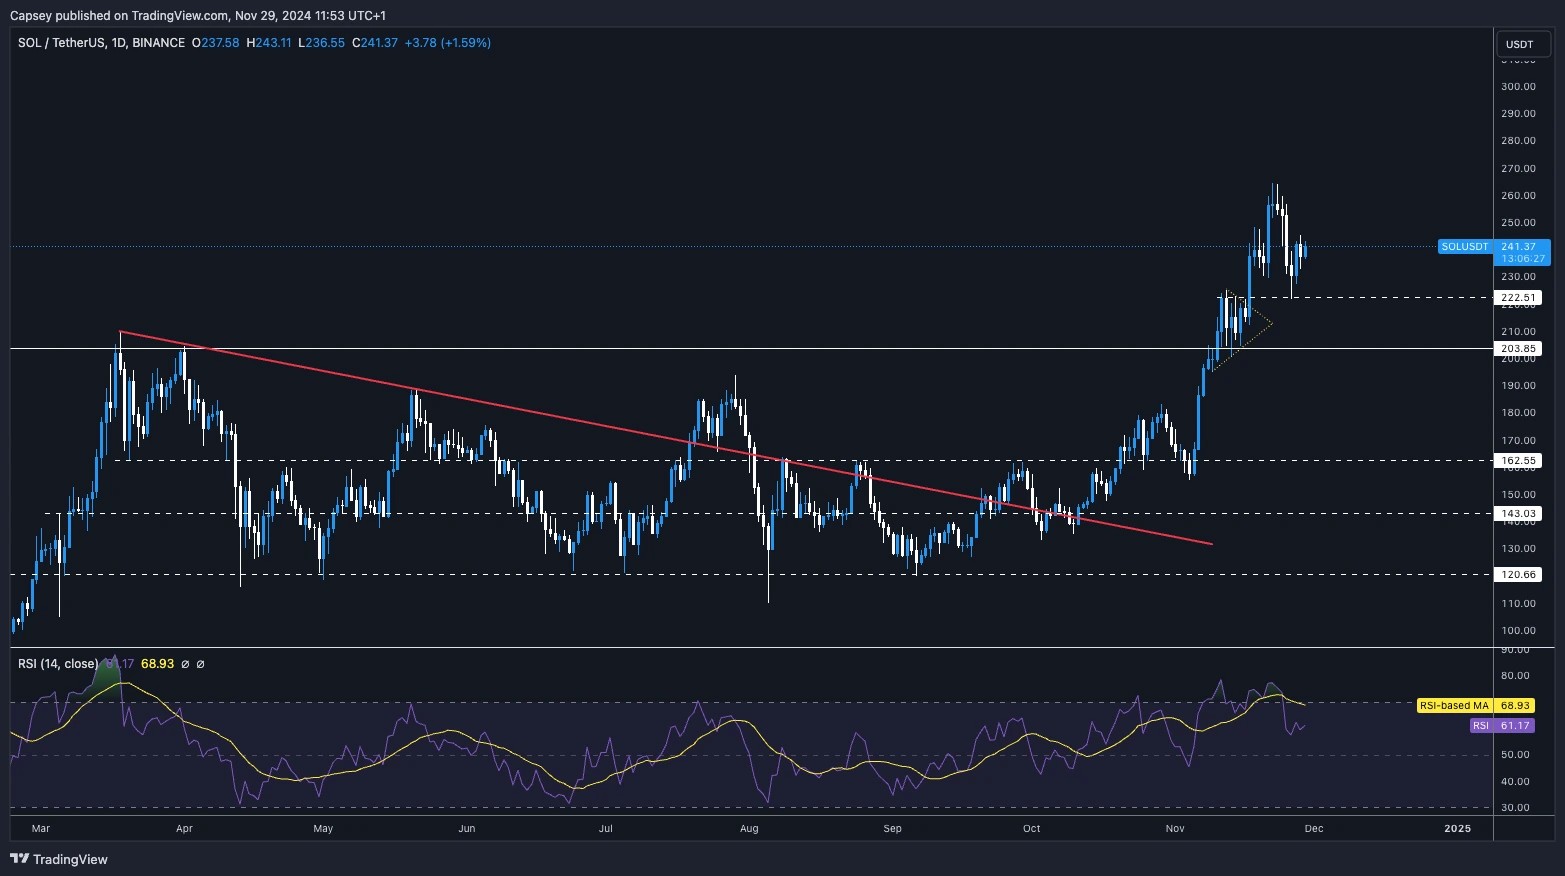
SOL was initially rejected from the prior all-time high of $260. This is the new major resistance.
The price has pulled back, and it's using the prior local resistance of $220 as new local support.
We expect the zone between $203 and $220 to be significant support, and we don't expect SOL to break below this support zone.
SOL has pulled back substantially from overbought territory, having been at 77 on the RSI. It's now at 55, which is a significant pullback and a really clean resetting.
Next Support: $220
Next Resistance: $260
Direction: Neutral/Bullish
Upside Target: $260
Downside Target: $200
Stay updated onSolana price prediction—explore our full analysis for the latest market insights.
Cryptonary's take
SOL looks like the best setup out of the majors (BTC, ETH, and SOL). It's had a reasonable pullback where the price is now sat on top of a major support zone, and the overbought indicators have also reset substantially. A really nice natural pullback within a larger uptrend.
We expect SOL to consolidate on top of/or in and around $220 before moving back up in the coming weeks. We're not looking to sell any Spot SOL anytime soon; we think SOL looks very positive here, even if there is a consolidation in the short term.
SOL targets $300 amid bullish momentum
22 November 2024
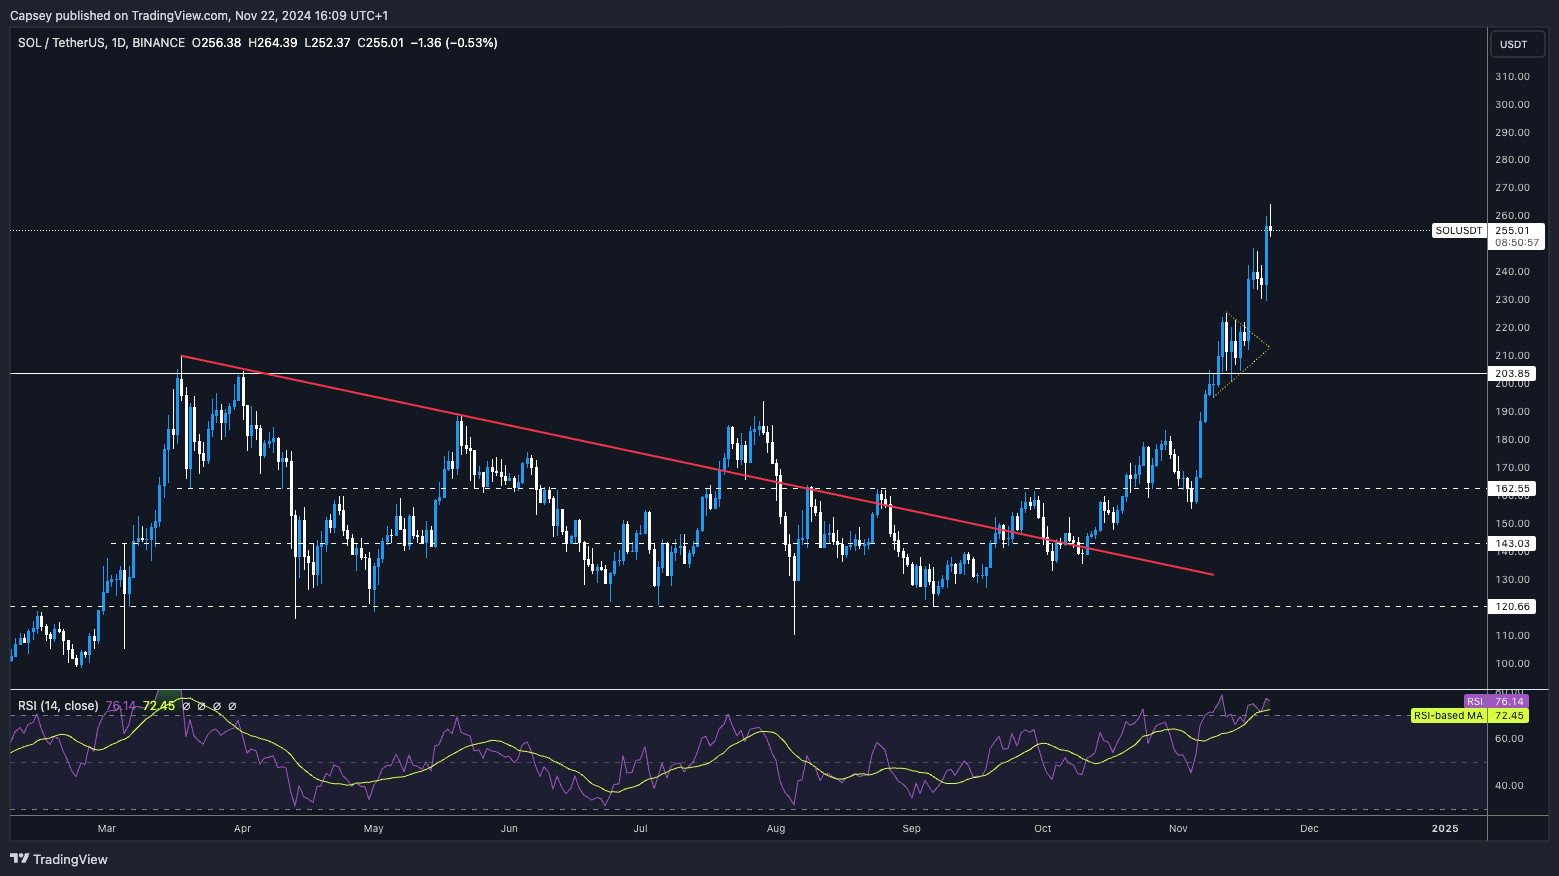
Solana ($SOL) breaks higher, nearing $260 resistance. As open interest soars, can it sustain support at $220-$230? Let’s analyze its bullish setup.
Disclaimer: This is not financial or investment advice. You are responsible for any capital-related decisions you make, and only you are accountable for the results.
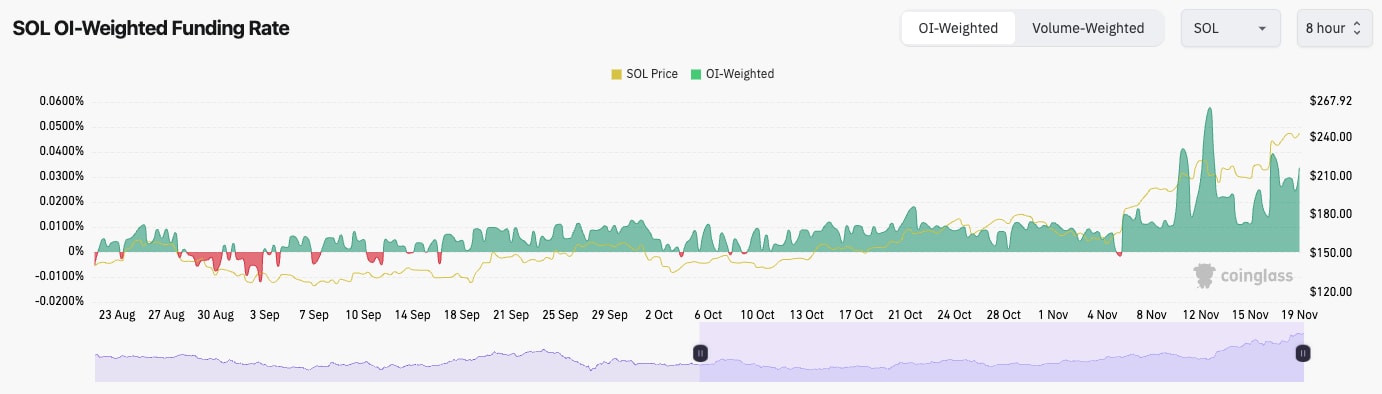
SOL's Open Interest is at all-time highs on both USD value and the number of coins. There is a lot of leverage built up here.
SOL's Funding Rate has also kicked up again over the last 24 hours. This indicates that there is a bias to be Long, with Longs being over-levered here.
SOL open interest:
Technical analysis
SOL broke out perfectly from the bull pennant, having used the $203 horizontal support as a floor to go higher.
SOL initially printed a bearish divergence; however, that has now been invalidated. But, the RSI remains in very overbought territory.
We would expect the area between $220 and $230 to act as a new support zone for the price, assuming there is a pullback.
Resistance is likely to remain at an all-time high between $255 and $260.
Stay updated onSolana price prediction—explore our full analysis for the latest market insights.
Next Support: $220 - $230
Next Resistance: $260
Direction: Neutral
Upside Target: $300
Downside Target: $220 - $230
Cryptonary's take
Overall, the move-up is really nice, and we do expect it to continue over the coming weeks/months. However, in the short term, the market is overbought, and therefore, we are potentially expecting a pullback. And for SOL, that might look something like the $220 - $230 area. But, even if we're right in calling for a short-term pullback, we wouldn't be looking to sell here. Our SOL sell targets are much higher. Let's get SOL to $400, and then we'll reassess the sell targets. For now, we're expecting the zoomed-out uptrend to continue.
Solana rises 52% in two weeks
19 November 2024
SOL's Open Interest is also at record highs in USD value. This is mostly due to the rising price of SOL; however, open interest by the number of coins is also at highs.
SOL's Funding Rate is also kicking higher. It's not quite as overheated as it was a week ago, but it's up, and it's moving in that direction. If this increases more substantially, then it's possible we will see a leverage flush out.
SOL funding rate:
Technical analysis
As we expected and called for the bullish pennant to use the horizontal support of $103 to bounce from, the price broke out of the pennant to the upside.
Price has now increased by 52% in just less than 2 weeks. This is a large move in a short period of time.
Price is currently quite overheated, and we can see this in the RSI, which has put in a bearish divergence (higher high in price, lower high on the oscillator) in overbought territory.
The area between $245 and $260 is a resistance area for price.
If there is a price pullback, we'd expect $203 to $220 to act as a major support zone.
Next Support: $220
Next Resistance: $260
Direction: Neutral/Bearish
Upside Target: $260
Downside Target: $220
Cryptonary's take
Price has made a mega move over recent weeks, and indicators are overheated here, so we wouldn't be surprised to see a pullback because of this. However, because the market is in a bull phase, we wouldn't look to sell our SOL here, even with the intention of buying back cheaper. It's very possible the market will continue to rip despite these overextended conditions. Therefore, we remain in all Spot positions.
Solana eyes $255 after RSI reset
15 November 2024
Solana ($SOL) is forming a bullish pennant above $203 support, with resistance at $220. If the pattern holds, $SOL could target its previous high of $255.
Disclaimer: This is not financial or investment advice. You are responsible for any capital-related decisions you make, and only you are accountable for the results.
SOL's Open Interest is at record highs in USD value, and it's at cycle highs measured by coins (this excludes when SOL was sub $20, as the coin was so much cheaper, so less money was needed to take on more leverage, measured by coins).
SOL's funding rate has reset substantially, and it's now back to normal levels. A 10% price pull-down has flushed out some of the over-levered Longs.
SOL funding rate:
Technical analysis
SOL is forming a bullish pennant above the prior horizontal resistance, which is now acting as new support ($203).
The RSI has also pulled back from overbought territory; although it still remains quite high, it is now finding support on top of its moving average.
If the $203 horizontal support is lost, we'd expect the $185 to $190 to be the next major level of support, and we'd be extremely surprised if the price fell below this level.
On the upside, the resistances are at $220, and then the prior cycle's all-time high is $255.
Next Support: $203
Next Resistance: $220
Direction: Bullish
Upside Target: $255
Downside Target: $185 - $190
Cryptonary's take
SOL looks to be one of the better charts here. It's holding above key horizontal support for now, and it has built some support above that level ($203). Price is also in the formation of a bullish pennant, which has a bias to break to the upside. Meanwhile, the indicators that were overbought have been more meaningfully reset. If BTC doesn't get a more meaningful pullback and it can maintain its current level, SOL is potentially set up here to break out to the upside and run to the prior cycle's highs ($255). Let's see what the coming days give us.
Solana support holds strong at $203
12 November 2024
SOL's Open Interest, by a number of coins, is at a new cycle high.
SOL's funding rate is 0.07% or 76% annually. This is very high. It can go higher, but this is very high.
Like BTC and ETH, we would expect a leverage flush out for SOL here. This doesn't mean the price will collapse, but a 10% pullback from the highs is possible.
SOL's funding rate:
Technical analysis
A huge move up that's seen SOL breakout above its major resistance at $203$205.
Price became very overbought and has now pulled back slightly. What's really positive is that price is pulling back to $203 and now using that area as new support. Resistance flipped into new support.
To the upside, the horizontal resistance is at $220 and then the all-time high of $255.
On the downside, we would expect $190 to $205 to be a good area of support if there is a more meaningful price pullback.
The RSI was overbought, but it has now been pulled back. If the price consolidates for a period of time (say a week), this will reset the RSI without the price needing to have a major pullback to reset it.
Next Support: $190 to $203
Next Resistance: $220
Direction: Bullish
Upside Target: $220 (and then $255)
Downside Target: $190
Cryptonary's take
SOL looks good here, having broken out of all the major horizontal resistances and now potentially pulling back and using the $203 horizontal resistance as new support. We expect price to remain range-bound at these higher price levels for at least a few days. But, this would be positive in our view as it would likely help to reset some of the indicators, and therefore allow the next leg higher. $190 to $205 should be a strong support zone.
SOL targeting a $205 breakout soon
7 November 2024
As SOL approaches a potential $205 breakout, open interest and funding rates point to bullish sentiment. Dive into key levels for SOL.
SOL's Open Interest (by number of coins) has spiked to a new yearly high following the Trump win.
Funding Rate-wise, SOLs are similar to ETHs. 0.01% on major, more liquid exchanges, but
Funding has moved more meaningfully positively on the less liquid exchanges. This can go further, but it'll likely need a small flush out at some point. But this wouldn't worry us in terms of a meaningful price drawdown. We'll hold through any volatility.
SOL's open interest:
Technical analysis
Following the breakdown of the local uptrend line, SOL found some support just below the local support of $162, and it was able to put in a much stronger bounce following the Trump win.
We identified previously that the $180 to $190 area is likely to act as a resistance box for price in the short-term. That's now what we're seeing, but, we emphasise, in the very short-term.
It's possible that the price will now pull back a tad and use the $180 level as new support.
A clean breakout above $205, and SOL will just send. That's the key level to watch.
Another positive is that SOL has also reclaimed the local uptrend.
Like ETH, SOL's RSI is approaching overbought territory, but it isn't there yet. More room to head higher for price here.
Next Support: $180
Next Resistance: $190
Direction: Neutral/Bullish
Upside Target: $190 (to $205 upon breakout)
Downside Target: $180
Cryptonary's take
It's possible that the price will remain in a tight range for a few days (between $180 and $190). However, we're expecting price to breakout in the coming 12 weeks and to test the $200 level. Whilst we're not sure we'll get an immediate breakout above $200, we do believe it's eventually inevitable. We remain super constructive and bullish on the market here, with SOL being one of our core positions.
SOL range between $143 and $162
04 November 2024
Solana’s price action is holding near key support at $160, with the market waiting on election results. Will a favourable outcome push SOL back to $180, or could we see a breakdown? Let’s explore SOL’s potential moves.
SOL's Open Interest remains elevated despite the more than 10% price pullback.
SOL's funding rate is also at 0.007%, indicating that there is some short interest despite the bias still being mostly long.
SOL's open interest:
Technical analysis
SOL moved into its higher price range (between $180 and $190) and swiftly rejected from that level as profit-taking began on "Trump trade" assets.
Price has since pulled back, having broken below the local uptrend line, and now testing the horizontal area of $162.
So far, the low $ 160 has acted as support. If that area cannot hold, then the price will be back into its old range (between $143 and $162).
A break below $160 and a Harris win could see the price retest the next two horizontal supports at $143 and then potentially as low as $131.
To the upside, $162 is the level to reclaim, and beyond that $180. Very likely we see $180 tagged if Trump wins.
The pullback from the $180's has more meaningfully reset the RSI which had put in a bearish divergence at the highs. The RSI has now pulled back to the middle territory of 47.
Next Support: $143
Next Resistance: $162
Direction: Neutral
Upside Target: $162
Downside Target: $143
Cryptonary's take
We currently look at SOL as just playing between the ranges, with the wider range between $131 and $180 and $143 to $162 as the tighter range for price. The coming day's price action very likely depends on the election outcome. A Trump win likely sends the price to the top of the range, and a Harris win is the opposite. Ultimately, if it is a Trump win, then $160 for SOL will look cheap a month from now. It's hard to call here; it comes down to Tuesday/Wednesday's Election.
Solana’s next move: $162 or $190?
28 October 2024
Solana (SOL) is testing $178 resistance after bouncing off $162 support. Can SOL continue its uptrend to $190, or will it face a pullback?
SOL's Open Interest (by number of coins) has really climbed higher over the last 10 days, suggesting more leverage has been being put on here.
Interestingly, SOL's Funding Rate is flat, close to 0.00%. This indicates that some of the leverage that has gone on is Shorts and that there is a relatively even balance between Longs and Shorts.
SOL open interest:
Technical analysis
So far, a really clean move, where price broke out of the $162 horizontal resistance, pulled back, tested it as new support and bounced higher from that level. Good to see.
The price is now $178 as local resistance.
Beyond $178, $185 to $190 will likely act as a strong resistance zone for SOL.
In terms of support, $162 should be a local support, with $150 as a stronger support.
Price is in a local uptrend so we wouldn't be surprised to see this broken and price potentially retest $162.
Next Support: $162
Next Resistance: $190
Direction: Neutral/Bullish
Upside Target: $186 - $190
Downside Target: $162
Cryptonary's take
Price has quietly risen without gaining much attention or euphoria regarding the timelines. We see this as very positive, and likely the case is that we see the euphoria come back only upon a breakout of $190, possibly $200, as that'll be a psychological zone. This price grind higher has also probably been positive for the SOL ecosystem as we continue to see memes do well. In the coming days, we wouldn't be surprised to see $162 be retested again; however, we do see the inevitable direction as a move back up to $186-$190, so we're unsure if we'll even see $162 retested in the short-term here.
Solana consolidates above $162 support, eyeing $190 resistance. Will it rally further or pull back? Explore today’s SOL forecast and analysis.
Disclaimer: This is not financial or investment advice. You are responsible for any capital-related decisions you make, and only you are accountable for the results.
SOL's Open Interest (measured by number of coins rather than USD value) is now well above the highs we saw back in March as SOL hit this cycle's price high.
SOL's funding rate is positive and currently at 0.01%; however, it is quite a bit high on fewer liquid exchanges. This suggests that there is a bias beginning to build up in Longing SOL.
SOL's open interest:
Technical analysis
A really nice move, and what we've waited the last few months for; a break out of the range.
Price has now broken above the key horizontal resistance of $162, having rejected there a number of times since early August.
Price has also pulled back slightly and retested $162 as new support, and so far, price is beginning to propel higher from that level; a good sign.
To the upside, $190 is the next major horizontal resistance.
On the downside, it's important we continue to see $162 act as new support. Beneath that, we'd expect $155 to provide ample support, although the main level is $143.
We do note that the RSI is close to overbought, so it's possible that the price will consolidate above $162 for a few more days before potentially pushing for a further move.
Next Support: $162
Next Resistance: $190
Direction: Bullish
Upside Target: $190
Downside Target: $155
Cryptonary's take
Patience has paid off on this so far. We finally have a break out of the range, and it's on the upside (as we expected), above $162. It's possible that we will see some consolidation in the immediate term, but we do expect the price to grind higher and get to $190 in the coming weeks. Yes, even with the tricky situation of trading around this election. We remain confident in Spot positions, and we'd look to add between $131 and $150, although we don't feel confident on price visiting those levels in the short or even medium term.
Can Solana reach the $190 target?
18 October 2024
Solana tests $162 resistance today. Can SOL break out and rally to $190, or will it retest support at $143 and $131? Explore today’s analysis.
Disclaimer: This is not financial or investment advice. You are responsible for any capital-related decisions you make, and only you are accountable for the results.
SOL is interesting from a mechanics viewpoint here.
Open Interest fell significantly a month ago and has remained relatively flat since (not much new leverage is being put on here).
Funding rates have increased but aren't meaningfully positive, whilst Spot CVD has trended lower and has remained flat since.
There isn't huge interest from buyers in SOL currently. Perhaps we see this change on SOL convincingly breaking above key resistance levels.
SOL mechanics:
Technical analysis
SOL is now in the upper range of its larger price range between the lows at $131 and the highs/resistance at $162. The $143 should act as a middle level/support for SOL on the local timeframes.
The horizontal resistance is $162. A breakout of this level might see more volume come into SOL, and you could see a swift move up, potentially testing $190.
To the downside, we expect the support range between $120 and $131 to act as major support for the price.
The RSI is back in the middle territory and has somewhat just been sitting there for quite some time now.
Next Support: $143
Next Resistance: $162
Direction: Neutral
Upside Target: $162 ($190 upon breakout)
Downside Target: $131
Cryptonary's take
SOL remains super boring here, to be honest, as it is still range-bound between $131 and $162. However, a break out of the range could be quite volatile as it would likely see volume come in and chase the move higher (assuming it is higher, which we believe it will be). Our expectation is that we will probably just continue to chop over the next 3-7 days. A break out beyond $162 would be the signal to get super bullish again. Until that happens, we will sit tight and remain patient in our Spot bags.
SOL dominance nears 3.66%: Will It hit 4% soon?
18 October 2024
Solana dominance consolidates above 3%. A breakout past 3.66% could push it to 4%, signaling major growth. See what levels to watch next.
Disclaimer: This is not financial or investment advice. You are responsible for any capital-related decisions you make, and only you are accountable for the results.
Solana is quietly capturing more market share. SOL dominance has been steadily climbing, consolidating just above the 200 EMA at 3.03%. Price is currently at 3.18%, and all signs point to Solana continuing to grow its market share as we head deeper into the bull cycle.
Support: The 200 EMA, around 3%, has been acting as a solid base, keeping Solana's dominance in a bullish structure.
Resistance: Solana is eyeing the 3.66% resistance, and a break above this level could lead to a significant increase in dominance, possibly reaching 4% in the coming months.
Potential scenario: With Solana consolidating just above its support, it's only a matter of time before we see another breakout. Once SOL dominance breaks through 3.66%, expect a major push towards 4%, solidifying Solana's role as a market leader.
Conclusion
Solana's dominance is quietly but steadily growing. With strong support in place, the next breakout could see Solana capture even more market share, potentially reaching 4% in the near future.
Cryptonary's take
The market is coiling up, and the tension is palpable. Both Bitcoin and the Total Market Cap are testing critical levels, and it's becoming clear that the next big move is around the corner. Bitcoin dominance is nearing its peak, but the real story lies in the altcoins-especially Ethereum and Solana. While we expect Solana to outperform Ethereum during this cycle due to its fast-growing ecosystem and aggressive market positioning, Ethereum is still a crucial long-term player. ETH remains undervalued at current prices, offering a discounted entry point for investors looking for solid returns over multiple cycles. With increasing institutional adoption and a dominant presence in decentralised finance (DeFi), Ethereum is here for the long run, making it an excellent bet for those thinking beyond this cycle. This is the moment when the bulls need to step up. A breakout in the Total Market Cap above 2.29 trillion could be the signal for the next explosive rally, and when that happens, Ethereum and Solana will be front and centre. Position yourself accordingly: Solana is set to lead this cycle, but don't sleep on Ethereum's long-term value. Get ready. The market is poised for something big, and when the dust settles, the majors will have paved the way for what could be the most exciting leg of this bull run yet.
SOL tests $143 support with a $162 breakout in focus
14 October 2024
Solana price tests $143 support while targeting $162 resistance. Can SOL break higher or stay range-bound? See today’s analysis and predictions.
Disclaimer: This is not financial or investment advice. You are responsible for any capital-related decisions you make, and only you are accountable for the results.
SOL's Open Interest has increased slightly, whilst Funding Rates have decreased slightly.
The price has likely moved higher due to a small spot bid, as shown in the slightly increasing CVD.
Ultimately, from a mechanics viewpoint, there are some slight changes here but not enough that they should be market-moving.
SOL mechanics:
Technical analysis
Price has recovered back above the main downtrend line and it has now also more convincingly broken above the horizontal level of $143.
On the upside, $162 remains the key horizontal resistance from which the price can break out. A breakout of $162 would most likely ignite full bull mode.
To the downside, there are a lot of supports, with the local horizontal support at $143 and the main support at $131.
SOL's RSI expectedly remains in the middle territory and not yet close to overbought territory.
Next Support: $143
Next Resistance: $162
Direction: Neutral/Bullish
Upside Target: $162
Downside Target: $143
Cryptonary's take
It's possible that SOL can continue to grind higher over the coming days and retest $162. However, we're unsure that there will be enough strength in the short-term for price to comfortably clear above $162. We therefore expect price to be range bound between $143 and $162 this week. More of the same really.
Will Solana break $162 or stay neutral?
11 October 2024
SOL's Open Interest is back close to its highs, having spiked higher again over the last few days.
Alongside this, the Funding Rate is currently negative, although it has flip-flopped from positive to negative a lot over the past few days. This indicates indecision amongst traders.
Disclaimer: This is not financial or investment advice. You are responsible for any capital-related decisions you make, and only you are accountable for the results. "One Glance" by Cryptonary sometimes uses the RR trading tool to help you quickly understand our analysis. These are not signals, and they are not financial advice.
SOL's OI-Weighted funding rate:
Technical analysis
And we continue with the range-bound price action, with $143 acting as a local horizontal level acting as both local support and local resistance.
To the upside, the main resistance is at $162.
On the downside, the main support is the zone between $120 and $131. We expect this area to continue to act as support.
The RSI is in the middle territory but is now running under the Moving Average.
Next Support: $131
Next Resistance: $162
Direction: Grind Higher/Neutral
Upside Target: $162
Downside Target: $131
Cryptonary's take
Very boring price action from SOL, and to be honest, probably up until the election, we're expecting more continuation of this boring range-bound price action. However, this does give room for memes to garner attention in the shorter term. Over the weekend, we might see a slight pop higher from SOL, potentially even close to retesting $162, however we're not sure we'll see a further bullish breakout of $162 just yet.
Solana consolidates as market awaits key breakout
07 October 2024
SOL’s price stays in a tight range between $143 and $162. A move above $162 could lead to a bullish run. Will SOL push higher soon?
As the price increased to $160, Open Interest increased considerably as Funding increased. But, this wasn't followed by a Spot bid, which led to an over 20% decrease in OI as late Longs were flushed out.
SOL mechanics:
Technical analysis
SOL is still in its range between $120/$131 support to $162 resistance.
However, SOL is now back above its main downtrend line and above the local horizontal resistance of $143.
To the upside, the local resistance is $162, and the more major resistance is $185.
The RSI is similar to BTC and ETH's, back in middle territory but beneath its Moving Average.
Next few days prediction: Neutral ($137 to $162)
Next 7 days prediction: Bullish
Next 7 days price target: $162
Cryptonary's take
In all fairness, SOL itself has been quite boring recently, yet the ecosystem continues to see great gains, particularly in the Meme space. Our expectation is that over the coming days and weeks, SOL might remain range-bound, but we expect once SOL breaks out of $162, that'll be the bullish reversal that'll send the price back to $200. We're expecting further chop over the coming days, but in this higher range, between $143 and $162. If the Inflation data is positive, that might be enough to see SOL breakout of $162, but we'd at least a retest of $162 on positive Inflation data.
Can Solana hold $143 support?
02 October 2024
SOL's open interest declined as the price pulled back, finding support at $143 with $162 resistance.
Disclaimer: This is not financial or investment advice. You are responsible for any capital-related decisions you make, and only you are accountable for the results.
This indicates that the move lower was driven by Spot selling and Perp Longs closing out.
SOL mechanics:
Technical analysis
SOL rejected just shy of the major horizontal resistance at $162 and has since pulled back.
Price has now found support on top of the main downtrend line. It's a positive sign that the price will break out of a downtrend line and then pull back to retest that downtrend line as new support. This is known as a 'bump and run' pattern.
On this price pullback, the RSI has also reset back to middle territory.
The horizontal level of $143 we have just added in. This is potentially a local support for price.
To the upside, $162 remains the key level to break above.
Cryptonary's take
Ultimately, SOL is still in a larger range between $120 and $162. We remain really constructive on SOL and the whole SOL eco-system, but we do not expect fireworks until there is a breakout above $162, although we think it could be on the near term horizon. In the coming days, we expect price to be subdued and compressed in a tight range until Friday's labour market data. Upon that data might we get a more volatile move, and possibly to the upside as we expect the data to be positive.
SOL gains momentum, resistance ahead
01 October 2024
SOL’s open interest is rising as prices approach the $162 resistance, indicating uncertainty among traders, with a potential breakout looming.
SOL's Open Interest has been increasing over the last two weeks whilst Funding Rates have flip-flopped between positive and negative. This indicates that traders have been unsure and tried to Short as prices have gone higher.
Disclaimer: This is not financial or investment advice. You are responsible for any capital-related decisions you make, and only you are accountable for the results.
SOL's open interest:
Technical analysis
A really clean breakout of the local downtrend fuelled a move higher, enabling the price to break out of the main downtrend line.
The price is now close to retesting the horizontal resistance of $162.
Price is approaching overbought territory, but it's possible there's more room left to run higher, particularly if the price can reclaim back above $162.
If the price were to pull back, we'd expect the zone between $140 and $150 to hold as support.
If the price can break out at $162, the next major horizontal level is $185.
Cryptonary's take
Price is moving up into a crucial level here to retest the underside of the horizontal resistance at $162. This might create a short-term stumbling block for the price, but we expect the price to potentially just consolidate between $150 and $160 in the immediate term, with a major breakout of $162 to come after. The breakout of the major downtrend line is bullish over the medium term, and with the macro setup at play, we're extremely bullish over the medium and long-term.
Can Solana reclaim above $162?
27 September 2024
SOL's Open Interest has been increasing over the last two weeks whilst Funding Rates have flip-flopped between positive and negative. This indicates that traders have been unsure and tried to Short as prices have gone higher.
Disclaimer: This is not financial or investment advice. You are responsible for any capital-related decisions you make, and only you are accountable for the results.
SOL's open interest:
Technical analysis
A really clean breakout of the local downtrend fuelled a move higher, enabling the price to break out of the main downtrend line.
The price is now close to retesting the horizontal resistance of $162.
Price is approaching overbought territory, but it's possible there's more room left to run higher, particularly if the price can reclaim back above $162.
If the price were to pull back, we'd expect the zone between $140 and $150 to hold as support.
If the price can break out at $162, the next major horizontal level is $185.
Cryptonary's take
Price is moving up into a crucial level here to retest the underside of the horizontal resistance at $162. This might create a short-term stumbling block for the price, but we expect the price to potentially just consolidate between $150 and $160 in the immediate term, with a major breakout of $162 to come after. The breakout of the major downtrend line is bullish over the medium term, and with the macro setup at play, we're extremely bullish over the medium and long-term.
Total market cap at $2.21T: Will Solana hit $256 soon?
26 September 2024
Current state: In the last report, we analysed the total market cap around the $2.01 trillion zone, predicting two potential scenarios: price either holding this support or a liquidation event. As anticipated, the market went through a strong liquidation event, breaking below the 0.5 fib zone and reaching the bottom of the channel. This shakeout was healthy for the market, removing leveraged positions and clearing the way for a fresh push.
Key observations
Support: The $1.9 trillion level, as expected, provided strong support and triggered a reversal. Buying pressure from this zone helped initiate a rally back toward the upper channel.
Current status: The total market cap now stands at $2.21 trillion. This represents a solid recovery and places the market in a strong position to push higher. If BTC breaks through the current supply zone, we can expect the overall market to rally towards the upper fib resistance levels.
Price projection: We anticipate the total market cap to grow to $3 trillion in the coming months, a 35% increase that would bring the market back to previous all-time highs. As BTC and major altcoins like Solana continue to strengthen, this target is well within reach.
Disclaimer: This is not financial or investment advice. You are responsible for any capital-related decisions you make, and only you are accountable for the results.
Solana's role in the market
At present, Solana holds a 3.23% dominance within the crypto market. With Solana's upward momentum continuing, we expect its dominance to reach 4% in the coming months, elevating its market capitalization to $140 billion. With a total supply considered, this would result in a price of approximately $256 per SOL.
Conclusion
The total market cap has moved back into a bullish structure, supported by strong buying pressure at key levels. With a target of $3 trillion on the horizon, Solana is positioned to play a key role in the market's growth. As BTC nears a crucial breakout point, the next leg of the bull market is shaping up to be one of the most significant yet.
SOL dominance update: Can Solana break the 3.66% barrier?
26 September 2024
Current state: SOL dominance continues its upward trend, making higher highs and higher lows. Solana has been steadily consolidating upwards, moving towards its next key resistance level. With the broader market nearing a turning point, SOL is positioned to capture an even larger share of the total crypto market.
Key observations
Support: The 200 EMA continues to act as a strong support on the downside, providing a solid base for Solana's growing dominance in the market. This level has been repeatedly tested and held, reinforcing Solana's bullish structure.
Resistance: SOL dominance is currently approaching the 3.66% resistance level, a key zone that could trigger a breakout if breached. With the market showing signs of strength, Solana is well-positioned to push through this level and continue its ascent.
Market dynamics: As Solana continues to outperform both BTC and ETH, its dominance within the crypto market is increasing. We anticipate that SOL dominance could reach 4% in the coming months as the bullish consolidation phase unfolds.
Conclusion
SOL dominance remains in a strong upward consolidation phase, with higher highs and higher lows driving the trend. The 3.66% resistance level is the next key target, and a breakout from this zone could see Solana dominate up to 4% of the total market cap. Solana's continued outperformance highlights its potential to lead the next phase of the market cycle.
Is $162 the next stop for SOL?
24 September 2024
Over the last week, SOL's Open Interest increased substantially (Longs piling in) before then dramatically declining (Longs closing out).
Disclaimer: This is not financial or investment advice. You are responsible for any capital-related decisions you make, and only you are accountable for the results.
SOL's OI and funding rate:
Technical analysis
SOL is currently battling and has been, for a few days now, at the main downtrend line.
Currently, the main downtrend line is proving to be resistance, although a breakout above it likely sends the price quickly to retest the main horizontal resistance at $162.
On the downside, the major support zone remains between $120 and $131. If the price pulls back to that level, we would expect this zone to hold.
Cryptonary's take
In the immediate term, SOL is battling at the main downtrend line, with a breakout potentially pushing SOL higher to retest $162. But, if we zoom out, SOL remains in the much wider range between $120 ($131) and $162. Until we see a clear breakdown or clear breakup, we're just sitting tight, with not much to get too excited about in the meantime. Holding Spot bags and exercising patience as we move into the US Elections and beyond, where we're expecting more significant outperformance.
Can SOL rise above $162 this week?
20 September 2024
SOL's Open Interest has increased substantially over the last 48 hours, whilst Funding is at 0.01%.
This indicates that a lot of late Longs have piled into SOL as price has moved higher over the last day or so. This likely results in a quick flush out to the downside wiping out some of these late Longs, before possibly reversing back up again.
SOL open interest:Note:the large increase (far right-hand side of the chart) in Open Interest.
Technical analysis
SOL has bounced from its support zone between $120 and $131 and has now pushed up to retest the underside of the main downtrend line.
Price initially cleared the $130 area due to the price being able to break out from the local downtrend line, which has helped fuel this 15% increase in price.
Price may stall at this local level in the immediate term, but we are expecting a further breakout in the coming week or two.
If the price does break out from the main downtrend line, the next major resistance will likely be the horizontal level at $162.
The RSI is still not near overbought territory, so it's possible that the price can run further after a short period of consolidation beneath the main uptrend line.
Cryptonary's take
In the immediate term, we're expecting the price to be rejected at the main downtrend line and consolidate for a few days beneath it. But, we then expect the price to break out and move higher. We do, however, think we'll see a small flush out of the late Longs that have piled on over the last few days, which may see the price revisit $139 before rebounding higher from there. What is Solana: Solana (SOL) is a high-performance blockchain designed for fast and scalable decentralized applications and cryptocurrencies. Launched by Solana Labs in 2017, Solana is celebrated for its ability to process thousands of transactions per second with low fees, making it a popular choice for developers and users alike. At Cryptonary, we are most bullish on Solana for this cycle, considering it the play of the cycle due to its robust technology and growing ecosystem.Solana's ATH is $260.How to buy SOL:
Via Phantom Wallet:
Deposit Solana tokens by copying your Phantom wallet address and transferring funds.
Use the ‘deposit’ button for other purchase options, though fees may be higher.
Swap tokens within the wallet by selecting the type and amount, setting slippage tolerance, and confirming the swap.
Navigate to the SOL trading section and complete your purchase.
Can SOL break $150 resistance now?
16 September 2024
SOL's Open Interest has increased over the last few days whilst it's Funding Rate has gone from more meaningfully negative to positive as this OI has increased.
This suggests that the leverage that has gone on in the last few days has been mostly Longs.
SOL's funding rate:
Since the start of September, SOL has stayed in a relatively tight range between $120 (the bottom of our called out range) and $140.
SOL is in a longer-term downtrend since March with price now squeezing up to it's local downtrend line.
We expect $120 to continue to act as support in the short-term.
To the upside, we expect $140 to $150 to continue to be a local resistance zone, with $162 the key level for price to break above, however we're not expecting this anytime soon.
Volumes have been downtrending recently.
Cryptonary's take
We expect price to breakout of the local downtrend line and at least retest $140 in the short-term assuming we're correct on J Powell delivering a dovish message this Wednesday. We're not confident that SOL can break back above $162 in the immediate term though, and we're expecting the $140 to $150 zone to be a new local resistance for price.
SOL faces key support at $120—Is a breakdown to $103 possible?
10 September 2024
SOL's Open Interest has increased in the last few days while the Funding Rate has flip-flopped between slightly positive and slightly negative.
There has been more willingness amongst traders to Long SOL in recent days.
SOL's Funding Rate:
Technical analysis
SOL is still in its major downtrend. However, it has continued to hold the horizontal support zone between $120 and $131.
SOL looks to be in a precarious position. It has retested the $120 to $131 region many times now while mostly putting in lower highs.
However, SOL has put in 3 bullish divergences (lower low in price, higher low on the oscillator) in a row. This should be enough for price to be able to reclaim above $131 and attempt a retest at $140.
If price does break down below $120, the next major support is at $103.
Cryptonary's take
Having retested the support many times, we would be wary of SOL in the near term for a potential breakdown. However, if the price were to drop below $120 and retest anywhere near $103, we would be strong bidders of SOL. But, we must consider that sentiment is currently very low, so it wouldn't be wise to turn bearish on SOL at the potential lows or close to them. Therefore, we advocate holding our SOL Spot bags and just adding to our bags if SOL dips to anywhere between $103 and $120. We still believe that we'll see SOL well above $500 in 2025.
Will SOL break $120 or retest $140?
9 September 2o24
SOL's Open Interest has increased in the last few days whilst the Funding Rate has flip-flopped between slightly positive and slightly negative.
There has been more of a willing amongst traders to Long SOL in recent days.
SOL's funding rate:Technical analysis:
SOL is still in it's major downtrend however it has continued to hold the horizontal support zone between $120 and $131.
SOL looks to be in a precarious position having retested the $120 to $131 region many times now, whilst mostly putting in lower highs.
SOL has however put in 3 bullish divergences (lower low in price, higher low on the oscillator) in a row. This should be enough for price to be able to reclaim above $131 and attempt a retest at $140.
If price does breakdown below $120, the next major support is at $103.
Cryptonary's take Having retested the support many times, we would be wary of SOL in the near term for a potential breakdown. However, if the price were to drop below $120 and retest anywhere near $103, we would be strong bidders of SOL. But, we must consider that sentiment is currently very low, so it wouldn't be wise to turn bearish on SOL at the potential lows, or close to them. Therefore, we advocate for holding our SOL Spot bags and just adding to our bags if SOL dips to anywhere between $103 and $120. We still believe that we'll see SOL well above $500 in 2025.
Fresh swing trade strategy on Solana
05 September 2024
Solana (SOL) presents a unique structure when compared to the broader crypto market. Unlike Bitcoin, Total 2, Total 3, or the overall market cap, which have all formed bull flags, Solana has been range-bound since its breakout in March. On the daily timeframe, SOL has established equal highs and lows, indicating a large range, while Bitcoin has formed lower lows and lower highs, creating a classic bull flag pattern. Given the lack of a major positive catalyst, we must respect Bitcoin's structure and apply similar rules to Solana, projecting potential downside. This approach will allow for a more calculated swing trade on SOL, considering the risk-to-reward (RR) ratio.
Disclaimer: This is not financial or investment advice. You are responsible for any capital-related decisions you make, and only you are accountable for the results.
The playbook
Here's to take the trade.
Setup 1: Scale-in strategy
Objective: To scale into a SOL position by splitting the risk across key levels: $130, $120, and $110. HypothesisThe idea here is to manage risk by entering at multiple levels as the price draws down, leveraging the potential for a bullish rebound. This strategy acknowledges the possibility of a significant drawdown, especially considering the wick that formed at $110 on August 5. The play
Initial entry: Start with a smaller position at $130.
Scale-in: Add to the position at $120 and then again at $110.
Risk consideration: Given the bullish conviction, if the price moves closer to $110, consider increasing the margin or utilising more leverage to gain more exposure.
Stop loss: A 50% drawdown would place the liquidation level around $66-$65, which should be acceptable if you're taking a 2x leveraged position. However, expect substantial drawdown risk, especially at $110.
Leverage & marginConsider using 2x leverage initially. As the price drops and you scale in, it potentially increases leverage or margin. Remember, the lower the price, the higher the risk-to-reward ratio and the higher the risk. Key levels
$130: First entry point. Allows participation in case of a bounce.
$120: Strong historical support with multiple wicks near this level (April 13, April 30, July 24, July 5).
$110: Psychological level and historical support, marked by the August 5th low.
Setup 2: High-conviction entry at $120
Objective: To take a high-conviction long position at the $120 level with tight risk management. Hypothesis$120 has proven to be a significant level for SOL, with multiple touches and wicks indicating strong demand. Given the overall bullish sentiment in the market, this level offers a high probability of a successful bounce, especially if Bitcoin and the broader market maintain their structure. The playEntry: Enter at $120 with a larger position size, considering the strength of this level. Leverage: Consider using 3x leverage, which allows the price to drop to $80 before liquidation or stop-out, depending on your risk appetite; 2x leverage would also be fine here as the deeper we go in price, the better the rewards anyway Risk managementIf adding more margin as the price drops, use lower leverage to avoid overexposure. The goal is to capture the expected upside while minimising the risk of liquidation.
Cryptonary's take
In summary, the Solana setup involves managing risk across key levels, with a focus on $130, $120, and $110. The scale-in strategy allows for a more flexible approach, while the high conviction entry at $120 is for those looking for a more direct play. Patience and a clear understanding of the broader market structure are essential in executing these strategies effectively. By positioning ourselves correctly and using the right leverage and margin, we can capitalise on the expected bullish rebound while controlling downside risk. However, remember that with added exposure comes added psychological pressure. The market will do what it wants, and every setup, no matter how strong the thesis, has the chance of being a loss. When we look at price predictions and understand the context of this market, these levels still offer great spot-building opportunities, which should always be considered first in this early stage of the bull market. However, the leverage options are here for those who are confident and want to gain more exposure. Ensure every trade doesn't offer too much risk to your capital, as the opportunity cost in building a spot bag and taking on higher-risk leverage trades is far stronger on the spot-building angle.
Can SOL bounce to $141 today?
04 September 2024
SOL’s Open Interest has increased substantially in the last few days as price has moved into the $130 area.
We’ve also seen SOL’s Funding Rate move from negative to positive, indicating that the Open Interest that has gone on is into longs.
This is a healthy setup for a potential bounce in prices.
SOL Open Interest:
Disclaimer: This is not financial or investment advice. You are responsible for any capital-related decisions you make, and only you are accountable for the results.
Technical analysis
SOL has moved into the $120 to $131 area, and so far, it has managed to bounce from that area.
The RSI has put in a bullish divergence (a lower low in price but a higher low on the oscillator), which could help drive price higher.
To the upside, $141 is the local horizontal resistance, while $162 remains the major horizontal resistance.
When we zoom out, we can see that price is still squeezing into the pinpoint between the horizontal support box (between $120 and $131) and the red downtrend line. As price meets the pinpoint, it could break out from there.
Cryptonary’s take
Ultimately, the $120 to $131 support zone has held for a long time now and has been tested many times, so it is somewhat surprising that it continues to act as strong support. For this reason, we are cautious about SOL price action here, even though we think in the immediate term that it can move up slightly higher to, say, $141. We remain super bullish in the long term but are sceptical of a meaningful upside in the short term. We wouldn’t be surprised to see SOL retest $110 to $120 in the upcoming weeks.
Sol dominance analysis: Is a breakout above 3.66% imminent?
27 August 2024
Current State
Today, we're analysing SOL dominance on the weekly timeframe to gain a cleaner and larger overall view of Solana's market position. Solana has been holding firmly above its 2021 ATH, consistently forming higher lows as it contracts within a range defined by the 3.66% level and the 20 EMA, which is marked by the red line. As mentioned earlier, the 20 EMA is a crucial indicator in trending markets, and it has once again proven to be reliable in SOL's ongoing trend.
Key Observations:
Support: The 20 EMA, currently positioned around the 3.66% level, has provided strong support, helping SOL maintain its bullish structure. The 2.5% level remains the key support on the downside, ensuring that SOL retains its dominance within the broader market. Resistance: As SOL.D continues to squeeze within this range, the likelihood of a significant breakout increases. This move is expected to lead to Solana capturing an even larger share of the total market cap, reinforcing its position as a leading asset in the crypto space. Market Dynamics: The ongoing contraction in SOL dominance suggests that the market is preparing for a significant move. With SOL holding above its 2021 ATH and the 20 EMA offering consistent support, Solana is well-positioned to increase its dominance in the coming months.
Conclusion
SOL dominance is squeezing into a pivotal range, with the 3.66% level and 20 EMA providing strong support. As Solana continues to consolidate, a breakout is likely, allowing SOL to capture a larger share of the total market cap. This chart remains one of the most bullish indicators for Solana's continued success.
Will SOL surpass the $162 level?
26 August 2024
SOL's Open Interest has ramped up in recent days, but it remains below its highs set back in late March. The funding rate is positive, suggesting that the leverage used in the past few days has been mostly on Longs. SOL Open Interest:
Technical analysis
There has been a really nice 15% or so move up in the last few days, which has seen SOL spike above the main downtrend line.
However, SOL has encountered resistance at the horizontal resistance level of $162, which we have marked as a key level for a long time.
However, SOL is also forming a pennant/bull flag pattern (we're not sure which one yet; we'd need more days' worth of price action), but it looks like a bullish pennant. These tend to have a bias to break to the upside.
There is a lot of support below the current price, with the first zone between $140 and $145. The second zone would be between $120 and $131, although we wouldn't be confident about price retesting this level.
The RSI is at 57, so SOL is not currently in or even near overbought territory on the Daily, meaning there's the potential for further upside in the short term.
Cryptonary's take
SOL has now moved into a more significant horizontal resistance area, so we may see a slight pullback in the immediate term, but likely just a shallow pullback. However, we believe that in the coming week or two, we can see a break out above $162, and that may be enough to ignite the bullish reversal that sends the price back to $200. For now, we remain patient, having had months to accumulate in the $120s and $130s—assuming you weren't here in 2023 when we accumulated in the $20-$40 range.
Will SOL rebound stronger in Q4 2024?
20 August 2024
SOL's Funding Rate has been in negative territory more frequently over the last 10 days or so, indicating that traders are interested in going Short. SOL's Open Interest has also stayed somewhat subdued and hasn't increased substantially following the flush-out a fortnight ago.That said, we wouldn't look to short SOL.SOL's Funding Rate:
Technical analysis
Following the bounce from the lows of around $115, SOL has managed to remain well above the horizontal support of $131, which is a positive.
SOL is also attempting to break out of the local downtrend line, but price is struggling to see a follow-through.
However, SOL currently remains below the main downtrend line and the horizontal resistance of $162. For SOL to see a major bullish reversal, price will need to break above these levels.
On the downside, the support zone remains between $120 and $131, which hasn't been tested since the recovery a fortnight ago.
Like BTC and ETH, SOL remains in a slightly tighter range in this slightly quieter time of the year. We expect volumes to return in September, and then more significant price moves can happen. But in the immediate term (pre-Powell speaking at Jackson Hole on Friday), we expect prices to remain tight and stay range-bound. In 12 months' time, I believe we will look back on this SOL range between $120 and $200, similarly to how ETH was range bound in the second half of 2020 between $300 and $420 before it did a 10x over the next 12 months.
Will it break $162 or drop below $131?
16 August 2024
SOL's Funding Rate is negative, indicating a bias amongst traders to be Short rather than Long.
Alongside this, Open Interest has actually decreased in the last few days.
There is real indecision among traders here; we'll continue to monitor how this develops.
Ultimately the OI flush out of last week is positive in the mid-term, but we might see some volatility in the short-term as traders flip-flop between positioning.
SOL's Funding Rate:
Technical analysis
- SOL's price has pulled back perfectly as we predicted in last Monday's Market Direction, back to the $140 area.
- SOL is also now in the tighter range of $131 to $162, having perfectly rejected from the overhead resistance at $162.
- The bottom of the range is $131, however, price may dip below this level and would likely find strong liquidity/bids down to $120.
- In terms of price formations, perhaps the clearest is the downtrend line. A breakout would likely send price back to $162, however, we're expecting slightly more downside in the immediate term, say to $131.
- We don't expect SOL to break out above $162 in the coming weeks, unless we get something super dovish from Powell at Jackson Hole next week.
Cryptonary's take
In the coming week, we expect SOL to see more downside, perhaps to the $131 area. But, this area may attract buyers to step in that could then see price breakout and rebound slightly, to say potentially $150. In the short-term, it's hard to know what price will do here to be honest, and we're expecting essentially just more chop in the coming weeks. But, we remain confident in that we expect SOL to be multiples higher than the current price by year end.
Will $143 support bring a bounce?
Solana is following a downward-sloping channel with potential support levels around $143, presenting a possible accumulation opportunity. Please note: The video above is set to start at the 04:00 minute mark, featuring an in-depth technical analysis of Solana (SOL). For Solana, we see a similar pattern to Bitcoin, with the potential for further downward movement. Our analysis shows that SOL is currently following a supportive, downward-sloping channel that may lead it back to levels seen during the April-March 2022 sell-off, around $143. We've marked a key area of interest between $155 and $143, where we would consider building a substantial position, either in spot markets or with light leverage. The context of the market will determine whether we apply leverage, ensuring that liquidation risks are minimised.
Disclaimer: This is not financial or investment advice. You are responsible for any capital-related decisions you make, and only you are accountable for the results.
It's crucial to understand that while the probability of SOL dropping to extreme lows like $60 is very slim, we must still be prepared for any scenario. The importance of maintaining a probabilistic mindset in trading cannot be overstated. By keeping an open mind and not ruling out unlikely but possible outcomes, we ensure that we are never caught off guard by unexpected market moves. This approach allows us to manage risk effectively while positioning ourselves to capitalise on high-probability opportunities as they arise.
SOL dominance at 3.3%: Is 2024 the year of SOL
14 August 2024
SOL dominance (SOL.D)
Current state: SOL dominance has been on a relentless upward trajectory since the beginning of 2023, starting from below 0.4% and climbing to over 3.3% today. This dramatic increase reflects SOL's growing influence in the crypto market as it continues to capture market share.
Key observations
Support: SOL.D has been forming a higher high and higher low bullish structure since breaking above its previous ATH of 2.88% in 2022.
Market dynamics: The surge in SOL dominance indicates a significant shift in market preference towards SOL, driven by its ecosystem's rapid growth.
Potential scenario: As SOL continues to capture more of the crypto market's share, we expect this dominance to increase further, solidifying its position as a leading chain.
Conclusion
SOL.D is exhibiting strong bullish momentum, supported by a well-defined higher high and higher low structure. As long as the 2.5% support holds, SOL is poised for further gains, potentially driving its dominance even higher as it becomes increasingly integral to the crypto ecosystem.
Cryptonary's take
ETH/BTC and SOL/ETH: Both pairs are near critical junctures. ETH/BTC's potential reversal back into its wedge and SOL/ETH's push towards price discovery indicate a likely shift in capital towards altcoins, particularly SOL, which is already showing strength.SOL/BTC and SOL.D: SOL's dominance over both BTC and ETH is evident in its bullish structures across both pairs. SOL/BTC's potential breakout and the continued rise in SOL.D reinforce the narrative of SOL leading the next market cycle, especially if BTC's dominance breaks down.
Will it break the $170 resistance soon?
13 August 2024
Current State: SOL has retraced slightly from the trend line and is currently trading above the 140 base region, specifically at 146. It maintains a position above the 200 EMA, which is a positive sign, indicating that SOL still has strong underlying support despite the recent pullback.
Key Observations:
Support: SOL holding above the 140 region and the 200 EMA is crucial for its continued bullish outlook. These levels provide a solid foundation for any further moves upward.
Larger Context: Personally, I (Kushal) believe that SOL should hold above the 120/130 region in the larger context. This area is critical for maintaining a bullish structure as SOL consolidates and prepares for another potential run.
Resistance: The next major levels to watch are 170 and 200. Clearing these levels will be key for SOL to challenge its ATH again, possibly within the coming month if the broader market conditions remain favourable.
Conclusion:Bullish/Neutral - SOL is showing resilience by holding above the 140 base region and the 200 EMA. As long as it stays above the 120/130 support zone, SOL remains in a strong position to fuel up for another run. A break above 170 and 200 would pave the way for a retest of ATHs in the near future.
Will Solana dip to $120 or bounce?
12 August 2024
Our examination of Solana showed that the asset had experienced a notable sell-off, leading us to close our spot trade at $143. Please note: The video above is set to start at the 9-minute 52-second mark, featuring an in-depth technical analysis of Solana (SOL).
Despite this, Solana's long-term potential remains intact, but we expect some short-term downside or consolidation before any significant upward movement. The asset has been trading within a range, and we believe it could revisit the $120 to $130 area before making another move higher.
Solana continues to show strong bullish characteristics on the weekly chart, but it may require more time to stabilise after recent market volatility. Patience will be crucial for traders looking to accumulate Solana, as the market could offer better entry points in the near future. Our analysis suggests that a double-bottom formation or further consolidation within the current range could present favourable buying opportunities.
Can Solana push beyond $160 this week?
12 August 2024
SOL's Funding Rate has also been whip-sawing from slightly positive to slightly negative over the last few days, suggesting indecision from traders. SOL's Open Interest has also reset, but it has reset to the baseline we've seen over the last few months. Every time SOL's Open Interest spikes and then begins to decline, that has represented a local top for price. This will be key to watch and track going forward. SOL's Open Interest:
Technical analysis
In our last Market Direction, we expected price to pullback from the $160 level and retest the $135 to $145 level. We hit $140 and bounced... nice, good call.
Price found support between the $135 and $145 area, a local support zone.
Price is now currently in the middle of the range between the major resistance at $162 and the major support area between $125 and $132.
It's hard to say what price will do in the very short term; the data doesn't suggest one way or the other.
Cryptonary's take
We expect prices to be range-bound between $125 and $160 over the coming week, so we will look to add risk around $130 and de-risk around $160, just for the time being while we're in August. We will then re-assess as the days progress, but essentially, we're not expecting fireworks here anytime soon.
Will $162 block a 20% rise?
09 August 2024
SOL's Funding Rate is close to going negative, indicating there is an appetite for Shorts to start stepping in here. If this increases significantly, this could cause a Short-squeeze.
SOL's Open Interest has reset from its recent highs. However, it has also rebounded by 20% off the lows, indicating participants are beginning to jump back into trades, just not with the risk appetite they had previously.
SOL's Open Interest:
Technical analysis
SOL has been rejected from a strong resistance level. This resistance level is the horizontal resistance of $162 and the main downtrend line (red line).
Price is also stalling out at the RSI-based moving average here.
$162 is likely to remain a key level for SOL to reclaim back above.
So far, there isn't a candlestick formation, no bear flag, for instance, but we have had a sharp recovery, meaning that the current slight pullback we're seeing could come down slightly lower.
Disclaimer: This is not financial or investment advice. You are responsible for any capital-related decisions you make,and only you are accountable for the results.
Cryptonary's take
On this recovery, SOL outperformed, which we, of course, take as a sign of things to come in the upcoming months. However, in the next 2-4 days, we're expecting SOL to pullback to the $135 to $145 zone.
Over the next week, our thinking is that SOL doesn't see major upside, and we don't see it breaking above the horizontal resistance of $162. It is likely just going to stay range-bound between $135 and $160.
We will reassess again next week, but we expect SOL to be substantially higher in 2 months' time.
Will $155 hold after 40% rise?
8 August 2024
This article provides a comprehensive technical analysis of the current Solana (SOL) market trends.
Please note: The video above is set to start at the 3:07 minute mark, featuring an in-depth technical analysis of Solana (SOL).
Solana has demonstrated notable strength, rebounding by approximately 40% from recent lows. This relief bounce has brought SOL back to key resistance levels around $155. Historically, these levels have acted as significant support and resistance, suggesting a potential area for price consolidation or reversal. While this bounce is encouraging, we remain cautious about potential short-term downside risks.
Disclaimer: This is not financial or investment advice. You are responsible for any capital-related decisions you make, and only you are accountable for the results.
Given the current market conditions, we anticipate a possible double-bottom formation before a sustained upward move. This could see SOL revisiting the $130 level or potentially lower support levels. It's important to remain flexible and prepared for various scenarios as we monitor the market's reaction at these critical levels.
Educational insight: Support and resistance levels are fundamental concepts in technical analysis. These levels represent areas where price has historically struggled to move beyond, either reversing direction or consolidating before a breakout. Recognising these levels allows traders to identify potential entry and exit points, manage risk, and anticipate market reactions. In Solana's case, understanding these key levels helps us navigate the current market volatility effectively.
Can SOL hit $205 soon?
7 August 2024
In-depth analysis of Solana's market dynamics and technical indicators.
SOL has also seen a resetting in its Open Interest. Again, this is healthy.
SOL has a positive Funding Rate, but it’s relatively flat, indicating there is more balance between Longs and Shorts.
Overall this is a healthy resetting for SOL from a mechanics perspective.
SOL Open Interest:
Technical analysis
SOL also rejected at its local horizontal resistance of $190, so it is not able to push on to the major resistance of $205.
With a brutal drawdown from $190, price was finally able to catch a bid as it moved into old horizontal support of $120. Price managed to close above the major support level of $131.
Price is now bouncing from the lows, and SOL has shown more strength (in this bounce) than other plays despite not being as oversold initially.
In the short-term, it’s possible that the horizontal level of $162 acts as a local resistance.
Cryptonary’s take
This is currently looking like a V-shaped recovery. However, we are skeptical of this for now, and our thinking is that we can’t rule out a retest of the $130 area. For SOL, it’s possible the lows are already in. We’re not sure we’d add to our SOL bags unless there was a more substantial move lower, maybe to say $100-$110, but again, we’re not sure that we’ll get this. Ultimately, the opportunity looks better on ETH in terms of picking up a good play in a better value territory simply because ETH is so oversold, whereas SOL isn’t. That doesn’t mean we necessarily prefer ETH over SOL for this cycle because we don’t. But we’re trying to identify a play for right now (if we retest lows) where we see better value. And, for now, that lies with ETH over SOL here in the very short-term. In the long term, we think SOL will drastically outperform.
Price forecast today for Solana (SOL)
6 August 2024
SOL has also seen a resetting in its Open Interest. Again, this is healthy.
SOL has a positive Funding Rate, but it's relatively flat, indicating there is more balance between Longs and Shorts.
Overall this is a healthy resetting for SOL from a mechanics perspective.
SOL Open Interest:
Technical analysis
SOL also rejected at its local horizontal resistance of $190, so it is not able to push on to the major resistance of $205.
With a brutal drawdown from $190, price was finally able to catch a bid as it moved into old horizontal support of $120. Price managed to close above the major support level of $131.
Price is now bouncing from the lows, and SOL has shown more strength (in this bounce) than other plays despite not being as oversold initially.
In the short-term, it's possible that the horizontal level of $162 acts as a local resistance.
Cryptonary's take
This is currently looking like a V-shaped recovery. However, we are sceptical of this for now, and our thinking is that we can't rule out a retest of the $130 area. For SOL, it's possible the lows are already in. We're not sure we'd add to our SOL bags unless there was a more substantial move lower, maybe to say $100-$110, but again, we're not sure that we'll get this. Ultimately, the opportunity looks better on ETH in terms of picking up a good play in a better value territory simply because ETH is so oversold, whereas SOL isn't. That doesn't mean we necessarily prefer ETH over SOL for this cycle because we don't. But we're trying to identify a play for right now (if we retest lows) where we see better value. And, for now, that lies with ETH over SOL here in the very short-term. In the long term, we think SOL will drastically outperform.
Don’t buy SOL until you read this analysis
29 July 2024
If you thought Solana's recent performance was impressive, you ain't seen anything yet! Our SOL analysis paints a picture of a potential rocket preparing for liftoff. With a bullish breakout already in play and open interest skyrocketing, are we on the cusp of witnessing SOL's march to new all-time highs?
Market mechanics
We've seen a huge rise in Open Interest over the last 24 hours/week, with OI now not too far off the highs we saw in early April. Funding is flat (0.01%), so there has been a lot of buildup of Shorts here, too. Like BTC, there's potential we see Shorts get squeezed here if the price can keep grinding higher. SOL Open Interest:
Technical analysis
SOL managed to break above its main downtrend line, formed a bull flag that retested the downtrend line as support, and price was able to break out to the upside. We perfectly predicted this in the last Market Direction for SOL.
Price now seems to be heading higher, with the main horizontal resistance of $205 in sight.
A breakout of $205 would likely send SOL pretty swiftly to prior all-time highs of $255. However, it's possible we will see a consolidation above $205 upon the breakout.
To the downside, there are two levels of horizontal support now, $173 and then $162. We expect $162 to be held.
We note that the RSI is approaching overbought territory, and currently, SOL is putting in a bearish divergence (higher high in price, lower high on the oscillator). This is a bearish pattern. Despite this, we think the price can continue to grind higher.
Cryptonary's take
SOL is still the play of the cycle, in our opinion, and it looks super positive overall. We do expect SOL to move higher, but $205 may prove strong resistance in the short term. This might lead to a slight pullback from $205 before breaking out higher in the coming weeks/months. We remain very bullish on SOL and fully hold our Spot bags. We're not looking to sell anytime soon, and we expect prices to be substantially higher in the coming months and quarters.
Is Solana overextended? Key support at $162 in focus as pullback looms
24 July 2024
Solana, despite its recent breakout, may be overextended and due for a pullback.
Market mechanics
Similar to BTC and ETH, but perhaps even more exaggerated, SOL has seen a substantial increase in Open Interest, up more than 30% in just the last 10 days alone.SOL's funding rate is positive here, which suggests that a lot of the open interest that has come on recently (the leverage positions taken out) is Longs.From a mechanics perspective, SOL might also be vulnerable to a slight flush out here. SOL open interest:
Technical analysis
SOL has gotten a clean break out of the horizontal resistance of $162 and the main downtrend line.
There is local support at $170, but the major support is at $162. If the price pulls back, which we believe it might, we'd like to see this zone (between $162 and $170) held and the price bounce from there.
If the price cannot hold above $162, then technically, the next major support is $131, but we're not confident that we see SOL pull back as far as that.
To the upside, the key level for SOL to break out from is $190 and then $205. Clearance above $205 and the all-time high of $255 is next.
On the recent move higher, the price did move into overbought territory, so it's not unusual that we see a slight slowdown here.
Cryptonary's take
Long-term, we're super bullish on SOL, but in the short-term, it's possible we see a slight pullback, possibly back to $162. However, we do think this level can hold and provide support for price to bounce on higher. Ultimately, prices are still range bound until we see that major break out to the upside. Key levels there are as we suggested above; $190 and $205.
If you are bullish on SOL, check out RAY
15 July 2024
The crypto market has started experiencing a resurgence in interest and activity. Bitcoin has started to show signs of strength after a period of consolidation, suggesting that a new bullish phase might be on the horizon. This shift in momentum is creating ripple effects across the altcoins market, with many coins preparing for their next leg up. In this environment, $RAY stands out due to its strong association with the Solana ecosystem, which itself is gaining traction and investor attention.
Disclaimer: This is not financial or investment advice. You are responsible for any capital-related decisions you make, and only you are accountable for the results. We also advise setting a risk tolerance level in terms of capital allocation while trading. The industry standard is no more than 2% of your portfolio at any given time. This means if you are in an open position already, it's advised not to take on more trades, which will lead you to be overexposed. Allow current trades to be settled; there will be more opportunities around the corner.
Technical analysis
$RAY saw a remarkable 150% move from $0.14 in March to higher levels, demonstrating strong demand. After this rally, the price retraced to its base and has been consolidating. In early June, $RAY broke out from its retracement downtrend and gave a retest, confirming the breakout. Currently, it is positioned at around $1.97, which is a key level to watch. Additionally, it has been facing resistance from a trend line descending from its all-time high to the base.
Trading strategy
Entry: $1.97
Stop loss: $1.35
Targets
Take profit 1: $3.36 (69% gain from the breakout)
Take profit 2: $4 (100% gain)
Cryptonary's take
$RAY is forming a strong bullish structure, aligning with the broader market sentiment. With the ongoing consolidation in BTC and major alts, $RAY is poised for a significant move. The resilience shown by $RAY and its potential to benefit from the meme coin mania makes it a compelling opportunity.Investing in $RAY now, as it gears up for a breakout, follows the classic strategy of buying when others are cautious and selling when the market heats up. This is your chance to position yourself ahead of the next major surge. Stay alert, stay strategic, and be ready to capitalise on the market's momentum.
SOL has to bounce NOW! Otherwise, $65 is on the cards
22 Jan 2024
SOL’s mechanics are clean. Open Interest is down considerably from the top a month ago, while Funding Rates are also flat. A healthy leverage market is positive for price, but it doesn't mean price won't go down; it just means the market isn't vulnerable to a leverage flush out.
Disclaimer: Not financial or investment advice. You are responsible for any capital-related decisions you make, and only you are accountable for the results. “One Glance” by Cryptonary sometimes uses the RR trading tool to help you quickly understand our analysis. They are not signals, and they are not financial advice.
Technical analysis
SOL now has an interesting chart that seems to have respected key levels. If we chart right, price action should respect it.
Price tried to break out of the downtrend line but found a strong resistance into the top of the liquidity box (purple box).
The current price is around $87. We can see that price has found bids/buyers around this area and bounced. But again, the more times this level is tested, the weaker it becomes.
The main horizontal support level is a zone between $77 to $81. It's pivotal that price bounces from this area; if it doesn't, expect $65. Of course, $65 would be a big buying opportunity if we get there.
The bullish reversal for SOL would be to see price break out of the red downtrend line and for the closure of a significant timeframe candle above this downtrend line.
Cryptonary's take
Macro-wise, we are bearish on the market over the next couple of months. Our analyst who re-bought SOL at $95 is still holding and will be happy to be proven wrong if price goes higher. We are waiting to see if we are right and if the market goes lower. If it does, we’d be buyers. But, we are constantly analysing prices based on where we think we are on the macro timeframe. As you know, there will be some macro issues in March. So that's when we think we want to be buyers if we are right on the macro front, and we'll keep judging the price of SOL in the run-up to March. If this happens and we get a meaningful price breakdown in the next two weeks, we will add more exposure. But we will certainly wait for at least sub $79 before buying. We'll keep assessing price changes against the macro timeline and gradually layer buys of SOL against this timeframe of price and time over the coming months.
Against all odds, SOL has the potential for another leg higher
15 Jan 2024
SOL is an interesting setup here. From the mechanic’s perspective, SOL also looks good. The Open Interest has reset significantly from its highs a few weeks ago while Funding also remains healthy.
Technical analysis
The Purple box is still providing to be a sticky area for price to get above convincingly, price has not been able to hold above this level.
Price is entering into a squeeze between the downtrend line (red line) and the uptrend line (yellow line). As price squeezes into the pinpoint, it may see a volatile break.
If $104 can be cleared to the upside, then this opens the door for SOL to move back to $117.
If SOL breaks down the downtrend line, then $77 to $81 can be tested.
Cryptonary's take
If BTC can hold up in a range here and there isn't major Greyscale selling tomorrow, then SOL can potentially do well here and break to the upside in the coming days as the bullish catalyst of a $JUP airdrop is on the horizon. Even though we are not massively confident of a major upside here, we think there is enough for prices to go higher. Our analyst, who sold half their SOL holdings, has now re-bought the SOL they sold at $99 at $95. When unsure about the market and liquidity is good with catalysts also on the horizon, it's better to be in the market than out. However, it is important to see how the market opens tomorrow, with Greyscale potentially continuing to sell large amounts of BTC. Let's see what we get.
SOL will either break out to $117 or break down to $77
12 Jan 2024
SOL's Open Interest has moved up in the last week or two.
However, it is still well below the excessive highs seen in mid-December.
We'd expect a further decrease in OI over the coming month or two. However, the $JUP airdrop at the end of January may keep OI high.
Will need to keep watching this. Funding is flat, though, which is positive - neither Longs nor Shorts getting out of hand, which is good.
Technical analysis
SOL is in a really key range here. We previously outlined the Purple box as a liquidity range. Price will likely be sticky to the area of this box, which it has proven to be.
Yesterday, SOL rejected into the local downtrend line. If the price breaks above this downtrend line, we can expect $117.
To the downside, price will need to use the uptrend line as support. If it can't then the $77 - $81 range will need to hold as support.
The positive news is that the RSI has reset majorly on the 12hr and the 1D timeframes and is even beginning to reset on the 3D and the Weekly timeframes, although still very close to overbought.
Cryptonary's take
This could go either way here.
Therefore, the BTC ETF inflows/outflows, etc, over the next few days may really decide general risk sentiment and, therefore, attitude over the coming weeks/month.
Essentially, we will need to see a move away from the Purple box. Whichever direction this is, it will set the direction of a trend continuation.
Let's wait and see. We remain patient on this but are watching vigilantly.
On SOL: bearish short-term, bullish long-term
08 Jan 2024
SOL is much healthier also, but it's about time. OI has reset from a peak of $1.45b down to now $881m, while Funding, like the rest of the market, is at 0.01%.
Technical analysis
SOL is one of the more interesting plays here. The main support is the uptrend line now.
There is a major horizontal support between $77 and $81.
The main horizontal resistance is $117 now.
The key level we are focusing on is the purple box. This box (range) will likely act as a resistance for price, if price is below it and moving up to it and a support for price if price is above it and moving down to it.
For now, the purple box is likely to act as a resistance for price.
The RSI on the 12hr and the 1D have both reset substantially. The 3D and the Weekly have reset also but are flirting on the border of overbought territory. This will likely need further resetting in the coming months.
Cryptonary's take
SOL has pulled back a bit, and if we're honest with ourselves, it probably needed to. On the BTC ETF decision on Wednesday (assuming it will be Wednesday), SOL can probably move higher with the rest of the market. What should also be noted is that the $JUP airdrop is likely to be in the last week of January, so this can be a stimulus for SOL and the SOL ecosystem. However, in the medium term (the next few months), we see SOL lower, potentially down to $70, possibly even lower.
Next week or few weeks = higher prices.
In 1-2 months = lower prices.
In a year's time = well beyond all-time highs.
We are cautiously optimistic about SOL for the next few weeks
04 Jan 2024
It's cleaner to look at SOL's 4-hour candlestick chart rather than the 12-hour chart because it has been so aggressive recently.SOL's mechanics have reset in a more material way here. It's not just the Funding Rate that has come down substantially (now back to healthy levels of 0.01%), but the Open Interest has come down from $1.33b to $983m - a 30% clear out. This is much more positive and really needed. This flushing out may give SOL the room to move higher in a healthy manner.
Technical analysis
The purple box is to outline a key liquidity range between $97 and $102. $97 is local support, and $102 is local resistance.
There is another local support at $93, but beneath that, the next support is the major level of $77 to $81.
To the upside, $107 is a local resistance, with $117 being the current main resistance.
The RSI on the 12hr and the 1D are clean. However, the 3D is still overbought but close to 70. But, the Weekly is still very overbought. We still think SOL will pull back more significantly in the coming months.
Cryptonary's take
Straight away, our initial feelings are that SOL can move up in the pre-ETF decision and immediately after the decision (assuming the BTC ETF is approved). But, beyond that, we think you'll see a strong consolidation period and even a more meaningful pullback potentially into the mid $80's again. To be more accurate on this, we'd want to see how price does on the ETF decision. If the price gets to $117, and then that seems it, we would be inclined to sell some of our SOL to re-buy much lower. But that sale would likely be on the euphoria of the ETF pump (again, assuming it gets approved). Let's re-assess SOL around the ETF decision. In short, even though we think SOL could go higher (to say $117), we remain cautious for now. We are still positioned but not looking to add to our position currently.
What does Q1 2024 have in store for SOL?
02 Jan 2024
To determine where SOL is headed, we start by looking at the charts on the 4hr to identify local levels more easily. And from a mechanics’ perspective... it’s simply madness! The OI is extremely high, with Funding at 0.1%; this is ten times more than the standard healthy rate, meaning Longs are paying Shorts a huge premium to be Long. Unless price consolidates and Longs slowly unwind (best case scenario for Longs), this likely ends in a more meaningful flush if the Spot bid cannot be maintained.
Technical analysis
SOL had a nice breakout from the wedge/pennant-like pattern but is now running into local resistance.
$117 is a local resistance for price, while $109 is a local support.
The overhead major resistance is $131, with the main horizontal support now being $99.
The RSI has calmed down on mid-timeframes but remains very overbought on the 3D and the Weekly.
Cryptonary's take
SOL has performed phenomenally so far. And while there could still be more meaningful upside, potentially to $130-$140, we'd feel uncomfortable adding new positions at current prices with any major size. We're still moving into the ETF decision with four full months until the halving. In the next few months, we may see some profit-taking and repositioning into the coins that haven’t run as well yet.SOL would be the number one candidate for this repositioning. So, we are reemphasising caution on SOL. This does not necessarily mean we’re selling it, but we would wait for lower prices a month or so post ETF before adding more meaningful size (if you have spare capital on the sides). If prices hold up relatively well in the next two months, you can bite the bullet and buy SOL. But really, we'd be surprised if SOL was massively higher than it is now in the next two months.
Will SOL show real strength to break out above $81?
20 December 2023
SOL has seen a more meaningful increase in its Open Interest in the last few days. The Funding Rate has also increased to 0.023% - indicating a big bias to be Long. For now, this doesn't concern us; however, if Funding continues to increase, Longs will be vulnerable to a flush-out.
Disclaimer: Not financial or investment advice. You are responsible for any capital-related decisions you make, and only you are accountable for the results.
Technical analysis
SOL has again reclaimed its uptrend line, allowing for further bullish momentum.
The main horizontal resistance is $81; a clean break above would be very bullish for SOL.
The main horizontal support is a zone between $61 to $65. We would be light DCA buyers of SOL in this area.
The RSI has reset on the 12hr and the 1D but remains overbought on the 3D and the Weekly.
The 3D and Weekly timeframes have put in several bearish divergences. This suggests SOL needs a more meaningful reset at some point.
Cryptonary's take
SOL is at a crucial level here. Real strength is a break above $81 and for price to establish itself in a higher range. What does concern us is that the horizontal resistance of $81 is still overhead. At the same time, several bearish divergences have built up on all major timeframes, with the 3D being the most concerning. We love SOL for the upcoming bull market in 2024/2025, but we wouldn't look to add to our bags at current prices. Instead, we'd look for a more meaningful pullback to add to our size, with the first target area of $61 to $65 to begin DCA'ing again - assuming price gives us the opportunity to do so in the coming month or two.
SOL has lost its uptrend, will this lead to more downside?
18 December 2023
SOL’s mechanics have reset substantially, with Funding Rates back to 0.01%. The Open Interest is still high at $800m but has pulled back from $1.1b. However, the TA suggests we may see further downside.
Technical analysis
The uptrend has been lost, but SOL has done this before and has then been able to recover it quickly.
There are local supports at $65 and $61, with the more major horizontal support at $56.
$77 to $81 is a main horizontal resistance range.
The RSI has reset on the 12hr and the 1D; however, the 3D and the Weekly remain overbought, particularly the Weekly. This likely needs to see a further reset.
Cryptonary's take
The market has moved really well over the past two months, particularly SOL. A more substantial pullback would reset some of the larger timeframes, which would be healthy for SOL mid and long-term. We may see SOL in the coming month or two back at $61, if not $56. If this happens, it will then hammer out $56 to $61 as a new long-term support range. If SOL reaches $61, we would add light DCA orders, with these orders becoming more aggressive in USD size down to $52 if we get a pullback that's further than expected.
We are cautiously optimistic about SOL
15 December 2023
The SOL ecosystem may have another good few weeks left in it. But SOL on its own is beginning to look somewhat top-heavy here. We love it for the long run but wouldn't look to add fresh positions at the current price. However, we see opportunities in Q1 that'll allow us to add considerably to our SOL bags at better prices.
SOL has done phenomenally well to reclaim its uptrend line again and has broken to new local highs.
The major horizontal resistance is at $81; if SOL can comfortably get above this price, it opens the door for the price to establish itself in a higher range between $81 and $91.
If SOL cannot get above $81, it's likely the uptrend line may be broken, and SOL might revisit $61 as this is a major horizontal support.
Open Interest in SOL has spiked back up and is close to its high of $1.1b, currently at $1.0b. It is up from $800m two days ago - a 25% increase. Caution.
The Funding Rate has remained high, and even though it has come down a touch, it remains comfortably in the 0.03% area, which indicates that there are a lot more Longs than Shorts. If this goes further positive, Longs become more vulnerable to a squeeze.
The RSI on the 3D and Weekly both remain phenomenally overbought. This is likely to come down in the coming month or two.
Cryptonary's take
In the next few days, SOL may remain near its highs as the SOL ecosystem continues to perform well. However, we see that in the coming months, SOL will likely lose its uptrend and break lower. For the long term, this is positive as it enables prices to consolidate to have more organic moves and then go up later. In the medium term (the next month or two), we may see SOL back between $56 and $61. In the coming months, if SOL does move down to $56 - $61, we will be big DCA buyers of SOL for the long term. If anything sub $56, we would be aggressive with our DCA buys. A break above $81 would invalidate my short and mid-term bear thesis, and we would then reassess from there.
SOL slows down; now, the consolidation begins
13 December 2023
SOL is now out of its main uptrend line. It has recovered when it lost the uptrend before, but it does look relatively weaker here, despite volumes still being okay.
Currently, there is the local support of $65 beneath price, along with the more major horizontal support at $61. If these levels are lost, $56 and then $52 will be the targets. Both of these would be good DCA'ing areas.
Still, the RSI on the 3D and the Weekly remains in overbought territory, which suggests that we’re likely to see more downside or at least a consolidation for a month or so, likely sub $60. Price could potentially consolidate between $52 and $60, resetting these larger timeframes.
The Open Interest has reset substantially from a week ago from $1.1b to $800m. A 25% or so decrease. This was absolutely needed for SOL.
Cryptonary's take
Short-term price action is likely to be dominated by today's events, led by however hawkish Chair Powell is. However, in the next few months, we see SOL likely consolidating for a while. This consolidation may see price go to $48, and we may become range bound between there and $60. But it's our feeling that we see more pullbacks and a consolidation of those ranges. After all, it’s a major cap coin that was close to quadrupling in just two months - from $21 in mid-October to the high of $77 last week. We remain patient with SOL; we believe there will be good long-term entries in the coming months in the $50s.
SOL rockets to $72: Next stop $81?
08 December 2023
SOL managed to find support at $61 and has shot up to $72. Even though some of the major timeframes look overbought, SOL can see more upside.But, OI is at yearly highs, and Funding is 0.03%, so Longs should be wary.
TLDR
Solana (SOL) found support at $61 and surged to $72. Despite being overbought on major timeframes, the potential for further upside exists.
Open Interest (OI) hits yearly highs at $1.06b, and Funding is at 0.03%, signalling potential overcrowding in Long positions and vulnerability to a squeeze.
SOL bounced off $61 support and reclaimed the main uptrend, with new local support at $65 to $66. Overhead resistance at $81 could be the local top.
SOL may be range-bound between $61 and $81, with overbought conditions on all timeframes.
Disclaimer: Not financial or investment advice. You are responsible for any capital-related decisions you make, and only you are accountable for the results. “One Glance” by Cryptonary sometimes uses the RR trading tool to help you quickly understand our analysis. They are not signals, and they are not financial advice.
Technical analysis
SOL has been able to bounce off the $61 support and reclaim the main uptrend.
New local support would be $65 to $66.
The overhead horizontal resistance is at $81. We expect this may be the local top of the move.
The current move is overbought on all timeframes, particularly the 3D and Weekly timeframes.
SOL is very 50/50 here in terms of direction from a TA point of view. We would expect it to remain range-bound between $61 and $81.
Market mechanics
Open Interest has kicked back to new yearly highs at $1.06b, with most of the positioning sat in Longs as we speak.
The OI-Weighted Funding Rate was much higher 24 hours ago, and it has come down to around 0.03%; however, this remains very high and suggests that Longs are relatively overcrowded here and may be vulnerable to a squeeze.
Cryptonary’s take
SOL has been one of the best performers, supported by several really positive airdrops for the community from Solana-based projects.We see SOL being range-bound in the short-term between $61 and $81, and we do not rule out a leverage flush out of Longs that could pull price back 10-15%.If SOL retests $61, we would look to DCA into that level.
Is SOL due for a meaningful pullback?
07 December 2023
SOL's OI is at new highs while funding is ramping up aggressively. Longs are piling in and now becoming offside.
On TA, SOL looks strong, recovering $61 and pushing into the local resistance of $65.
We'd emphasise caution here.
TLDR
Solana bounced back up after holding the key $61 support.
Price is targeting the next resistance at $65; breaking higher opens the path to $69.
Open interest at new highs and funding spiking as leverage builds.
Disclaimer: Not financial or investment advice. You are responsible for any capital-related decisions you make, and only you are accountable for the results. “One Glance” by Cryptonary sometimes uses the RR trading tool to help you quickly understand our analysis. They are not signals, and they are not financial advice.
Technical analysis
SOL found support at $61 and has now been able to bounce off that level. This is very positive for price, and has invalidated what was a bearish structure.
If SOL can claim above $65, then $69 can be retested again.
$59 to $61 is a large support now for SOL; if this level is broken, we could see a more meaningful decline.
The RSI is very overbought on the 3D and the Weekly but remains positive and healthy on all other timeframes.
We’re not looking for short-term trades on SOL, but we will be looking to DCA into SOL if there’s a move to $52, sub $48, we’ll DCA more aggressively.
Market mechanics
Open Interest is now back to new highs.
The OI-Weighted Funding Rate did reset yesterday, but as price has moved higher today, Funding has aggressively ramped up. Longs are beginning to look overweight here, and increasingly so if this continues.
Cryptonary’s take
SOL has had really positive price action in the past few days, having been able to reclaim $61, which is a really key level and invalidates the bearish setup.The mechanics, however, are getting overheated again, with Longs becoming overweight. We may see a move lower for price in the very short term to flush out the excess Longs that are currently building up. What we then need to see is $61 hold as support.We’re not looking for any short-term trades unless Funding continues to increase and the price moves to $66. Then, we may look to take the other side and go Short. Regarding DCA’ing, we will look to DCA on a pullback to $52.
SOL above $61 - Can it stay there?
06 December 2023
SOL has done well to get back above the $61 resistance. It's now important we see this level hold.OI is high. Funding was extremely positive this morning; it has since reduced, but still very positive. Longs should be cautious.
TLDR
Solana reclaimed the previous $61 resistance but uptrend line resistance looms overhead.
Funding rates spiked heavily, indicating overcrowded Solana longs are vulnerable.
Open interest remains elevated and likely needs more of a pullback.
We have our eyes on $52 as a key DCA level on any Solana dip, with will be open to shorting SOL if funding spikes again.
Technical analysis
SOL has been able to reclaim the horizontal resistance of $61. It’s now important for price to turn this into new support.
SOL remains beneath its main uptrend line, which is acting as another resistance.
The RSI has reset on all timeframes except the 3D and Weekly, which remain extremely overbought. These will need to come down at some point.
If there is a pullback, we would be DCA buyers of SOL at $52.
Market mechanics
Open Interest is down from its highs of $983m to $908m. In our opinion, this likely needs to come back more.
The OI-Weighted Funding Rate shot up massively last night and the early hours of this morning to 0.0923% - huge. This indicated that Longs were too overweight and offside. As price has pulled back from $66 to $63, Funding has pulled back to 0.038%. This is still too high, really.
Cryptonary’s take
SOL’s mechanics were very unhealthy this morning, with too many Longs having piled in that Longs were then vulnerable to a squeeze. We’ve seen this reset slightly, but this likely has further to pull back first to shake out the excess leverage. If SOL does pull back, we would add light DCA orders to SOL at $56 and be more aggressive with DCA orders sub $52.Regarding short-term trades, the opportunity was Shorting SOL at $66 when Funding was majorly positive this morning. If Funding moves up again, this may provide another opportunity for a short-term Short.
Brace for impact as SOL tests key support
05 December 2023
SOL has lost its main uptrend. If support can’t hold at $59, it could pull back to $56 and possibly $52.Positioning is balanced, but OI is at highs, last seen in April 2022. A flush out on the cards means - price down.
TLDR
SOL breaks its main uptrend, risking a pullback to $56 and possibly $52.
Local support at $59 is crucial; failure could trigger a significant downward move.
Open Interest remains high, hinting at a potential market flush-out.
We will be waiting and ready to DCA into SOL at the $52 area.
Technical analysis
SOL has broken below its horizontal support of $61 and is now beneath its main uptrend line.
If the local level of $59 cannot hold, this would open the door for a more significant move lower.
$56 is a significant support, but if price breaks below this level, then $52 is the next support.
$52 would be a great level to DCA further into SOL.
Market mechanics
Open Interest remains close to its local highs at $983m, down from $993m.
The OI-Weighted Funding Rate has reset to more neutral levels of 0.012%. This is a big move down from yesterday’s levels of 0.080%. This means Longs and Shorts are in a much more even balance.
Cryptonary’s take
Open Interest remains high and is likely due for a flush out, but positioning is now more even between Longs and Shorts. So, we then look at the technicals. The chart suggests more downside for price, particularly if price breaks $59 to the downside. This would then mean that Longs would likely be flushed out, which would reduce the Open Interest. We expect more downside for SOL here, particularly if BTC cannot break higher. We would be DCA buyers of SOL at $52 if the market gives us this price.
WIll SOL hold the line at $61 or dive to $56?
04 December 2023
Will SOL hold at $61 or dive to $56?
SOL is at a crucial level here - trying to maintain the uptrend and hold the $61 support, which was the prior resistance.
SOL's Funding has reset substantially, having been massively positive last night. OI at new highs.
TLDR
SOL is at a critical juncture; for it to maintain an uptrend, the $61 support must hold.
Funding for SOL has reset significantly, with massive positive spikes now balancing the equation.
Technical analysis indicates a delicate balance at the $61 level; a breakdown could mean finding support at $56 and possibly $51.
We will DCA in at $56 for light buying and be ready to make aggressive buys at $52.
Technical analysis
SOL managed to break above its prior resistance of $61 but rejected into the $66 level.
SOL is now at a convergence point of the $61 level (prior resistance, now potentially new support) and the uptrend line, which should act as support. SOL can break lower here, particularly if it loses this key level.
$56 would be the major support to the downside. Beneath this, it’s $51.
The RSI is relatively healthy on all timeframes except the 3D and the Weekly, both of which remain majorly overbought.
If SOL breaks down to the low $50s, we’d be DCA Spot buyers for the long term at that price point.
Market mechanics
Open Interest has increased to a new high at $993m.
The OI-Weighted Funding Rate has been very volatile. It has come down significantly since the early hours of this morning, but it remains at relatively high levels. Longs are paying a substantial premium to Shorts to be Long.
The Long/Short ratio at 0.9429, indicating more participants have piled into Shorts than Longs in the past 8 hours; this is perhaps why the Funding Rate has decreased from 0.0844% to 0.0263%.
Cryptonary’s take
SOL is at a crucial point here. Price is currently at the convergence area of $61, which was the prior resistance and potentially new support, along with the support of the uptrend line. If this level is lost, then we may see price go down to $56.
The mechanics were overheated, but with the slight price pullback from $66 to $61, we've seen that late Shorts chased the move down, and many Longs were liquidated.
If price were to pull back, we’d be pleased to see this as we would take advantage of lower prices by DCA’ing more into SOL and increasing our Spot bags. We would be DCA buyers of SOL if price pulled back to $52, and we would be light DCA buyers of SOL if price pulled back to $56.
SOL shorts are at risk
01 December 2024
SOL's mechanics are interesting here. We're seeing OI up, but Funding down means more Shorts.
SOL is at the $61 horizontal resistance. A break above could see SOL push onto $69 and then $80. It's hard to call here, but we wouldn't Short.
TLDR
SOL is facing a key test at $61 resistance; a breakout could trigger a short squeeze.
With more shorts opening positions, the long/short ratio favours bears.
The bullish structure is intact unless SOL drops below $52.
Attractive long-term buy on dips to low $40s.
Technical analysis
SOL is really on the cusp here; a break above $61 could see a meaningful breakout higher to $69 and even $80.
$61 is the main horizontal resistance. However, a break above may drive a Short squeeze.
SOL is also squeezing into the pinpoint of the uptrend line and the horizontal resistance of $61 - the result could be a volatile move here.
The RSI on more major timeframes remains very overbought on the 3D and the Weekly. Note the 3D has also put in a bearish divergence.
Market mechanics
Open Interest has moved up again to $850m, just shy of the yearly high set a few weeks back at $933m.
But, what’s interesting in comparison to BTC and ETH is that the OI-Weighted Funding Rate for SOL has decreased over the last 8 hours, ramping down from 0.016% to 0.010%.
The Long/Short ratio is 0.9631, indicating more participants have piled into Shorts than Longs. It is a very different setup from BTC and ETH.
Cryptonary’s take
SOL is really interesting here, particularly from a mechanics point of view. We’re seeing more Shorts open into the resistance of $61. These Shorts may be vulnerable to a squeeze, particularly if SOL breaks out of $61.
Regarding DCA’ing for SOL, we’ll add to our long-term bags if SOL can pull back to $52 with light DCA Spot buys. If SOL pulls back to $48, we’ll be even more aggressive with our DCA Spot buys down to the low $40s.
SOL stages a comeback, sets sights on $61
30 November 2023
SOL has rebounded fantastically and reclaimed its uptrend line.
SOL is holding a local support of $59 but butting into the local resistance of $61.
Pivotal point here for SOL. A breakout of $61 could bring $69 and then $80 into view.
TLDR
SOL bounces back above the key uptrend line and $59 support.
It faces immediate resistance at $61, but a break out to $69 and then $80 is in sight.
Long futures premium indicates bullish sentiment, but this needs to be confirmed.
SOL can still pull back from here and retest $56.
Disclaimer: Not financial or investment advice. You are responsible for any capital-related decisions you make, and only you are accountable for the results. “One Glance” by Cryptonary sometimes uses the RR trading tool to help you quickly understand our analysis. They are not signals, and they are not financial advice.
Technical analysis
SOL has unexpectedly recovered its uptrend line and is now above the local support of $59.
SOL is currently finding resistance at the local horizontal level of $61. A breakout of $61 would bring $69 and then $80 into target.
SOL has a convergence of support just beneath the current price - the local horizontal support of $59, along with the uptrend line. If these levels are lost, $56.40 would be the next horizontal support.
The RSI on all timeframes has reset except the 3D and the Weekly. The 3D has also put in a bearish divergence. On the larger timeframes (3D and Weekly) SOL looks as if it needs a slight pullback.
Market mechanics
SOL’s Open Interest has popped higher again to $840m, just shy of the yearly highs that were put in 2 weeks ago at $933m.
The OI-Weighted Funding Rate has risen from approximately 0.008% yesterday to 0.012% today, indicating that participants are paying a premium to be Long rather than Shorts. This isn’t too out of balance here, but it’s something we should keep an eye on going forward in case this ramps up further.
Cryptonary’s take
Again, SOL has performed very well over the past few days to reclaim some key levels - the uptrend line and the local support of $59.
For SOL to get a more significant upside here, we need to see price break above $61. If that happens, then $69 and $80 would be the two upside targets.
If price breaks beneath $59 and then $56, we would have a downside target of $48.
SOL, like Bitcoin, is very difficult to call here. If we had to call a direction, we would predict that SOL would pull back from here and retest $56. A breakout of $61 would invalidate this, of course.
We’re currently not looking to trade. However, we’re looking to DCA into SOL sub $50 at $48.
Bear flag forming in SOL as uptrend breaks down
28 November 2023
SOL has rebounded into the underside of the horizontal resistance level of $56.40 while forming a bear flag.
Unless $56.40 can be flipped back into support, we likely see a breakdown of the flag with a target of at least $52 - potentially $48.
TLDR
SOL rejected from the $56.40 resistance, now retesting it as a potential barrier.
A bear flag pattern is forming, targeting a breakdown to $52 or even $48.
The uptrend is broken, and SOL is still overbought on higher timeframes.
Watch for volatile breakouts. We will be making aggressive buys below $48.
Technical analysis
Price has broken below the horizontal support of $56.40 and is now retesting the underside of it as a new resistance. If price can’t get back above and flip into support, we likely get further downside.
Price has also formed a bear flag with a breakdown target of $52.
SOL is still beneath its main uptrend line and will likely see further downside in the short term.
The RSI has reset on all timeframes except the 3D and the Weekly, with both still being very overbought.
The major supports are $48 and $52. We would be DCA buyers at both price points.
Market mechanics
Open Interest remains high at $769m, indicating that the market is still somewhat overheated here.
The OI-Weighted Funding Rate is at 0.0080%. This suggests there is a clear balance between Longs and Shorts. And, when we see the Long/Short ratio at 0.9944, we can see just how balanced Longs and Shorts are here.
The mechanics are showing a healthy setup overall despite the level of leverage being slightly on the higher/overheated side.
Cryptonary’s take
SOL is at a critical level here. If it can clear above $56.40 and turn the local resistance into new support, then further upside may be had. However, SOL is in a bear flag pattern, beneath the $56.40 horizontal level and the main uptrend. This should have a downside target of $52.
If SOL reaches $52, we would be DCA buyers at that price point. If SOL can reach sub $48, that’s where our DCA buys would become more aggressive.
SOL buckles below support - Will it retrace back to $48?
27 November 2023
SOL is breaking below a main uptrend line and the local horizontal support of $56. The target would be $52; if $52 is lost, then $48 is on the cards.
We may move back to $57 first, but we see $52 as a very likely target for SOL.
TLDR
SOL breaks below the uptrend line and support at $56.
The minimum downside target is $52, but $48 is also in play.
Shorts outpacing longs signals fading momentum.
Long-term buys are near $44 if there is a deeper pullback.
Technical analysis
Price battled at the local horizontal support of $56 since Thursday of last week. However, price has now broken below.
On the last meaningful move down, price found support at the main uptrend line. However, price has now retested the uptrend line and broken below it on the 4hr and 12hr timeframes.
It’s possible SOL can retest back into the horizontal level of $56.40 and reject from the underside of the resistance.
The technicals suggest that SOL could head substantially lower, to $52 and even $48.
The 3D and Weekly RSI both remain in overbought territory.
Market mechanics
Open Interest is not far off its highs again, now back to $795m, up 20% in the last few days.
The OI-Weighted Funding Rate is at 0.0095%, indicating a slight bias to be Long but that Longs and Shorts are in even balance. However, the OI-Weighted Funding Rate has come down from 0.0150% since yesterday, indicating that more Shorts have come in whilst some Longs have closed out.
We can see this from the Long/Short Ratio at 0.9142. More market participants have chosen to Short in the last 24 hours than Long.
Cryptonary’s take
From a mechanics perspective, SOL looks similar to ETH and BTC, with Shorts piling in over the last 24 hours, but this is not alarming enough. However, from a TA perspective, SOL looks like it’s due for more downside. We see $52 as a minimum target, with the potential for price to visit $48 also.
If SOL can reach $48, we would be DCA buyers of SOL at this price, while we would become aggressive DCA buyers of SOL sub $44.
If SOL retests the underside of the horizontal support/now turned resistance at $56.40, that may provide a trading opportunity to Short SOL into the underside of that horizontal resistance. But for now, we wait and remain patient.
Solana bulls on thin ice as price puts in lower highs
24 November 2023
SOL is at an inflection point here, putting in lower highs on decreasing volume. A move lower would see the main uptrend be tested again.
If the local support of $56 breaks, the uptrend line must act as support. Otherwise, we could see $48.
TLDR
SOL is rejecting lower at $58-59 and unable to break higher.
Loss of support, decreasing volumes and lower highs signal weakening.
The breakdown of the uptrend could trigger a drop to $48.
Signs point to further pullback ahead before the bottom.
Technical analysis
Price currently holds above the local support of $56, but we’re seeing SOL reject into the local level of $58 to $59.
At this level, SOL is okay. However, if there is a break beneath $56, that would bring the main uptrend into sight. If the main uptrend line is broken, that could be what sends SOL to $48.
A reclaim of $61 would take SOL back above the neckline of the head and shoulders. That’s what we’d be waiting on for further bullish momentum.
The RSI has reset on all timeframes except for the 3D and Weekly, which remain extremely overbought.
Market mechanics
Open Interest has risen to $725m again, which remains well above the yearly average. However, it seems Open Interest is consolidating at higher levels as SOL is more heavily traded than it was 6-12 months ago.
The OI-Weighted Funding Rate is flat at 0.01%, indicating a slight bias to be Long but that Longs and Shorts are in even balance. This is healthy from this perspective.
Cryptonary’s take
From a market mechanics perspective, SOL looks to be in a healthy spot. However, the technicals suggest signs of weakening, with some key levels below the current price. If price loses $56 and can’t hold the main uptrend line, this would likely see a deeper pullback, with a potential target of $48.
SOL will likely need a Bitcoin breakout for its bullish momentum to continue. SOL is showing signs of weakness, particularly in the decreasing volumes.
We remain patient with SOL here as we feel it has further room to pull back when considering the above. We would look to begin adding to our bags with light DCA orders at $48 and lower. If $44 is presented, we’d be more aggressive with our DCA orders.
SOL’s price indecision leaves the next move unclear
23 November 2023
OL is now finding a local resistance at $58-59, which converges with the underside of the head and shoulders neckline.
SOL has broken out of its local downtrend. However, the 3D and Weekly RSI's still remain very overbought.
Big inflection point here for SOL.
TLDR
Solana bounces off $52 support, now facing resistance at $58-59.
This area coincides with the underside of the head & shoulders pattern neckline.
Indicators mixed - RSI reset, but 3D and weekly timeframes overbought.
At the inflection point that may depend on whether Bitcoin breaks the range.
Technical analysis
Following the breakdown from the head and shoulders pattern, SOL bounced well from the local support of $52.
SOL is now finding resistance at the underside of the neckline of the head and shoulders.
There is local support at $56 and $52, and beneath that, $48 and $44. A break of $52 would see a price break beneath the main uptrend line, which may cause a deeper sell-off.
$44 - $48 would be a good area for long-term DCA buys.
The RSI has reset on all timeframes; however, the 3D and Weekly both still remain extremely overbought.
SOL is hard to call here from a technical perspective. The market as a whole seems to be at an inflection point that may depend on what Bitcoin does. Let’s take a look at the mechanics first.
Market mechanics
Open Interest has increased again back into the $722m level. This is arguably still overheated and may need to come down to the $500m mark to flush out some excess leverage.
The OI-Weighted Funding Rate is flat at 0.01%, indicating there is a slight bias to be Long but that Longs and Shorts are in even balance.
Ideally, you’d want to have seen a slight decrease in Open Interest over the past few days on the price movements lower, which would likely come if price moved down to $48. However, the setup is relatively healthy here, with neither side (Longs or Shorts) being majorly offside.
Cryptonary’s take
SOL, like several coins, is at an inflection point. Many coins have moved higher, breaking out of local downtrend lines and now running into local resistances.
We remain cautious on SOL, particularly whilst Bitcoin is beneath $38,000. However, if Bitcoin can get the breakout, SOL will likely retest its highs at $67.
If SOL breaks down, we will be DCA buyers at $48 and aggressive DCA buyers at $44, with a 12 to 18-month time horizon.
Currently, SOL is very hard to call; if we had to choose a direction, we would say that a breakout is more likely. But it’s very difficult to call, and we’re currently 50/50 on short-term direction.
Is SOL set to plunge as the bullish neckline snaps?
22 November 2023
SOL broke beneath the neckline of its head and shoulders pattern but bounced from the support at the main uptrend line and the horizontal level of $52.
We may get a retest of $52. If broken, SOL likely tests $48 - a key level.
Technical analysis
SOL is currently rebounding from the $52 support. We see a retest of this level as likely, and it's pivotal for SOL to defend the main uptrend line. • If the $52 area is lost, price likely sinks to $48.
The local resistance is at $55 to $56.40. On the 4hr, it looks to be getting rejected. This is the first battle for bulls to win if they want to see further upside.
The RSI on all timeframes, except the 3D and the Weekly, have reset substantially, indicating that the market is far less overbought than it was a week ago.
Market mechanics
The level of Open Interest has pulled back substantially, from $933m 6 days ago to $655m today. But this is still arguably somewhat overheated, particularly when comparing it to prior months.
The Funding Rate has remained between 0.006% and 0.010%, indicating a healthy balance between Longs and Shorts, with the overall bias amongst traders to be Long. Overall, this is a healthy setup from a mechanics perspective.
Cryptonary's take
SOL has responded well having bounced from the support of the uptrend line and the horizontal level of $52.
However, it now finds resistance between $55 and $56.40, and with Bitcoin seeming to struggle to push higher, it's becoming more likely Bitcoin will retest it's $35,600 support and this could drag the market down with it.
This could bring SOL down to $52. In terms of upside, if $56 is cleared, then $61 is the target, but we think there can still be a further pullback here.
We remain DCA buyers of SOL if price pulls back to $48, with our DCA buys becoming more aggressive sub $44.
We will look to hold these positions for 12-18 months.
Solana is facing downside pressure despite healthier mechanics
21 November 2023
Solana sits beneath a technical cliff in the form of a head and shoulders pattern, which has already seen a breakdown beneath the key neckline.
Despite some relief in market conditions like open interest and funding rates, SOL remains overstretched on larger timeframes - spelling danger for further downside ahead. Where does SOL go from here?
TLDR
SOL has formed a bearish head and shoulder pattern.
Price broke below the neckline, and it rejected on the retest of the underside.
Market mechanics like open interest are more balanced, but SOL is still overbought on higher timeframes.
SOL will likely drop to test supports at $55, $52 and potentially $48.
Technical analysis
We’ve looked at SOL on the 4-hour timeframe to get a clearer perspective on the setup.
SOL is currently in a head and shoulders pattern that looks to have broken beneath the neckline. Price has retested the underside of that neckline and has initially rejected from that level.
Local supports are at $55 and $52, but the major horizontal support is between $47 and $48.
For SOL to see more considerable upside, it must first reclaim above the head and shoulders neckline.
If the $48 support is broken, the next target would be $44.
If price does break down, a key level to watch is the main uptrend line (thicker yellow line), as this should act as a support, at least locally.
Market mechanics
The mechanics for SOL are interesting here. Let’s take a look:
Open interest remains really high, currently at $730m, well above the $200-300m average we’ve had over the past year.
The OI-weighted funding rate is at 0.0113%. This means longs and shorts are in much more of an even balance - this is a healthy setup. However, the funding rate is turning up, so we will need to see if this continues, as it may indicate that longs are beginning to pile in after more participants went short yesterday. The long/short ratio is at 0.9406.
There is still a large build-up of leverage in SOL, but there is a more even balance now between longs and shorts.
Cryptonary’s take
The mechanics’ setup is certainly better than what it was a week or so ago. However, the technical setup looks as if more downside is needed. On the major timeframes (3D and Weekly), SOL is very overbought, and a pullback in price would be healthy.
SOL will likely hold up if Bitcoin does. However, BTC seems to be rejecting from the key resistance of $37,700 to $38,000, which could help bring SOL down further to at least testing the $55 level and then the $52 level beneath that.
We expect SOL to see more downside in the coming week, with $52 as a minimum target.
We would be DCA buyers of SOL at $48, whilst we’d be aggressive DCA buyers sub $44 if given this price.
Solana is gearing up for a trend-defining move
20 November 2023
Volatility is building, and Solana looks ready for its next major trend-defining move.
While SOL has held support around $55, the key level to watch is the overhead resistance of $80. A decisive break above $55 could send SOL on a rally towards $100.
However, the technicals also suggest the potential for a pullback, especially with indicators extremely overextended on the 3D and weekly timeframes. With open interest still elevated but positioning balanced, risks appear two-sided for SOL.
TLDR
SOL deals with critical horizontal support at $55 and resistance at $80.
A head & shoulders pattern on 12hr could trigger a move to the low $50s, but SOL is clinging onto the uptrend.
Open interest remains high, positioning balanced, but overbought on larger timeframes.
We recommend that traders await high conviction signs of a break in either direction before trading.
Technical analysis
SOL looks interesting from a technical perspective here.
SOL is still within its local and main uptrends - positive for continued bullish momentum.
The local support is at $55, with the major horizontal support at $47 to $49. The overhead horizontal resistance is at $80. So, if SOL can break above $67, then $80 would be the next higher target.
The RSI on the 12-hour and the daily timeframes have reset and are now back below overbought territory. However, the 3D and weekly timeframes are still extremely overbought on the RSI and, from this indicator, look relatively toppy.
Market mechanics
The mechanics for SOL are much healthier than they have been, but there is still some froth. Let’s take a look:
Open interest remains high, currently at $770M, well above the $200-300M average we’ve had over the past year.
The OI-weighted funding rate is at 0.0099%. This means longs and shorts are in much more of an even balance - this is a healthy setup.
The long/short Ratio is at 0.9885, suggesting more participants have gone short rather than long over the past 24 hours, but it is not at an alarming margin. This shouldn't be a big concern for us.
There is still a large build-up of leverage in SOL, but there is an even balance between longs and shorts.
Cryptonary’s take
While there is a large leverage build-up, positioning is now in better balance, meaning neither side is heavily offside and vulnerable to a squeeze. However, if there is a meaningful move in one direction, we’ll likely see that side be squeezed, pushing the price further.
Looking at the technical analysis, we can see a unique head and shoulders pattern forming in the 12-hour timeframe, which could see SOL move down to the low $50s. With the 3D and weekly RSI’s still heavily overbought, there is convergence for a significant price move down, as this would also flush out some of the excess open interest.
In the short term, we’re not looking to trade SOL. It looks as if a further move down could be on the cards, but without longs becoming meaningfully offside, price may continue to grind higher also. Based on our current information, this only offers a low risk/reward for a trade. Hence, we’re not taking any action.
If SOL falls to $48 or below this level, we will add more to our DCA bags.
Solana struggles for traction after facing resistance at $67
17 November 2023
The Solana party has screeched to a halt, at least temporarily. After topping out around $67, Solana was harshly rejected and started a significant pullback. This rejection has stunned Solana bulls, with bearish momentum now taking hold. Overbought indicators that were screaming for a retracement have started to unwind, while SOL has also printed a bearish divergence on the daily chart.
TLDR
SOL hit resistance and topped out around $67, now pulling back.
Bearish divergence and overbought indicators suggest retracement ahead.
The futures market is still elevated, but longs/shorts are more balanced.
SOL keeping support at $48 is critical, but we may go for aggressive buys under $42 if the level is breached.
Technical analysis
After putting in what seems to be the local high at $67, SOL has begun to move lower. Is the move over?
After putting in a new high at $67, SOL put in a bearish divergence by creating a higher high in price and a lower high on the oscillator while also in overbought territory.
The local support is currently at $55, which needs to hold, or there will be a clear path down to $48.
The 3D and the weekly timeframe remain heavily overbought, suggesting that a more substantial pullback may be needed to reset some of these indicators back to more neutral and healthy levels that price can then move higher from again.
Market mechanics
The futures market behind SOL remains somewhat overheated but with longs and shorts coming into a more even balance.
In the last month, SOL’s open interest has gone from $300M to $933M yesterday, and it is now back down to $780M following yesterday’s move down in price.
The funding rate has decreased from a very high to 0.0120%. Still, the long/short ratio is at 0.9286 - this means that over the past 24 hours, shorts piled in, which has helped bring the funding rate down to more neutral levels, indicating that the futures market is in a better balance between longs and shorts.
Cryptonary’s take
Less so now from a mechanics view, but from a technical analysis view, SOL remains overheated with a more meaningful pullback underway. The mechanics side of the market is overheated but with no major bias from the market towards being long or short.
The main support for SOL is at $48. If SOL reaches this price point, we will be DCA buyers for SOL over the long term. If SOL breaches below $42l, we will be aggressive DCA buyers of SOL at those prices.
In the short term, we are not looking to take any action on SOL.
Can SOL breakout to $80 as bulls regain control?
15 November 2023
After shrugging off the market-wide deleveraging, Solana appears poised for liftoff. SOL held critical support at $52 while broader crypto assets pulled back. The mechanics are aligning for SOL to push towards the key target of $80. Here’s how to play SOL from here out.
TLDR
SOL held critical support at $52 during the market pullback.
Bull flag breakout targeting $80, key support at $48.67.
Funding rates and open interest are reset; market mechanics align for a move higher.
We are bullish long-term – SOL is a top contender for the next bull run.
Technical analysis
After SOL had a pullback to $52 yesterday, it was quickly bought up, and now SOL is retesting its highs at $63. The upside target for a breakout is $80, with the main support at $48.67 if SOL turns lower. For now, SOL remains in the local range of $52 to $63.
When looking at the RSI, we’re very overbought on the 3D and weekly timeframes, along with the daily timeframe, which is also now putting in a bearish divergence. We should note that we have had several of these, and they haven’t led to any meaningful pullbacks yet.
Market mechanics
The funding rate for SOL has been extremely volatile, leading to volatile price action and vice versa - a vicious cycle. The funding rate has now reset to less exaggerated levels but remains very positive at 0.0187%. There is still a bias to be long.
The open interest remains high despite the fact there was a flush lower yesterday. Open interest is straight back up to where it was just 24 hours later, with the funding rate coming down. This suggests an even balance between longs and shorts over the last 24 hours regarding participants. But, there is this slight bias overall to be long on SOL.
A further flush-out will likely be needed at some point, but we may see open interest increase first in the short term.
Cryptonary’s take
SOL is still overheated here, but with BTC and ETH seeing somewhat of a flush out yesterday, the market as a whole may have some room to go slightly higher, and considering how well SOL held up yesterday, it’s possible SOL gets further upside in the short-term.
In the short-term, we’re very 50/50 on SOL, as it is quite capable of continuing on higher, but it is also overheated, and we would expect a deeper pullback at some point that would flush out the excess leverage. Does that come now or at a higher price? It is hard to say; we, therefore, have a low conviction on SOL’s direction in the short-term.
For the long-term, we see SOL being a front-runner in the next bull run, and today’s price is still relatively cheap if you have a 12-18 month time horizon.
SOL at risk of further downside unless BTC gets ETF boost
14 November 2023
After surging to new highs recently, Solana has experienced a sharp 9% pullback. SOL remains overheated across most timeframes despite some cooling off in leverage metrics.
While the $57 zone should offer stiff resistance on any bounces, SOL looks vulnerable to further downside without a catalyst like SEC approval for a Bitcoin ETF to boost the broader market.
TLDR
SOL pulled back around 9% from recent highs, testing support around $47-49
Its key resistance sits around $57; support levels are at $47-49 and $41-43.
RSI overbought on multiple timeframes, so a consolidation is on the cards.
SOL may be stuck in rangebound action between $42-49 until we get a catalyst like BTC ETF approval.
Technical analysis
As we suggested yesterday, SOL was looking relatively top-heavy, and we now find price down approximately 9% from yesterday’s update.
The major support area below the current price is between $47 and $49. We expect this level to act as support, with spot buyers potentially coming in at this price point. Beneath that, $41 to $43 is a big area of support. To the upside, the resistance is at $57.
The RSI remains overbought on the daily, 3D and weekly timeframes, with the larger timeframes looking like they need a more meaningful pullback. Because of how strong SOL has been, we’ve seen higher highs in price and on the oscillator, so there aren’t any bearish divergences to be concerned about here.
Market mechanics
The funding Rate for SOL is back to healthy levels at 0.0114%. It’s come down from very positive levels.
The open interest remains high. So, with funding rates being massively positive and then coming down significantly, and the long/short ratio at 0.9433 over the past 24 hours, this all suggests that shorts have piled in over the last day, while some longs have taken some profits. As price came down yesterday, longs took some profits while shorts piled in. These late shorts may get squeezed here - something to watch out for here.
Cryptonary’s take
If the market (BTC) holds up today, in the short term, we could see a slight squeeze to the upside for SOL to shake out some of yesterday’s late shorts that piled in.
However, we feel SOL is still overheated. Unless a Spot BTC ETF is approved this week (what we think is needed to give the market another major leg higher), then SOL is likely due for some more downside or a more consolidatory period. This consolidatory range may come in between $42 and $49.
If we get this price point ($42 to $49), we would be DCA buyers of SOL at those prices with a long-term view.
In the short term, volatility can remain, so be careful on trades, as the volatility can shake you out.
Red Alert: Solana screams overbought as bears circle below
13 November 2023
The SOL rocket may have flown too close to the sun. After a parabolic surge higher, Solana now looks dangerously over-extended on virtually all technical levels.
Key resistance rejected the price spike as shorts began to circle, smelling blood in the water. SOL partied like it would never end, but the lights are now flickering. A painful correction likely awaits, so strap in for some turbulence.
TLDR
Solana is extremely overbought on all key timeframes with correction overdue.
Initial rejection from $63 resistance shows profit-taking kicking in.
High open interest and reducing funding rate point to shorts piling in.
There is an urgent need for a consolidatory period before SOL can take off again.
Disclaimer: Not financial or investment advice. You are responsible for any capital-related decisions you make, and only you are accountable for the results. “One Glance” by Cryptonary sometimes uses the RR trading tool to help you quickly understand our analysis. They are not signals, and they are not financial advice.
Technical analysis
From a technical perspective, SOL is beginning to look a little top-heavy here. In the two weekend’s daily candle closures, we saw that price spiked into the $63 - $64 area and rejected back into the last $50’s. This indicates some clear profit-taking and is likely a relatively wise decision in the short term.
There is around $56, but the next major support beneath that is $48.67. We may see the sellers of SOL in the low $60’s re-buy SOL in the last $40’s to early $50’s.
The RSI is frightening. The daily, 3D, and weekly timeframes are all well into overbought territory, yet we haven’t seen any bearish divergences put in. However, we would suggest some caution here because of how overbought SOL is.
Market mechanics
The funding rate for SOL is ok. It’s come down from phenomenally positive levels but does remain quite high at an OI-weighted funding rate of 0.0227%.
The open interest, however, is the concern. It remains very high. This suggests that as the funding rate has come down over the past 8-16 hours, but with open interest remaining very high, shorts have begun to join the party, and there is now a more even balance between longs and shorts, with retail dominating the longs.
Cryptonary’s take
SOL has been a phenomenal performer recently, and of course, it could have a further leg higher.
However, the technicals suggest that SOL is now very top-heavy and needs a pullback and a consolidatory period before it can move more meaningfully higher again. We’re beginning to see this in the futures market. Open interest remains high, shorts have begun to join the party, but longs remain dominant. Also, the long/short ratio suggests that retail is on the long side.
We would exercise caution here. If SOL moves lower, we will add to our long-term spot bags beneath $49.
Again, if an ETF is approved this week, this can be the anomaly that sends the market higher in the very short term.
SOL isn't slowing down: Will it shatter $50 and soar to $80?
10 November 2023
We are all witnessing SOL’s relentless ascent and are in awe of its remarkable rally. The question on everyone's mind: can SOL break through the formidable resistance zone between $48 and $50, opening the door to the significant $80 mark? Right now, it's hard to bet against SOL.
TLDR
Solana (SOL) eyes a break above the $48 to $50 resistance level.
Overbought RSI signals caution as SOL continues its upward march.
High leverage and strong long bias in market mechanics raise concerns.
We advise long-term SOL investors to stay put and consider increasing exposure at lower levels.
Disclaimer: Not financial or investment advice. You are responsible for any capital-related decisions you make, and only you are accountable for the results. “One Glance” by Cryptonary sometimes uses the RR trading tool to help you quickly understand our analysis. They are not signals, and they are not financial advice.
Technical analysis
The monster continues and looks primed to potentially break above the $48 to $50 resistance area. If SOL can break higher, there is relatively clear headway for SOL to push up to $80, although there’s a local resistance at $58.
The next supports to the downside are at $42.50 and then $38.
The RSI’s on the daily, 3D timeframes are as overbought as they’ve ever been. There will need to be a pullback at some point. However, the key is identifying the level from which SOL eventually decides to pull back. The weekly RSI is also now well into overbought territory.
Market mechanics
The funding rate for SOL has moved higher to being very positive again, indicating a strong bias to be long. Now, longs are willing to pay a substantial premium to be long. However, the open interest has actually come down over the past few days. However, it does remain at a high level - the highest it's been since August 2022. This suggests that the leverage market is well overheated here, and it’s once again heavily sided towards longs - usually resulting in some form of flush-out if price can decline enough to trigger long liquidations.
Cryptonary’s take
Even though SOL can continue to move higher, we are more cautious now than we have been recently due to the magnitude of the move up and the overheated derivatives market.
We love SOL long-term, and if you’re in from a low-cost entry, we won’t encourage selling your SOL, as we also look to ride it for the bull market. We would look to increase exposure under $42.50 and become more aggressive in DCA buys sub $38 if SOL moves lower in the coming weeks/months.
We would suggest not aggressively trading SOL simply due to the amount of volatility and its capability of chopping traders up in the volatility.
Can SOL shine brighter in a BTC-dominated market?
09 November 2023
Solana approaches a crucial showdown at the $48 resistance level, and the market is bracing for potential fireworks. But with overbought signals flashing and Bitcoin's dominance in mind, is Solana's rise about to slow down, or does it have more room to shine?
TLDR
SOL faces a major challenge at the $48 horizontal resistance level.
Overbought RSI on daily, 3D, and weekly timeframes raises caution for new long positions.
Major support lies between $37 and $38, making it an attractive entry point.
Funding rates are positive but not excessively high, indicating a relatively healthy setup.
Disclaimer: Not financial or investment advice. You are responsible for any capital-related decisions you make, and only you are accountable for the results. “One Glance” by Cryptonary sometimes uses the RR trading tool to help you quickly understand our analysis. They are not signals, and they are not financial advice.
Technical analysis
Following SOL breaking out from its bullish pennant pattern, we now see SOL moving into the horizontal resistance level of $48. This is a key level for SOL to get above. If it can, this opens the door for a move up to $80 over the medium term.
However, the $48 is such a major resistance that we’d be surprised if SOL doesn’t have a more meaningful pullback from this level, particularly if BTC can’t break above $38,000.
The RSI on the daily, 3D and Weekly are all majorly overbought, so we’re cautious about adding new longs/buys to SOL at the current price point.
The major support for SOL is between $37 and $38. We would be strong DCA buyers at this price point.
Market mechanics
The funding rate for SOL is positive, but not overly so, while the open interest is still high. And even with high open interest, this is still a relatively healthy setup.
The mechanics for SOL suggest there can be more upside, although other trading indicators are massively overbought.
Cryptonary’s take
If BTC continues, then SOL can get further upside, but it’s likely to underperform here, considering how much it’s already moved higher.
If SOL does move lower, say sub $38, we would be aggressive DCA buyers for the long term. Due to the general market being somewhat overheated here, we would be cautious about adding new positions and await a more meaningful pullback.
Solana almost at $45: A breakout or fakeout?
08 November 2023
Solana has been on an absolute tear lately, smashing through overhead resistance like a hot knife through butter. The price recently moved closer to $45. However, what goes up must come down. Signs are emerging that Solana's parabolic ascent is starting to lose momentum.
TLDR
Solana heads toward $45 but faces signs of overheating, like high funding rates.
Very overbought on the daily/weekly timeframes; correction overdue.
Upside is still possible near-term to $48 area before a larger pullback.
Long-term bullish, but exercise caution trading here; reduce leverage.
Disclaimer: Not financial or investment advice. You are responsible for any capital-related decisions you make, and only you are accountable for the results. “One Glance” by Cryptonary sometimes uses the RR trading tool to help you quickly understand our analysis. They are not signals, and they are not financial advice.
Technical analysis
When we covered SOL yesterday, we suggested that it’s forming a pennant, similar to how it did a week or so ago and had a major breakout to the upside. SOL is now trying to get a further breakout, although it was initially rejected at the $45 area. The critical range for SOL is the $37 to $48 range. However, we do feel that the local top will be around the $48 area if SOL does move higher.
When we look at SOL on the 1D and 3D timeframe, it’s extremely overbought, and we would expect a pullback at some point in the coming weeks/months, even if that means SOL can continue higher in the very short-term - topping area around $48.
Market mechanics
The funding rate for SOL is positive but not frothy and overheated. The open interest is increasing and is at monthly highs. This is beginning to move into overheated territory, and therefore, we would exerise caution here. We do see a flush-out occurring in the coming weeks. With everyone bullish, it’s likely the flush-out is to the downside.
Cryptonary’s take
We still love SOL for a long-term play. However, we think it’s getting somewhat overheated here, even though we think it’s possible that SOL can move higher into the $45 to $48 area in the very short term.
We’re not looking to actively trade SOL here, although we’ll be DCA’ing into any dips below $38 and aggressively DCA’ing into anything sub $33.
SOL can chop around in the range in quite a volatile manner. So, we would exercise caution here, and if you are going to trade, reduce leverage and leave yourself wide room to allow for price fluctuations. Otherwise, you can be easily shaken out and lose money.
SOL is at a crossroads between breaking up or breaking down
07 November 2023
With its price action painting another pennant on the charts, SOL is set to get a big wave that will push us into more upside or downside. High leverage and a bullish bias hint at a potential long squeeze on the horizon. So, should you dive in now or wait for calmer waters?
TLDR
SOL is forming a pennant pattern, indicating a potential breakout aligning with Bitcoin's next move
However, technicals place it in a precarious position, with the RSI normalising on shorter timeframes but remaining overbought on longer ones.
The market dynamics suggest a strong current long bias that could be ripe for a shakeout.
We recommend caution with SOL's current state. Consider Dollar-Cost Averaging on dips below $37, and buying aggressively below $32.
Disclaimer: Not financial or investment advice. You are responsible for any capital-related decisions you make, and only you are accountable for the results. “One Glance” by Cryptonary sometimes uses the RR trading tool to help you quickly understand our analysis. They are not signals, and they are not financial advice.
Technical analysis
Looking at SOL in the 12-hour timeframe, we see it forming another pennant pattern. This will likely break out along with the BTC breakout. Now, whether that be up or down will likely depend on which side of the orderbook is squeezed. The major support for price will be the $37 to $38 levels, with the $32 to $33 area being the major support beneath it.
We like these lower levels, particularly the $32 to $33 area for long-term accumulation of SOL for the next bull run.
Market mechanics
The RSI on the 12hr is now back into more normal territory, but the daily and especially the 3D timeframes remain very overbought. A resetting of these should see a more meaningful pullback for price.
When looking at the mechanics, the funding rate for SOL is very positive, while the open interest remains high. This suggests there is a bias to be long, and therefore, there may be a flush out of these longs. If BTC breaks down, we could see a more volatile flush out for SOL, potentially reaching the $37 to $38 areas.
Cryptonary’s take
We remain cautious about SOL at the current price levels. Our caution is based on how the leverage is built up and how the market is positioned. Also, seeing that BTC is looking very heavy in terms of being over-leveraged, caution is the logical path.
If we do see a flush out of the leverage, we feel it’ll likely be long liquidations and therefore price will have declined. If price moves below $37, we suggest this can be a good area to begin lightly DCA’ing for the long run, with more aggressive DCA’ing coming if we see SOL below $32.
No major pullbacks on SOL: Will $48 cap the rally?
06 November 2023
SOL maintains a high price without experiencing any major pullback as of yet. In fact, "Steady as she goes" might well be the motto for Solana's current market performance.
In a space where volatility is the norm, SOL's price resilience stands out. Without any major pullbacks on record yet, what’s the best entry price for long-term players? Let's dive into what is in store for Solana.
TLDR
Solana has established a new price range between $37 and $48, with current indicators suggesting a short-term cap at $48.
Technical analysis proposes that a dip below $38 could offer lucrative long-term buying opportunities for SOL.
RSI levels imply overbought conditions, hinting at a potential pullback, yet strategic buying below key levels is advised.
We remain bullish on SOL's long-term prospects and recommend aggressive buying strategies below $33 and strong buys below $38.
Disclaimer: Not financial or investment advice. You are responsible for any capital-related decisions you make, and only you are accountable for the results. “One Glance” by Cryptonary sometimes uses the RR trading tool to help you quickly understand our analysis. They are not signals, and they are not financial advice.
Technical analysis
From a technical analysis point of view, the new range for price is $37 to $48. We feel that the $48 is unlikely to be broken to the upside in the short term and that SOL will remain range-bound.
If the $37 support is broken and SOL tests lower, the $32 to $33 area looks like a great long-term buying opportunity. However, in our opinion, anything sub $38 is a great long-term buying opportunity anyway, and DCA’ing into prices sub $38 should give you great buys for the bull run.
Mechanics
The RSI on the daily is coming down somewhat but remains in overbought territory, while the 3D RSI is very overbought, the most since September 2021. We would remain cautious on SOL as we feel a pullback is possible, but as we’ve mentioned above, we would be net buyers sub $38, and we would be aggressive buyers sub $33.
The funding rate is still positive, and open interest is high; again, this would suggest some caution.
Cryptonary’s take
We’re big fans of SOL for the long term, as we expect it to at least touch all-time highs in the next bull run. Therefore, we would be strong buyers below $38, and even more aggressive buyers sub $33.
SOL is no longer defying gravity
03 November 2023
What goes up must come down, or at least in the case of Solana, catch its breath.
SOL is finally having that major pullback after skyrocketing more than 100% in two weeks. Where is SOL headed next? Let’s find out.
TLDR
SOL has experienced a significant pullback down to the $37/$38 levels.
Short-term prospects depend on whether $37 support holds and forms a new range.
RSI indicates overbought conditions, while funding rates and open interest suggest caution.
SOL's fate is tied to Bitcoin's performance at this point.
Disclaimer: Not financial or investment advice. You are responsible for any capital-related decisions you make, and only you are accountable for the results. “One Glance” by Cryptonary sometimes uses the RR trading tool to help you quickly understand our analysis. They are not signals, and they are not financial advice.
Technical analysis
SOL has rejected into the $47/$48 area, and now price has moved down to $37/$38, which we have as a horizontal support level. If this level is lost, the next level is $32.50 to $33.00. We like this area for long-term entries for SOL.
Ideally, in the short term, we’d like to see the $37 horizontal support hold as new support and SOL build a range at this higher price point. This is something we’ll have to assess going forward.
If BTC pulls back more considerably, SOL will likely struggle with the rest of the market. Again, it’s very hard to read here as it will depend on whether the key levels for BTC are lost or not.
RSI and funding rates
The RSI on the daily timeframe is still very overbought, which suggests SOL can see further downside. However, the positive (if you can take it as a positive) is that SOL hasn’t created a bearish divergence.
We need to be ultra-careful here. SOL’s funding rate is very positive again. Also, the open interest is going meaningfully higher… again. This suggests an overheated derivatives market that is being longed quite heavily. Therefore, it is potentially vulnerable to a shakeout, which could see further downside. Again, be careful here.
Cryptonary’s take
Currently, our conviction level for the market's next move is quite low. It’s very hard to see what’s coming with BTC at key levels and alts ultimately being dependent on BTC’s movement.
Action
We would remain cautious on SOL here.
For long-term entries, we like SOL below $32.
The long-term target for SOL is the prior all-time high of $255.
SOL skyrockets 102% in two weeks: What's next?
02 November 2023
SOL recently stole the spotlight with a breathtaking ascent. And when most people thought SOL would tire out, a major change in mechanics saw it move drastically higher. Can SOL continue its massive ascent higher?
TLDR
SOL has surged 102% in just two weeks, smashing through resistance levels.
We suggest accumulating SOL on meaningful pullbacks, especially if it retests levels below $37 or $32.
Long-term investors with sub-$30 entry points can hold with confidence.
Traders should consider profit-taking near $45 to $48 and re-accumulating below $38 in the medium term.
Disclaimer: Not financial or investment advice. You are responsible for any capital-related decisions you make, and only you are accountable for the results. “One Glance” by Cryptonary sometimes uses the RR trading tool to help you quickly understand our analysis. They are not signals, and they are not financial advice.
Technical analysis
Following a monster move that has smashed through almost every horizontal resistance in its way, SOL has now approached the $48 - $50 horizontal resistance level/zone. Note: SOL is up 102% in two weeks, so at some point, a more meaningful pullback will likely occur.
We believe that in the short-term, SOL’s horizontal resistance zone of $48 to $50 will act as resistance, and price may get a more meaningful pullback in the coming weeks. Immediately, we would look to the $37/$38 area as being a support with the next support at $32/$33.
RSI and funding rates
The RSI on the daily is extremely overbought at current levels. This is why we are exercising caution here on SOL - or at least, not adding new longs/buys. We would wait on a more meaningful pullback to add new longs/buys.
The funding rate is what moved the price drastically yesterday evening. As SOL moved into the low $40s, the funding rate went deeply negative while open interest increased. This indicated that traders piled into shorts and paid a massive premium to be short. This led to a short squeeze, which saw SOL’s price move higher to liquidate the shorts and burst into the $47 area.
Since yesterday, the funding rate and the open interest have been reset to more healthy levels.
Cryptonary’s take
SOL has moved massively higher. We would look to accumulate more SOL on any meaningful pullbacks. If SOL can retest sub $37, we would look to DCA into this level, and we would look to DCA more aggressively if SOL were to pullback into the $32 area.
Action
If you’re a passive investor and your average entry price is sub $30, feel confident that you can likely continue to hold SOL for the long run.
If you’re more of a trader, the opportunity to profit-take around the $45 to $48 area could come to fruition, to then look to re-accumulate back beneath $38 in the medium term.
Solana's unstoppable rally: Examining the $37.19 to $48 range
01 November 2023
SOL is an absolute monster that continues to outperform.
The question on everyone’s minds now is whether SOL's ascent has reached a point where caution is not just advisable but necessary.
Here’s how to play SOL from here!
TLDR
Solana (SOL) continues to exhibit an exceptional performance.
Caution is advised due to significant overextension in SOL's price.
SOL's current range between $37.19 and $48 is crucial for its medium to long-term prospects.
Despite the overextension, SOL's recent rally can be seen as a correction from the collapse following FTX's November 2022 incident.
Disclaimer: Not financial or investment advice. You are responsible for any capital-related decisions you make, and only you are accountable for the results. “One Glance” by Cryptonary sometimes uses the RR trading tool to help you quickly understand our analysis. They are not signals, and they are not financial advice.
Technical analysis
We initially felt that SOL was up so much that we felt the $37.19 horizontal resistance could act as a reasonable resistance level for SOL. But no, she stormed past that level. SOL now finds itself between the $37.19 and $48 levels.
If SOL can continue in this new range and turn $37 into support, that’ll be hugely bullish for the medium and long term.
The above is the 3D chart for SOL, which does look very over-extended.
However, this move is retracing the downtrend following FTX’s collapse in November 2022, where price fell from $37 down to $13, with a low of $8.
So, this move higher could be argued as just a return to a price level that SOL should be at, having been so massively oversold in the prior 12 months.
RSI and funding rates
When we look at SOL on the daily timeframe, we see that the RSI is very overbought, but it hasn’t put in a bearish divergence. SOL, being this overbought, should encourage us to exercise some caution.
Funding rates have seen a turn. SOL’s funding rate is now negative, indicating shorts have begun to pile in here. With open interest also ramping up, this could suggest that a short squeeze could be on the cards. However, we wouldn’t encourage longing into this simply due to SOL already being largely overbought.
Cryptonary’s take
SOL has performed fantastically and continues to do so.
We would not look to add new positions with the current setup. Instead, we would look to add to our SOL bags for the long-term on more meaningful pullbacks.
Action
We’re not looking to take out new SOL longs/buys at the current price.
We would look to add to our long-term SOL bags on a retest of the $32 - $33 range.
SOL’s speedy rise is impressive, but is it time for a pullback?
31 October 2023
After a spectacular surge that seemed to defy gravity, there's a growing feeling that it might be time for SOL to cool down. The rapid ascent, which we predicted accurately as the "last leg" of its climb, has brought SOL to a pivotal point.
Now, the engines have burned hot, and there's a critical decision to be made. Will SOL push even further, or take a breather and regroup? Let’s find out.
TLDR
Solana (SOL) has experienced a significant upward move, but caution is advised.
Technical analysis suggests a potential resistance at the $37.19 level.
RSI is in overbought territory, and funding rates remain positive.
Expectation of a meaningful pullback to the $32 to $33 range
Disclaimer: Not financial or investment advice. You are responsible for any capital-related decisions you make, and only you are accountable for the results. “One Glance” by Cryptonary sometimes uses the RR trading tool to help you quickly understand our analysis. They are not signals, and they are not financial advice.
Technical analysis
After breaking out of the bull pennant/wedge-like pattern, SOL has shot higher to the $37.19 horizontal resistance that we marked out. Of course,price has now found that level to be a resistance, at least in the short term.
After gaining nearly 90% in just a few weeks, we feel that SOL is at a price point where it will experience a more significant pullback.
If SOL does decide to reject from the $37.19 horizontal resistance, then we would like for the $32 to $33 level to act as a more major support for SOL’s price.
RSI and funding rates
The RSI on the 12-hour did reset slightly but has now moved back into overbought territory following yesterday’s move up into the $37 area. There were several bearish divergences. However, they have been invalidated with yesterday’s new high.
Regarding funding rates, SOL remains very positive. Open interest is now at a high level, suggesting there is a large bias to be long rather than short here.
Cryptonary’s take
Following such a massive move higher, we wouldn’t be surprised to see SOL have a more meaningful pullback where the target area may be in the $32 to $33 range. If BTC can continue higher, SOL may hold up at this high price. We doubt SOL’s ability to immediately break higher into the $40s in the near term just because of how overheated it is.
We, therefore, expect a pullback to the $32 to $33 area before moving higher from there.
Action
If you’re under-allocated to SOL, you should DCA into any meaningful retests.
Price has made that 10% move higher from the low $30s like we were expecting. Now, we feel this is overheated, so a deeper pullback may be on the cards.
If price retests the $32 to $33 area, this may be a good area to DCA into for the long-term.
Will SOL mark top at $37 or will it push higher?
30 October 2023
Just when it seemed like SOL might be running out of steam, it surprised everyone by not just holding its ground but surging ahead. But is this sustainable, or are we in for a reset? Let's unravel the SOL story...
TLDR
Solana's impressive performance continues, defying expectations of a potential slowdown.
A pennant-like pattern indicates a potential target of $37.19 for SOL, but caution is advised as it may signal a local top.
Solana's RSI reset offers potential for upward movement while increasing open interest suggests caution for long positions.
Disclaimer: Not financial or investment advice. You are responsible for any capital-related decisions you make, and only you are accountable for the results. “One Glance” by Cryptonary sometimes uses the RR trading tool to help you quickly understand our analysis. They are not signals, and they are not financial advice.
Technical analysis
SOL formed a pennant-like pattern, although it wasn’t super clean. We did see a slight breakdown of the pennant on Sunday. However, price was able to reclaim and move higher quickly. We’ve now broken to the upside. The next target we feel for SOL is the $37.19 area.
However, we think once $37 is reached, it may be the local top, and we may get a further reset from there. Where that reset goes is hard to know. We may retest the $33 area and test that as new support.
RSI and funding rates
The RSI on the 12-hour has reset somewhat. When in overbought territory, it's really necessary to get a few days of price action where price remains in a range. This essentially helps reset the RSI, allowing the coin to go higher. We remain overbought but at slightly less over-exhausted levels. For now, SOL can continue higher.
Regarding funding rates, SOL remains very positive, but open interest has increased. This indicates that a lot of longs are open on SOL. It’s probably nothing; it is something we should be somewhat more cautious of. However, it isn’t enough to change our view that SOL goes higher from here.
Cryptonary’s take
Having been wrong on SOL, we began accumulating SOL over the weekend, even though we felt we were paying a premium for it. The price we got was $32.50; we’re now close to $35. Sometimes, when the market shows you material strength, the wise man has to adjust to the new data.
There’s no point swearing blindly by an opinion when new data throws that thesis into heavy doubt.
Action
So far, SOL has shown signs of exhaustion, but it has continued to move higher. We must respect the strength of that momentum.
SOL has had an immense move and will likely have a more substantive pullback at some point; however, that may come when the price is another 10-20% higher from here.
If you’re under-allocated to SOL, you should DCA into any meaningful retests.
Can SOL’s rally continue, or is it time for a pullback?
26 October 2023
Today, we are looking at SOL from the 12-hour timeframe on the chart. SOL has displayed a massively positive move, but is it time to be cautious?
Let’s find out.
TLDR
SOL's recent surge prompts caution, with the potential for a short-term pullback.
Key resistance at $32.40 to $33.00, while $30.38 may become new support.
RSI indicators suggest a deeper pullback may be needed to reset momentum.
High funding rates signal strong bullish sentiment, potentially vulnerable to a squeeze.
Disclaimer: Not financial or investment advice. You are responsible for any capital-related decisions you make, and only you are accountable for the results. “One Glance” by Cryptonary sometimes uses the RR trading tool to help you quickly understand our analysis. They are not signals, and they are not financial advice.
Technical analysis
SOL is now battling above the $30.38 horizontal level, now potentially flipping that horizontal level into new support. We currently see that the $32.40 to $33.00 area is acting as strong resistance with sellers appearing. Regarding technical formations, we don’t have too much here; we would need more days of price action.
We do, however, have stronger signals on the indicators. Let’s look into those.
RSI and funding rates
The RSI is key here. We’ve seen 3 higher highs in price, with 3 lower highs on the RSI, all in overbought territory. The latest lower high is underneath the RSI-based MA. This would suggest that SOL needs a deeper pullback to reset some of these indicators.
In terms of funding rates, SOL remains very positive. On Bitmex, the funding rate is 0.0454%, which is big. This shows longs are willing to pay a massive premium to shorts, and therefore very one-sided. And when the market is overly one-sided, that side may be vulnerable to a squeeze.
Cryptonary’s take
SOL has moved up massively in the past week or so. Therefore, you’d expect this to have some pullback/reset, particularly with the trading indicators showing relatively overheated levels.
Action
We’d expect a pullback in price in the short term, where we will look to see if the $30.38 horizontal level holds as new support.
Solana is facing technical resistance after a parabolic surge
25 October 2023
SOL has bounced off the horizontal level of $30.38 and is now pushing to put a higher high on the daily candle. Solana seems to be running out of steam after its parabolic surge.
Here's why we expect a further pullback in the coming weeks.
TLDR
SOL bounced nicely off $30.38 support.
RSI divergences are forming on higher timeframes.
BitMEX funding is very positive, indicating bias for longs.
Expect pullback after the overheated parabolic move.
Disclaimer: Not financial or investment advice. You are responsible for any capital-related decisions you make, and only you are accountable for the results. “One Glance” by Cryptonary sometimes uses the RR trading tool to help you quickly understand our analysis. They are not signals, and they are not financial advice.
Technical analysis
Following SOL’s massive move higher, it was able to get above the $30.38 horizontal resistance. Now, it looks to have initially turned this level into new support, having seen price bounce from this level yesterday. Price has essentially gone straight up, and for now, we need more days’ worth of price action to see what sort of technical pattern forms.
RSI and funding rates
The RSI is interesting here. We see on the 12-hour and the daily timeframes that if SOL does close a higher high today, this will create a bearish divergence in overbought territory. This could potentially drive a sell-off.
In terms of funding rates, it’s very positive. On Bitmex, the funding rate is 0.0215%, which is big. This is Bitmex attempting to bring the futures price back in line with the spot price, as it now trades well beneath the spot price. Hence, a very positive funding rate is offered to entice longs in that should then bring the futures price back in line with the spot price. Essentially, traders on Bitmex are heavily biased toward being long, and they are paying a premium.
Cryptonary’s take
SOL is overheated here. If we can put in a higher high in price today, this would be the formation of bearish divergences on the 12-hour and the daily timeframes. This would indicate that a price pullback is likely.
Action
Not looking to take any action here. We would wait on today’s close to see if a higher high in price comes and if this puts in the bearish divergences.
We feel SOL is overheated here. Therefore, we would expect a further pullback in the coming weeks unless more positive ETF news comes out. This would probably help push the market higher.
SOL skyrockets, but could it stay skybound?
24 October 2023
SOL is overbought. However, it has cleared above its main horizontal resistance of $26. Now, it is in the next range between $30.38 and $37.19.
However, SOL would need to turn $30.38 into new support to fuel further moves higher.
TLDR
SOL exploded above $26 on the horizontal into the $30-37 resistance zone.
It needs to flip $30 into support to fuel further upside moves.
Extremely overbought on daily RSI, so a pullback is very likely.
Long-term still undervalued, 87% below ATH.
Technical analysis
With SOL being this overbought, it can be expected to see a pullback in price. For SOL, the aim should be for price to form new support above the horizontal level of $30.38. It should flip it from resistance and establish it as the new support.
RSI and funding rates
SOL is another overbought asset- it is hitting 81 on the RSI on the daily timeframe. Funding rates are also very positive now, indicating that the positioning for traders is long. Longs are paying shorts the premium to be long.
Conclusion on trading SOL
The overriding feeling here is that the market has gone up massively due to the ETF news, and SOL is, therefore, very overbought. SOL is still approximately 88% down from its all-time highs, so it trades at a significant discount.
Therefore, in the long term, SOL is still undervalued. However, it is so overbought, so, we may see a pullback in price in the short term.
Action
We have identified two yellow box areas below the current price, which could be buying areas if the price has a more meaningful pullback.
Currently, the market is euphoric. In the coming month or two, sentiment may change if a recession comes to the forefront or inflation rears up again, which may see SOL pullback.
Is it time to short SOL?
23 October 2023
SOL has had a huge move so far. However, it now looks phenomenally overheated here; we would exercise caution.
Technical analysis
Overall, it's a really strong move. SOL has smashed through the major overhead resistance at $26 and has tested into the next resistance at $30.40.
After price broke out of the broadening wedge, it formed a bull flag and went meaningfully higher. Just look at this move generally; it’s gone up so much that you’d have to ask yourself how sustainable this is from here.
Let’s assess how overheated this is, and if there is a pullback in price, perhaps the most obvious level is the prior resistance of $26, which may now become the new support.
One main positive is that the volume is good. If this begins to decrease meaningfully, that may indicate the move higher is stalling/coming to an end.
RSI and funding rates
RSI? Where do we start? It’s at 79 on the daily, which is very overbought. The price is currently putting in a higher high at $29.65, while the oscillator is putting in a lower high - bearish divergence, although we need to see how price closes today’s candle.
The funding rate is now very positive, indicating more longs than shorts, while open interest is at $470M – usually around the $330M mark. Open interest is up and relatively weighted towards longs.
This is frightening to play for sure, but if you wanted to short and waited for all the factors to align to do it, this is it; we’re there.
Conclusion on trading SOL
As mentioned above, SOL’s price has gone up massively - up 50% in the past 8 days. The Funding rate is positive, whilst SOL is at a major horizontal resistance of $30.40. Many of the factors align here and favour a short. The market has, however, been phenomenally strong, so shorting into these kinds of levels is frightening.
Action
We are taking the short trade between $29.50 to $30.40, but this is certainly not for the faint-hearted, and unless you’re comfortable with shorting, we’d suggest to steer clear of this.
In general, we would suggest not fomo’ing in here and remaining patient on the sides to accumulate lower as a wise strategy.
The risk to a SOL short is if BTC can break above the $31,300 to $32,000 level and help drive the whole market higher.
Get started for free
Create your free account or log in to read the full article.