Save 23% ($351) & Get a Free 1-1 Call with our Team ⏰ : 0d 2h 59m 43s
Bitcoin (BTC) price prediction
Bitcoin price prediction remains highly sought after as the cryptocurrency has soared from cents to an all-time high of $103,525. This coin's volatility creates both challenges and opportunities. That’s why we’re here to provide you with the latest price prediction on Bitcoin.

We at Cryptonary provide you with the most accurate price prediction for all sorts of coins, including Bitcoin. You can also request an on-demand BTC price prediction by joining our Discord Community.
Our Price Prediction Model
Unlike others, we don't rely on automated methods because there’s a higher chance of getting a wrong prediction. There are many factors to consider when accurately predicting a cryptocurrency's price.That's why our team of Cryptonary analysts carefully research each cryptocurrency and give you a detailed price prediction using technical analysis to help you make the most profit. This prediction is based on a technical analysis of the coin rather than just general sentiment. We also offer various things like:
- Market Updates: Done a few times per week based on macro indicators.
- Market Directions: Provides details on current market conditions and patterns.
- On-Demand Analysis: Offer analysis of a coin according to your request.
With that said, here’s our Bitcoin price prediction.
Geopolitics shake crypto—BTC leads recovery
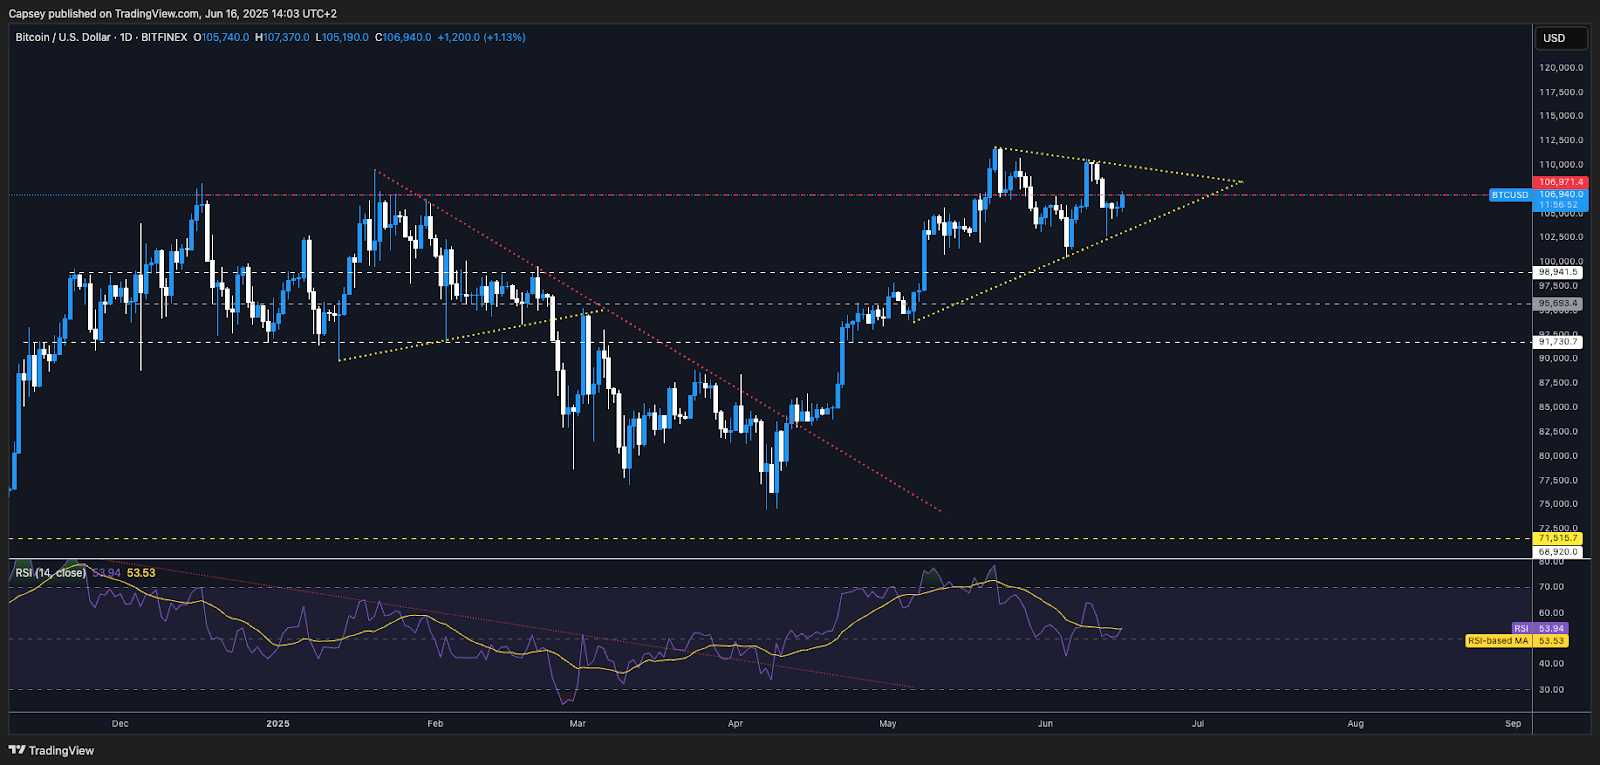
16 June 2025Bitcoin rebounded after geopolitical tension triggered a healthy flush. With $107K acting as key resistance, markets now await confirmation of a breakout or a fresh rejection.
Disclaimer: This is not financial or investment advice. You are responsible for any capital-related decisions you make, and only you are accountable for the results.
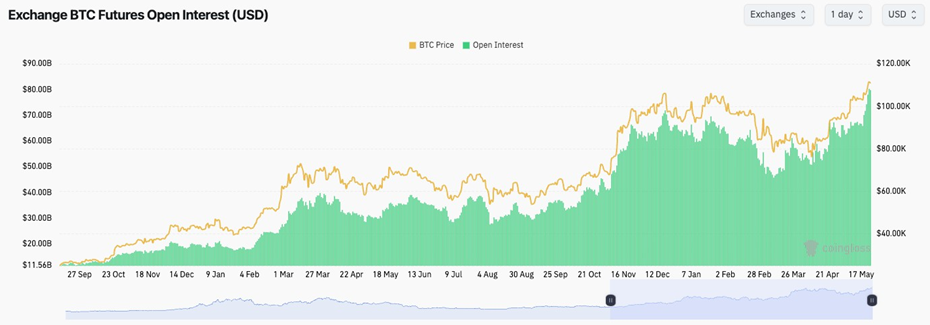
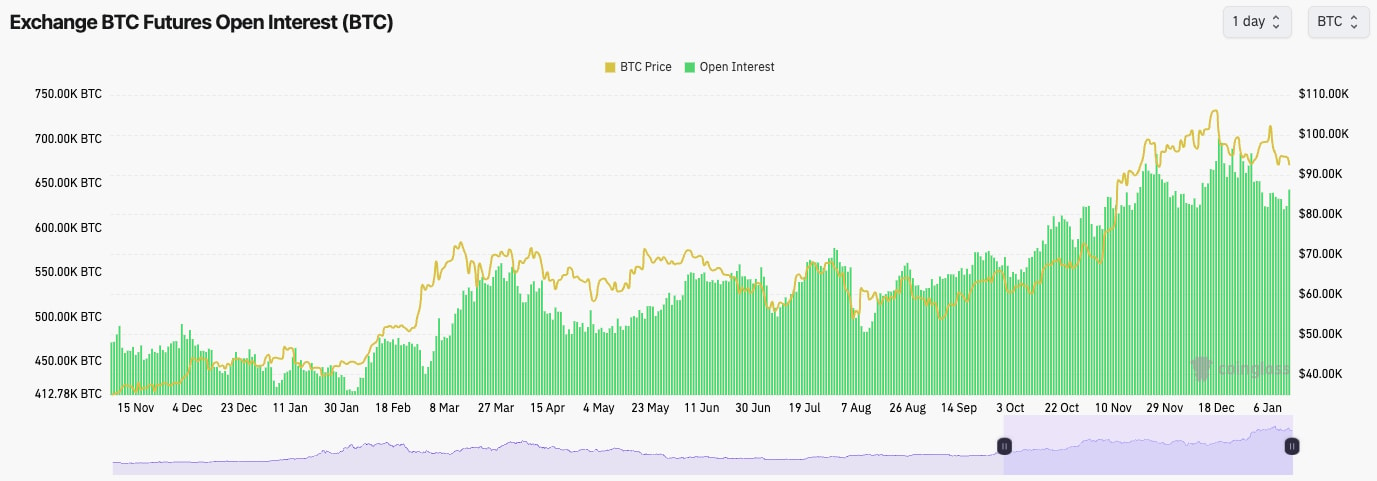
- This weekend's escalation between Iran and Israel saw markets pull back, with BTC's Open Interest pulling back. A healthy development.
- Alongside this, Funding Rates are just about positive, meaning there is no froth from Longs here.
- Overall, this weekend's events have seen a flush in Open Interest, which now provides BTC with a healthier setup to now push higher.

Technical analysis
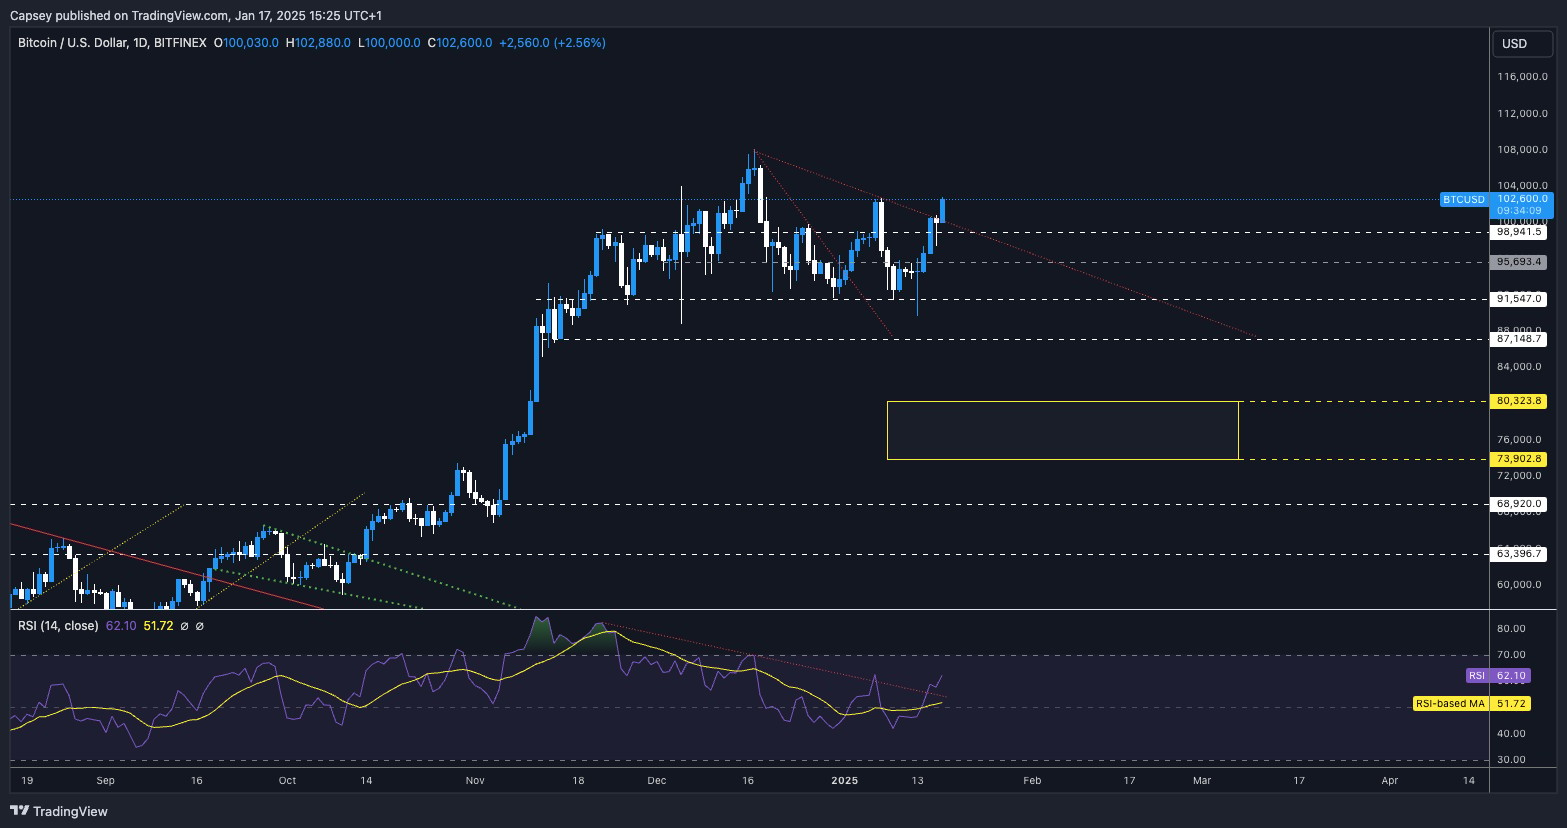
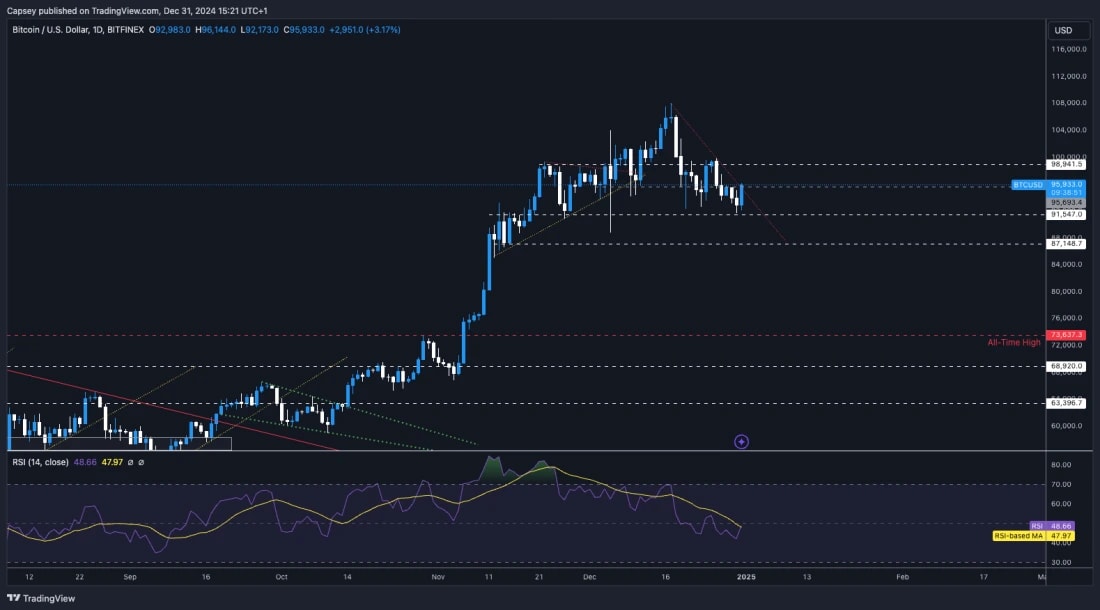
- Price dropped over the weekend into our main support area between $102.500 and $105,500. Price bounced at $102,600.
- Price has since recovered, and it is now battling at the main horizontal level of $107,000. Price will need to see a few Daily candle closures above this level for confirmation of continued upside.
- Beyond $107,000, the main horizontal resistance is at $110,500 and then the all-time high.
- To the downside, the main support range is between $102,500 and $105,500. We expect to see this area continue to hold as strong support.
- The RSI has pulled back to middle territory, with it now breaching above its moving average.
- Next Support: $102,500
- Next Resistance: $110,500
- Direction: Neutral/Bullish
- Upside Target: $112,000
- Downside Target: $102,500
Cryptonary's take
BTC has recovered well following the escalation this weekend between Iran and Israel, bouncing off the $102,500 horizontal support that we outlined in our last update. We're now looking for BTC to continue showing strength and to close convincingly above $107,000. This would then set up a move back to the highs at $110,500 over the coming days.A close above $107k would strengthen the case for BTC to retest its highs, though macro catalysts like Wednesday's FED decision and ETF flow trends will likely shape near-term direction.
Will BTC break $107k?
06 June 2025BTC is staging a bearish retest after a major breakdown. While Open Interest drops and shorts increase, all eyes are on the $95.7k–$98.9k support zone.
Disclaimer: This is not financial or investment advice. You are responsible for any capital-related decisions you make, and only you are accountable for the results.
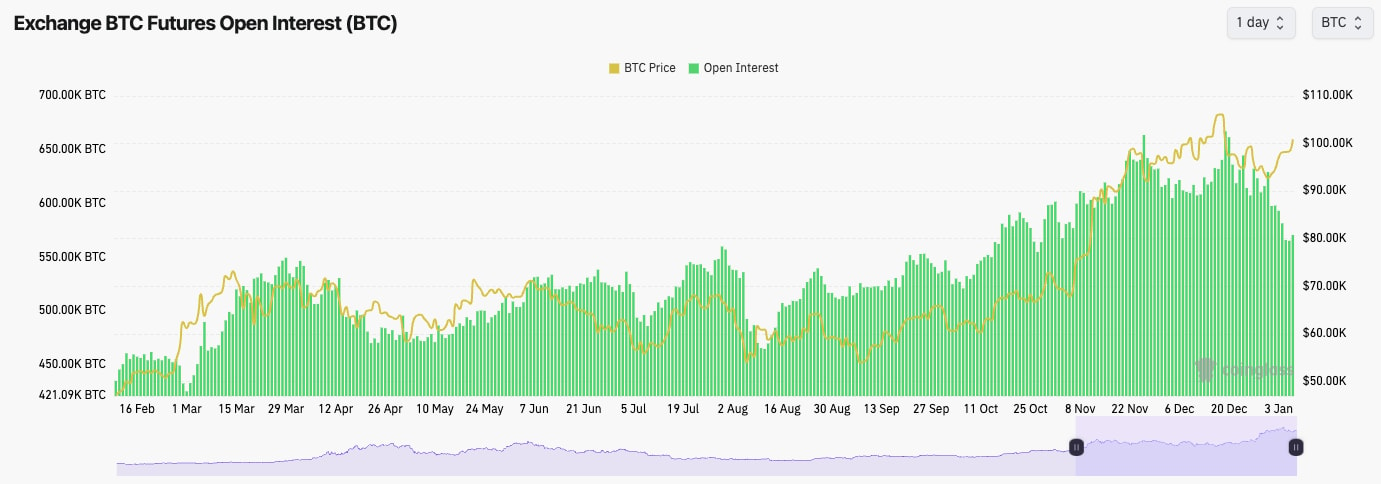
- BTC's Open Interest has pulled back on this price pullback, whilst the Funding Rate has turned negative. This suggests that late Longs have been flushed, and that Shorts have now chased the move down.

Technical analysis
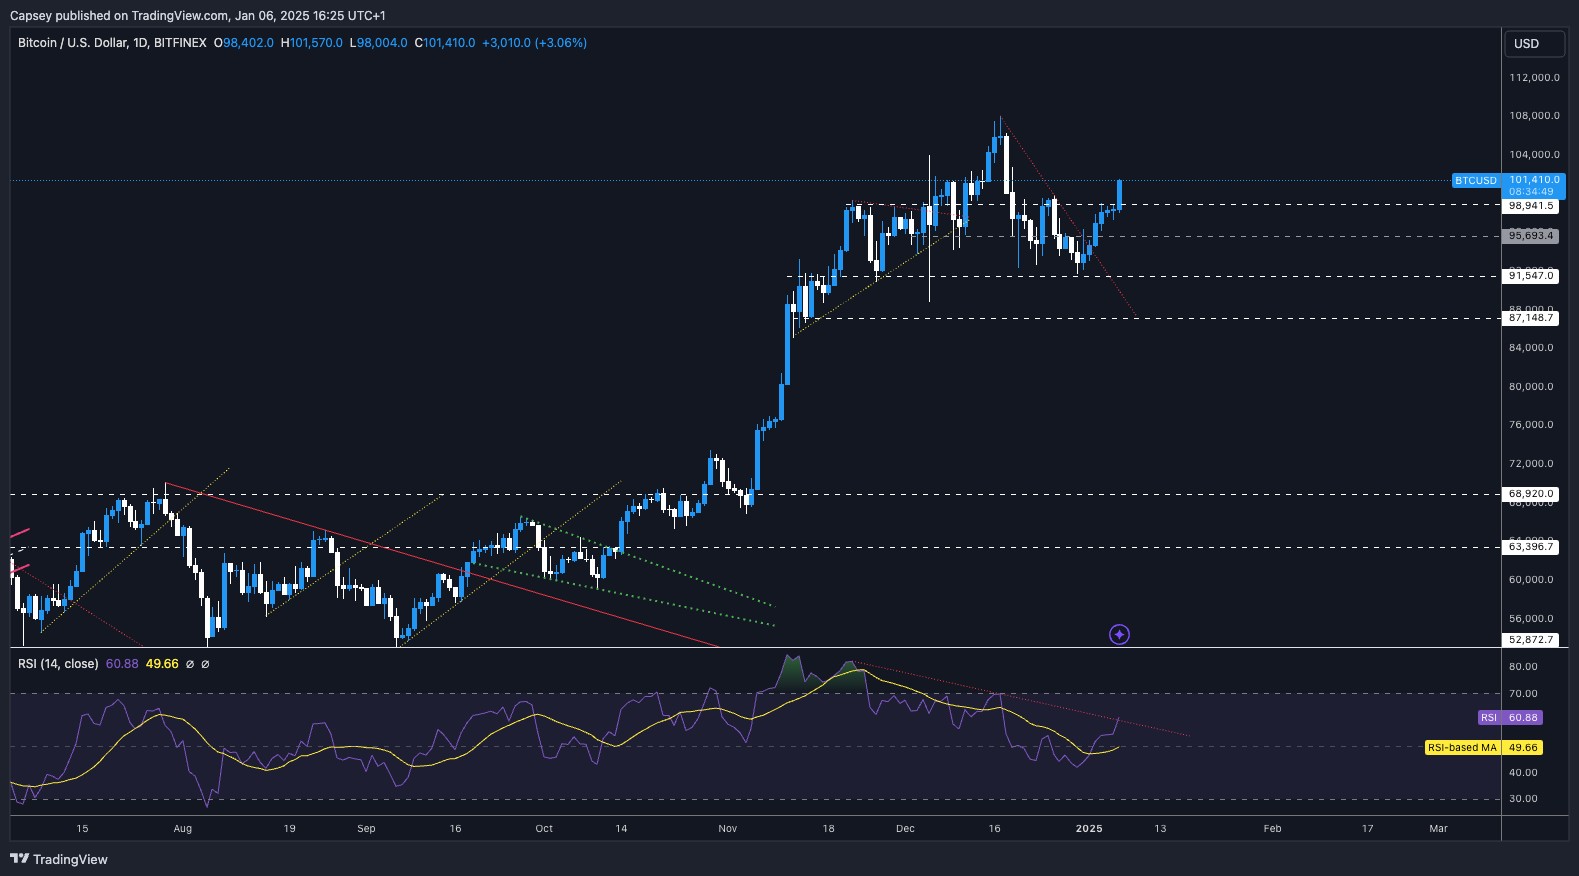
- BTC formed a Head & Shoulders pattern which has seen a price breakdown as we expected it would.
- Price is now putting in a bearish retest, where price has moved back up to retest the underside of the resistance.
- The price range now (that might act as resistance) is between $102,500 and $105,000.
- Beyond that, the main horizontal resistance is at $107,000.
- The next zone of support (sub $100k) is at the Yellow Box we have identified. This is the range between $95,700 and $98,900.
- The RSI has pulled back from overbought territory and it's now back into middle territory.

- Next Support: $98,900
- Next Resistance: $106,900
- Direction: Bearish
- Upside Target: $106,900
- Downside Target: $95,700
Cryptonary's take
BTC looks to be putting in a bearish retest of the neckline of the Head & Shoulders pattern that it has recently broken down from. Our expectation is that price will continue to trend lower over the coming 1-2 weeks, and price will eventually fill the Yellow box between $95,700 and $98,900.We will assess at the time as to whether we repurchase BTC if it reaches the Yellow box zone. An invalidation of our thesis will be a breakout above $107k, although we're not expecting this to happen as the macro is still uncertain with the overall level of uncertainty and BTC ETF flows waning.
BTC tests major support amid pullback pressure
02 June 2025Bitcoin breaks below trendline support, while ETH holds firm within range. SOL weakens further, and HYPE shows signs of topping. Market structure is shifting fast.
Disclaimer: This is not financial or investment advice. You are responsible for any capital-related decisions you make, and only you are accountable for the results.
- Bitcoin's Open Interest has pulled back from its highs as the price has pulled back.
- BTC's Funding Rate was towards the 0.01% mark, but upon the OI pullback, the Funding Rate has moved closer to 0.00%.
- This is a relatively healthy setup from a mechanics perspective, with no signs of froth or excess.

Technical analysis
- Bitcoin has fallen out of its main uptrend line, with price also losing the horizontal level of $106,900.
- There is a support zone between $102,500 and $105,000. Price has so far found support in this zone.
- If price breaks below $102,500, then the next zone of support is likely to be between $95,700 and $98,900.
- To the upside, the key level for BTC to reclaim is $106,900, and then beyond that, it's the all-time high of $111,900.
- BTC does look to be forming a 'Head & Shoulders' pattern (which we have marked out on the chart). These formations have a bearish bias, with the likely breakdown target being at least $98,900.
- This price pullback has allowed the RSI to reset, pulling back to middle territory from having been close to overbought.

- Next Support: $102,500
- Next Resistance: $106,900
- Direction: Bearish
- Upside Target: $106,900
- Downside Target: $95,700
Cryptonary's take
BTC is at a critical juncture here. Price has broken below its main uptrend line and it's now below its first major line of support, whilst it's now forming a bearish candle formation. It's possible that $103k is the extent of the pullback however, our expectation is that there's much further to go here, with the first major pullback target area being between $95,700 and $98,900.For now, we're remaining patient as our expectation is that we'll see the price move lower in the coming 1-2 weeks, with the mid-90k's being that target area. At that time, we'll reassess the data to see if we'll begin re-accumulating BTC again in the mid-90k's.
Bitcoin holds key support, Eyes breakout again
27 May 2025Bitcoin is consolidating near all-time highs with rising open interest and balanced leverage, signaling a potential breakout and setting the stage for broader market opportunities.
Disclaimer: This is not financial or investment advice. You are responsible for any capital-related decisions you make, and only you are accountable for the results.
- BTC's Open Interest has increased to new highs, whilst the Funding Rate is positive but still contained. This suggests that a lot of leverage has been applied recently, but that it's evenly balanced between Longs and Shorts.

Technical analysis
- Bitcoin remains in its main uptrend after having broken out to new all-time highs.
- To the downside, the key zone of support is between $105,000 and $106,900. Price has remained above this zone, and used it as support several times already. This is the key level for price to hold.
- Below $105,000, the major horizontal support level is at $98,900.
- To the upside, the all-time high of $111,900 is the horizontal resistance. Beyond that, $120,000 is the next horizontal resistance.
- Over the last few days, BTC has been range-bound between $107,000 and $110,000. A period of consolidation is healthy during larger uptrend patterns.
- The RSI has pulled back from overbought territory, and a period of resetting this metric is positive. However, the RSI is now below its moving average, which is also overbought.

- Next Support: $106,900
- Next Resistance: $111,900
- Direction: Neutral/Bullish
- Upside Target: $120,000
- Downside Target: $98,900
Cryptonary's take
After breaking out to new all-time highs, BTC has remained range-bound at the highs, whilst the overall amount of leverage has increased, it is not yet in frothy territory.As all-time high breakouts go, this is a healthy breakout. This suggests that there could be more upside to be had in the near term following a small period of consolidation in the very short term. BTC's move continues to be supported by strong ETF flows and a weakening Dollar backdrop.
Our near-term price target for BTC is $120,000. This kind of BTC breakout will likely bring many more opportunities across the rest of the space, which we'll be on the lookout for and keen to take advantage of.
BTC consolidates between critical support and highs
23 May 2025Bitcoin is testing fresh all-time highs, with open interest surging and RSI overheating. Consolidation between $105K and $112K could set up the next leg up. Stay patient as momentum builds.
Disclaimer: This is not financial or investment advice. You are responsible for any capital-related decisions you make, and only you are accountable for the results.
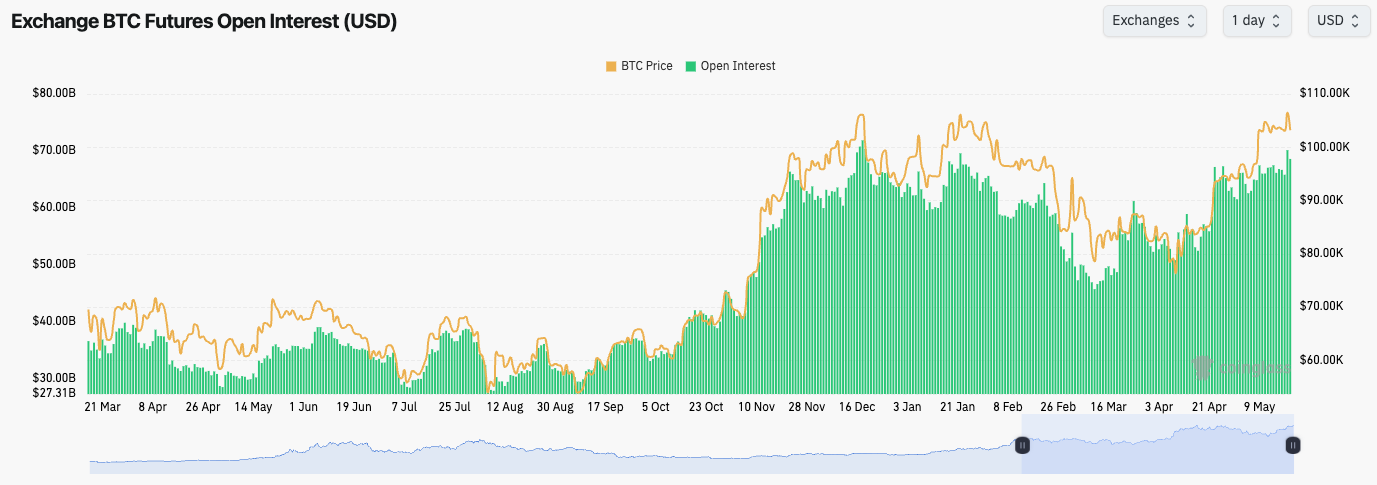
- BTC's Open Interest has soared to new highs, whilst Funding Rates have turned positive, although they're not in frothy territory.
Technical analysis
- BTC has broken out of its all-time highs and the key horizontal resistance of $106,700.
- Price has stalled at $112,000, with price now pulling back and retesting the $106,900 horizontal level, which is now new support.
- Should price break below the $106,900 horizontal support, the $105,000 support is just below. However, if we see a breakdown below $105k, the price will likely pull back to
- $95,700.
- In terms of upside, if the price can break back above the all-time highs of $111,900, then we expect the short-term price target to be $120,000.
- The RSI is just below overbought territory; however, its moving average is overbought, and it's the most overbought it's been since Trump won the election.
Cryptonary's take
BTC has broken out to new all-time highs, and it's possible that the price can continue moving up in the short term. However, our expectation here is that price consolidates between $105k and $112k for a small period (potentially a week). This would be healthy for the uptrend to continue, as it would allow the overbought indicators some time to reset. We would look to buy Spot BTC between $91,000 and $95,700, but in the meantime, we're not chasing price, and we're remaining patient.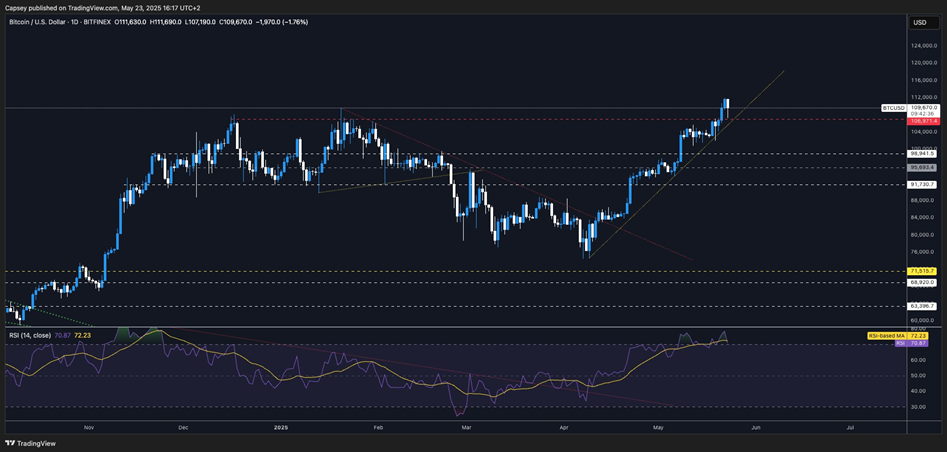
- Next Support: $106,900
- Next Resistance: $112,000
- Direction: Neutral/Bullish
- Upside Target: $120,000
- Downside Target:$105,000
BTC setup screams danger — are you ready?
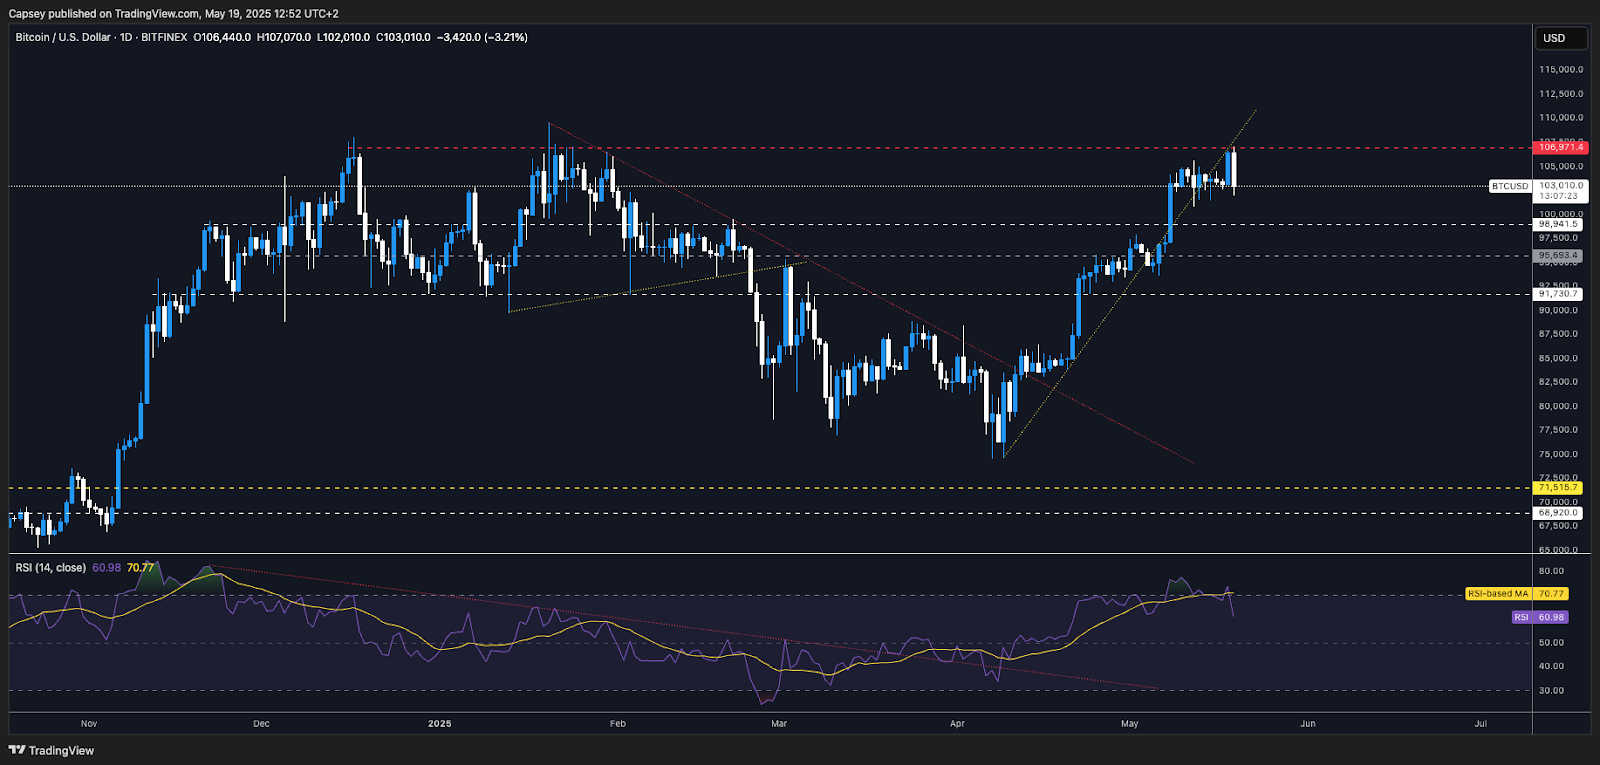
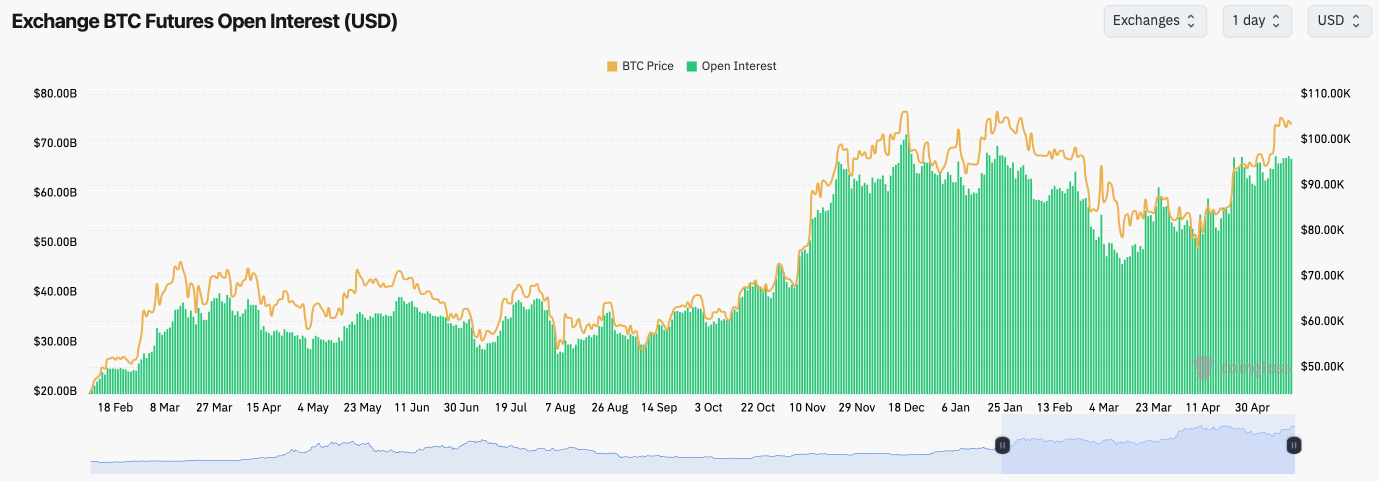
19 May 2025- BTC's OI spiked up over the last few days, and we saw this was mostly Longs, which were then flushed out on the Sunday evening pullback. OI remains high, but not as frothy as it was, whilst Funding Rates are relatively positive.
Technical analysis
- BTC was mostly range-bound between $102,000 and $105,000, when the price broke out higher on Sunday evening. However, price rejected into the main horizontal resistance at $106,900, which also converged with the underside of the uptrend line.
- The key horizontal resistance remains $106,900, and beyond that, the all-time high of $109,000.
- To the downside, $102,000 is the key horizontal support. A break beneath this level and price likely revisits the range between $93,000 and $95,000.
- If $102,000 is tested, then there is another local support at $98,900 that we should be aware of as well.
- As price moved up into $106,900, the RSI moved into overbought territory, whilst it also put in a bearish divergence (higher high in price, and a lower high on the oscillator).
- Next Support: $102,000
- Next Resistance: $106,900
- Direction: Bearish
- Upside Target: $106,900
- Downside Target: $93,000
Cryptonary's take
From a charting perspective, Bitcoin has held the highs well, but it is showing signs of the upside momentum stalling, and therefore, a more substantial pullback may be on the cards. This might be due to trade de-escalation now being priced in and there being a lack of more positive news to continue to help drive prices higher.In terms of a pullback, we expect a more substantial pullback to happen, however, it may be a slow grind down, rather than an 'elevator down' scenario. This, therefore, might take time (a few weeks). Our first area of interest is the $93,000 to $95,000 range.
If price moves down to this level, we will reassess at the time as to whether we begin scaling in with Spot buys. For now, we're staying patient and not chasing strength into resistance.
BTC price stalls near key resistance zone
14 May 2025- BTC's Open Interest has moved back up to its highs in USD value, suggesting that more leverage has been on. However, Funding Rates have remained relatively neutral, meaning that there isn't a build-up of excessive Longs, but that it's a mix of both Longs and Shorts.
- Some of this Open Interest will likely have to be unwound, but it's hard to say if it'll be Longs or Shorts that might be squeezed.
Technical analysis
- BTC broke well above the horizontal level of $98,900, which may now become new support, or at least the first major support for price.
- Beneath $98,900, $93,000 to $95,700 should be a good zone of support, should the price fall back below $98,900.
- To the upside, the key levels are at $107,00 and then essentially the all-time high of $109,000.
- Price has begun to consolidate/stall slightly, with price now grinding into the main uptrend line. If price loses the uptrend and isn't quickly recovered, then it's very possible that we see a revisit of $93,000 to $95,700.
- The RSI is very overbought, and it's currently sitting on top of its moving average. For this metric to meaningfully reset, we'll need at a minimum a significant period of consolidation.
- Next Support: $98,900
- Next Resistance: $107,000
- Direction: Neutral/Bearish
- Upside Target: $107,000
- Downside Target: $93,000 to $95,700
Cryptonary's take
BTC has had a big move up and in a short period of time, fueled by Spot buying and Shorts being squeezed. Whilst it's possible that BTC continues pushing higher, we're not expecting this to be the outcome.We're not looking to chase prices currently, and we're expecting BTC to pull back from the $105k level back to 98900 As a minimum, however, this pullback might extend down to $93,000 to $95,700. If price pulls back to that level, we'll consider buying Spot BTC at that level with a view to holding it for at least 6 to 12 months.
Bearish divergences build as BTC stalls
05 May 2025BTC faces rejection below key resistance, with Open Interest high and funding neutral. A FED decision looms, potentially triggering a pullback as bearish signals begin to stack.
- On the price move up to $97,000, the negative Funding reset to neutral (a Short-squeeze), but the Open Interest remains relatively high in USD terms. This suggests that the build-up in Shorts has mostly been squeezed, but with OI still high, there's more room for this to potentially develop.
Technical analysis
- BTC has seemingly rejected through the $97,500 level, with price now below, but battling at the mid-level of the range at $95,700.
- If the price falls below the local low of $93,400, it will likely reach $90,000. This is a major psychological support that we're watching, and if lost, then $86,00 is on the cards.
- If price can recover $95,700, then it's possible we see a move higher to the major resistance level at $98,900. If this were to happen, we'd expect that to be a local top, and likely an area where we'd strongly consider a more sizeable Short.
- The RSI did briefly pop into overbought territory, but since it has pulled back, and it's now beneath its moving average. It's possible we see a move higher in price that then potentially puts in a bearish divergence (higher high in price and lower high on the oscillator) in overbought territory, and price can then pull back from there.
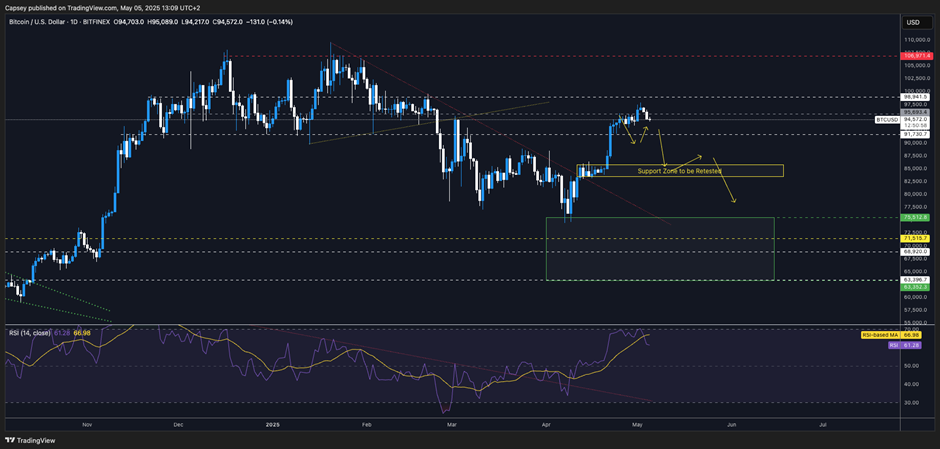
- Next Support: $91,700
- Next Resistance: $98,900
- Direction: Bearish
- Upside Target: $98,900
- Downside Target: $86,000
Cryptonary's take
We move into a pivotal week with a FED Meeting on Wednesday 7th, where we expect Powell to be somewhat hawkish and keep his optionality open. This might lead to a pullback in risk assets as rate cut bets are potentially pushed out to July, maybe even September.We're expecting BTC to have either put in a local top, or for a local top to be very close here. We're not looking to add to Spot bags at the current price, and we're expecting a pullback over the coming 2-6 weeks to take the price back to at least $86,000.
BTC faces crucial support levels amid pullback
29 April 2025BTC is currently navigating key support and resistance levels, with traders watching closely as price action approaches critical points. Let’s explore what’s next for Bitcoin as it battles potential pullbacks and upside targets.
- BTC's Open Interest has pulled back slightly, but it still remains relatively high.
- Price was driven up by Spot buying and Shorts being squeezed, although we've now seen this reset.
- Funding rates are fluctuating but mostly remain flat.

Technical analysis
- As we found out yesterday, price was driven higher by large Spot buyers (Saylor being a big one), and Shorts being squeezed.
- Price has now remained at the bottom of the mid-level of the range at $95,700. The major range we're looking at now is the $91,700 support and the $98,900 horizontal resistance.
- If the $91,700 support is lost, we'd expect $90,000 to be a potential support as it's a psychological level; however, if that's broken, then $86,000 would be the target.
- To the upside, if the price can climb above $95,700, then $98,900 is the upside target.
- The RSI is now just shy of being overbought, with a bearish divergence now also having formed (higher high in price, lower high on the oscillator).
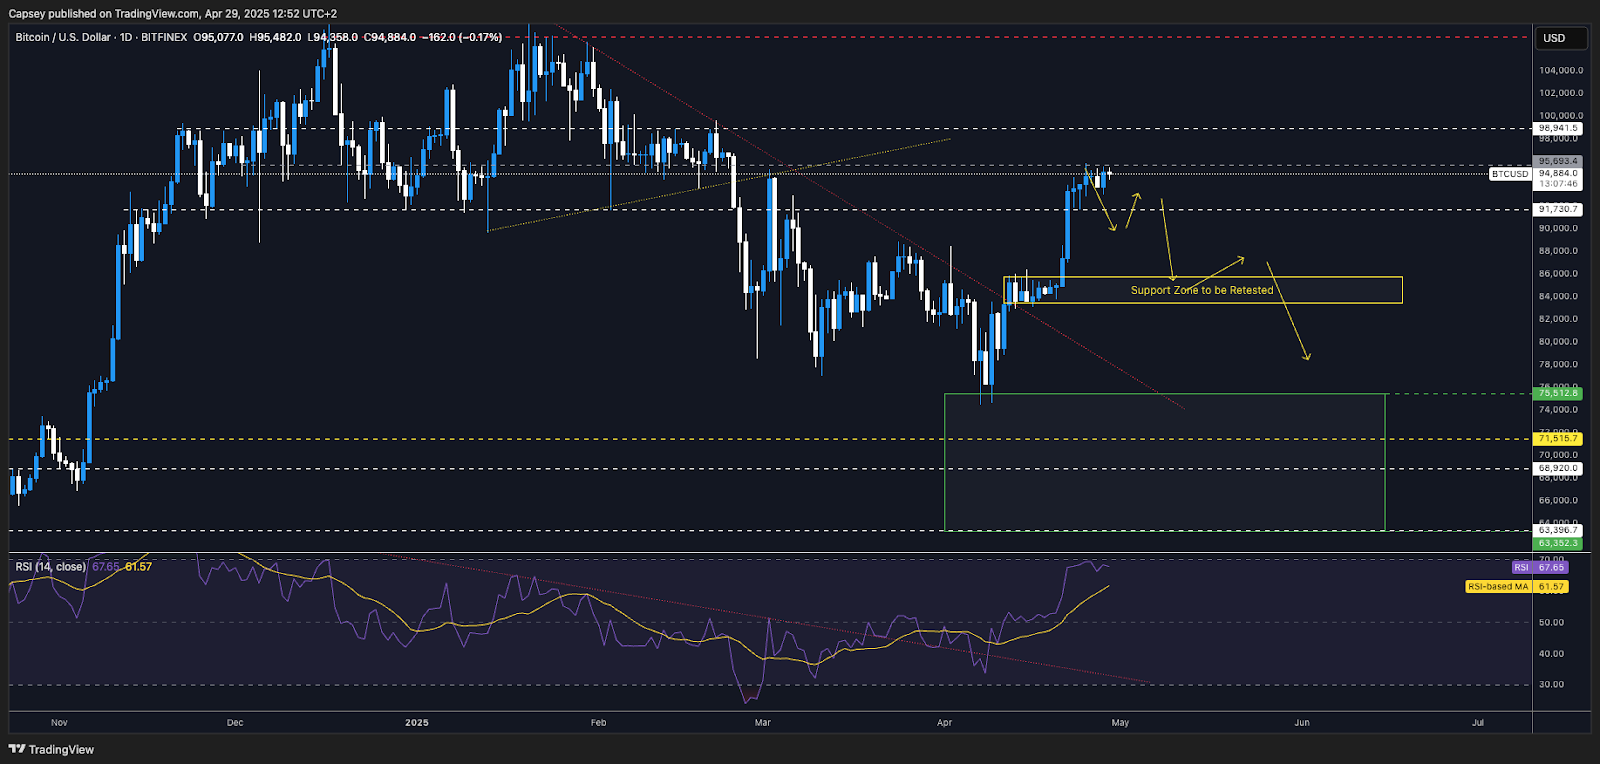
- Next Support: $91,700
- Next Resistance: $95,700
- Direction: Bearish
- Upside Target: $98,900
- Downside Target: $86,000
Cryptonary's take
Price has climbed higher in a really strong manner, although we'd have preferred that this wasn't somewhat due to Saylor bidding. Price is now close to being overbought, whilst putting in a bearish divergence, whilst also butting up into the horizontal resistance of $95,700.It's possible that price goes higher here, with $98,900 the likely complete top (should price go higher), however, we remain cautious here and we're expecting a pull back over the coming week, with a larger pull back coming in the medium term.
Whether the price local tops around $95k or $98k is hard to say, but we do believe a local top is close as the macro environment doesn't support BTC clearing above $100k and heading to all-time highs currently.
Is Bitcoin's bullish breakout sustainable?
21 April 2025Bitcoin’s recent breakout has sparked excitement, but the resistance ahead is fierce. In this analysis, we dive into the key levels BTC needs to overcome to shift direction.
Disclaimer: This is not financial or investment advice. You are responsible for any capital-related decisions you make, and only you are accountable for the results.
- BTC's Open Interest (by number of coins) has increased whilst Funding remains range-bound/fluctuating between slightly positive and negative. This move up in price has been driven by some leverage, but it's also been supported by a Spot bid.

Technical analysis
- BTC has broken out of its main downtrend line, and despite being in a tight range for a few days (between $83,500 and $85,500), price has now broken out to the upside.
- Price has now moved up to a local resistance zone between $87,500 and $88,500, however, the major horizontal resistance is at $91,700.
- If price reclaimed $91,700, that would indicate a bullish reversal, and we'd have to look to change our stance. However, we don't see price reclaiming this level anytime soon,
- On the downside, $82,000 is horizontal support, with the next major level in a zone between $74,800 and $78,500.
- The RSI had broken out of its downtrend line some time ago, and having also been sitting above its moving average, it has now broken upwards. It remains in middle territory, so it's possible this price move could extend into $88,500.
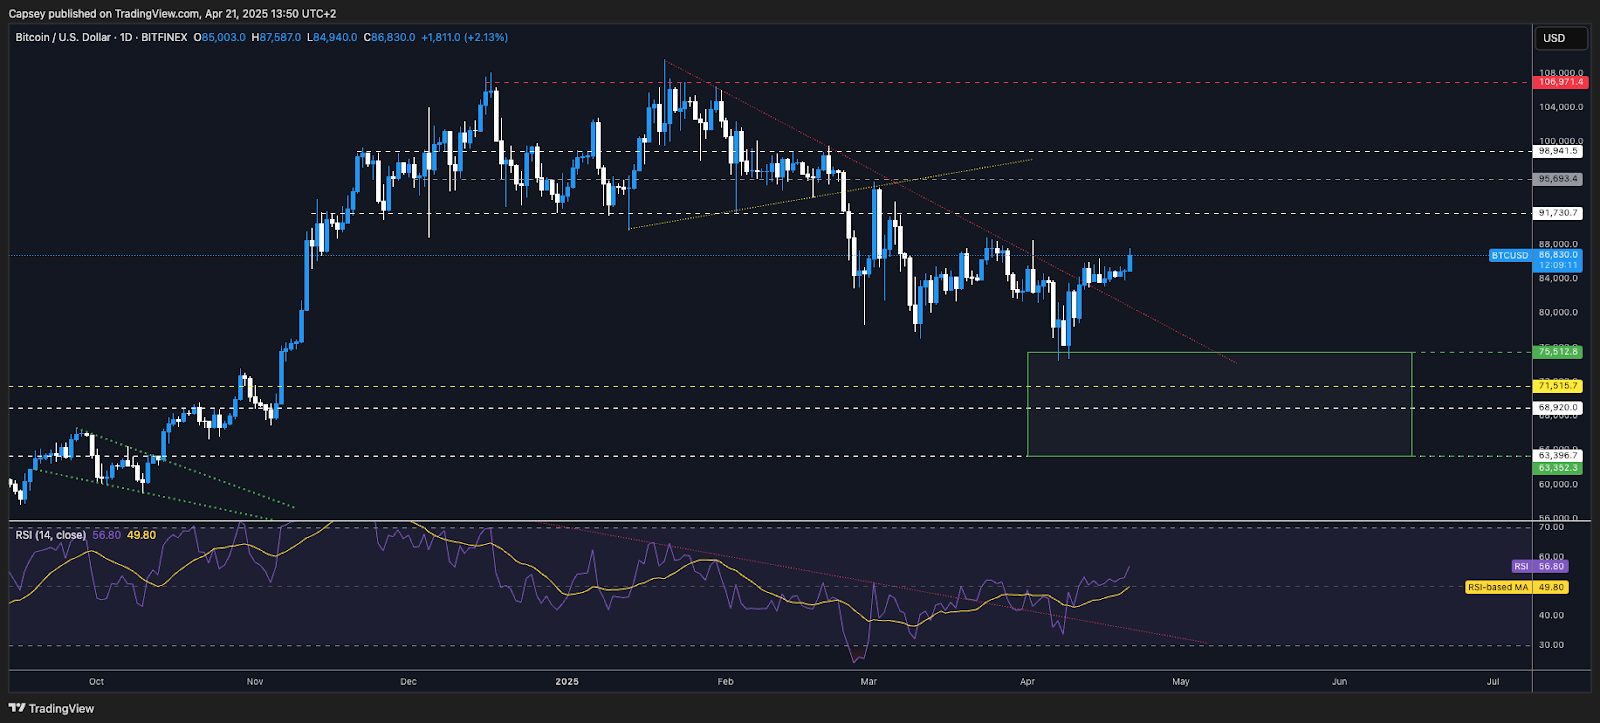
- Next Support: $82,000
- Next Resistance: $88,500
- Direction: Bearish
- Upside Target: $88,500
- Downside Target: $82,000
Cryptonary's take
Whilst price has positively broken out to the upside, we remain sceptical of the move. In fact, between $87,500 and $89,000, we will be looking to Short BTC, with the target being a minimum of a retest of $82,000. In the short term, we see upside as close to being done, and therefore we do expect price to pull back over the coming weeks, again with $82,000 as being the minimum target.In the medium term, we are still expecting a retest of the lows, and hence, for now, we remain patient. A price reclaim of $91,700, and we'd have to consider that we're wrong and we'd look to reassess our positioning.
Bitcoin faces $82K support before critical downturn
16 April 2025As the market braces for volatility, Bitcoin’s pullback and critical resistance levels across Ethereum and altcoins signal a shift in momentum. Let’s break down the key targets in play for major cryptos.
Disclaimer: This is not financial or investment advice. You are responsible for any capital-related decisions you make, and only you are accountable for the results.
Technical analysis & market mechanics
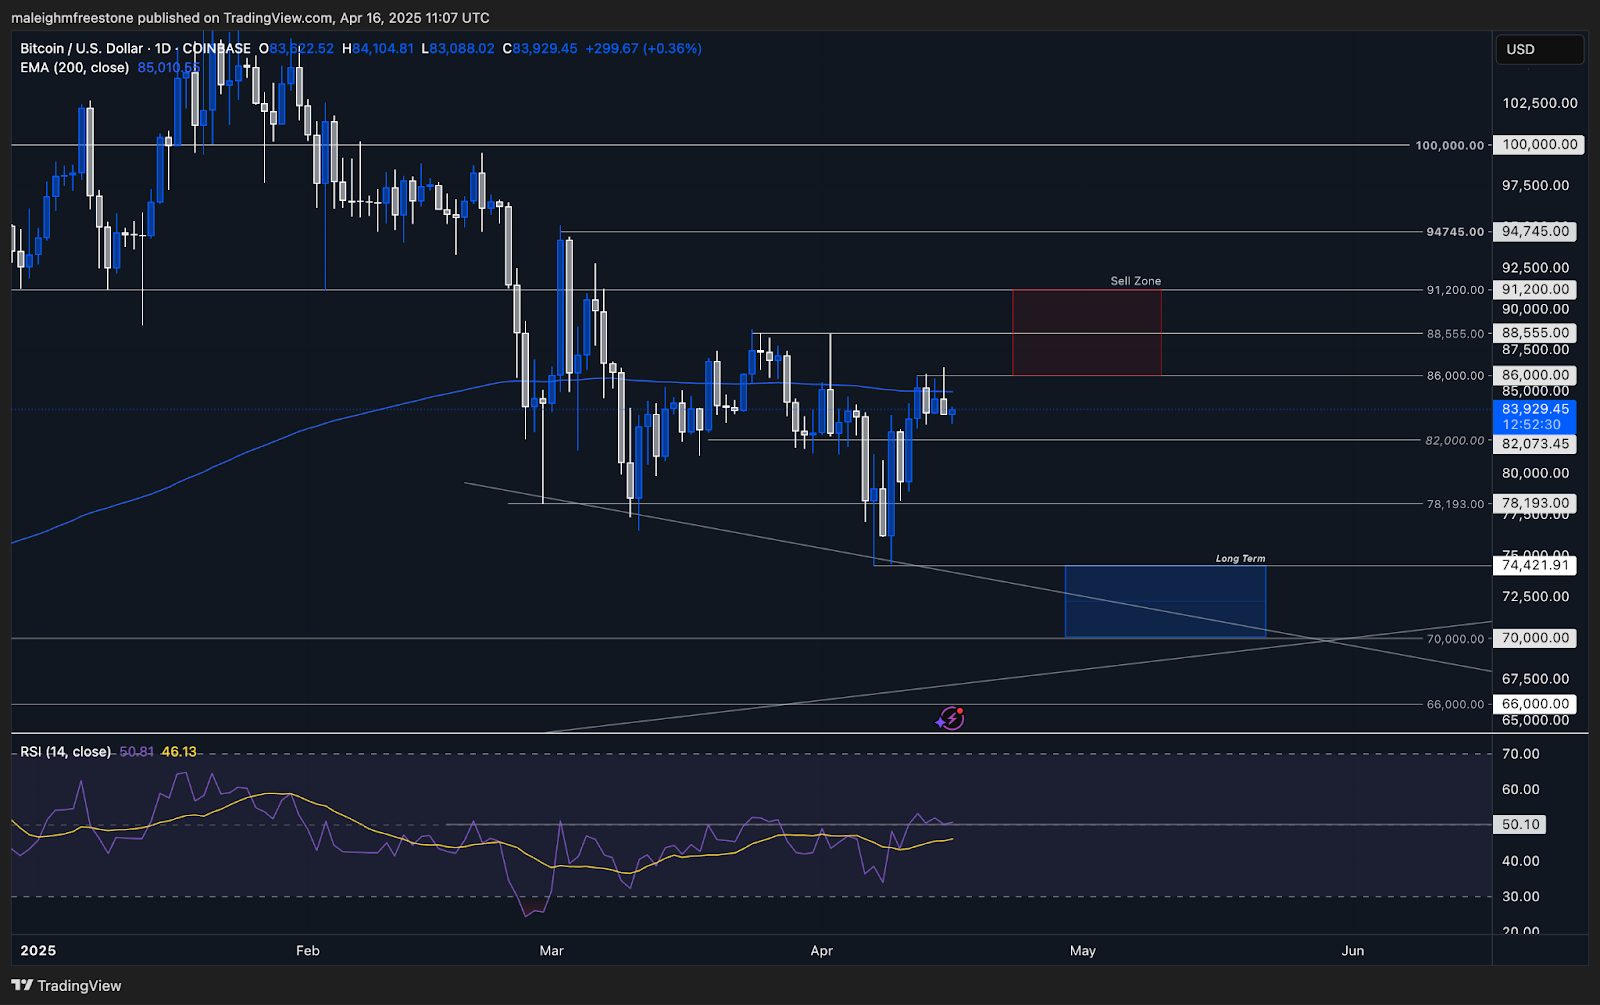
- $86,000 is the first local resistance and where we begin building the short.
- $88,555 is secondary resistance to scale further into the position and add a layer to the short.
- $91,200 is the final resistance, and we reserve capital to complete the short.
- $82,000 is local support but weak; not a level too long.
- $78,000-$74,000 is the main target zone, where we expect the price to revisit.
- $70,000-$65,000 is the deeper downside objective if momentum accelerates.
- RSI sits around 50 - neutral, with room for price to push higher.
- Market structure remains bearish with lower highs forming.
- Funding rate at 0.0046% - flat; no long/short imbalance.
- Open interest consolidating between $53B-$56B - cautious but stable.
- Short liquidations stacked above $86,500 - adding to our thesis, we may push higher to take out those shorts before rolling

- Next Support: $82,000
- Next Resistance: $86,000
- Direction: Bullish
- Upside Target: $91,200
- Downside Target: $78,000
Cryptonary's take
We're shorting into the $ 86 K-$91 K region - a clear resistance block with stacked liquidity and fading momentum. Entries are staggered at $86K (core entry), $88,555 (scale-in), and $91,200 (final add). Stop-loss is placed above $93,000 to protect against invalidation. This setup aims to capitalise on a rollover as macro uncertainty around tariffs and economic policy weighs on risk assets.Targets are $ 74 K-$70 K, with potential extension to $ 65 K-$60 K if momentum breaks. The structure supports short exposure, clean levels, clear invalidation, and high reward-to-risk. We do expect a last push higher into these trading levels before we roll over.
Bitcoin stabilizes above trendline, eyes $88K
14 April 2025Bitcoin’s rally is gaining steam as it pushes above key levels, reclaiming trendline support and flipping sentiment. With funding turning positive and momentum building, all eyes are on where BTC heads next this week.
Disclaimer: This is not financial or investment advice. You are responsible for any capital-related decisions you make, and only you are accountable for the results.
- BTC's Open Interest (by number of coins), has moved up slightly, but not to alarming levels, which would suggest too much leverage has built up.
- BTC's Funding Rate has also returned to more positive territory, whereas last week, Funding was negative for significant periods, suggesting that traders were betting on further downside. But, we know when Funding is negative for too long, that likely suggests a reversal is imminent (upside for price).

Technical analysis
- Bitcoin is attempting to breakout of its downtrend line, and price is now building support on top of the downtrend line, to then potentially put in a move higher over this week.
- $82,000 is the local support, with $88,000 as the local resistance. However, in terms of resistance, it's more of a zone, and it's tricky to find clear levels here.
- In terms of the major horizontal resistance, the clear level is $91,700. A reclaim of this level would be the bullish reversal for then a retest of $100k and the all-time highs. However, in the short term, we don't expect $91,700 to be retested, let alone reclaimed.
- The RSI has cleanly broken out of its downtrend, and it's also above its moving average. It also still remains in the middle territory, suggesting that there may be some room to the upside here.

- Next Support: $82,000
- Next Resistance: $88,000
- Direction: Bullish/Neutral
- Upside Target: $88,000
- Downside Target: $78,000
Cryptonary's take
In the short-term, it's possible this move higher can continue, and if it does, we would expect the stopping zone to be between $88,000 and $89,000. If price were to push on to $90,000 to $91,700, we may even look for Shorts again in that range, as that might mean price has got too stretched to the upside in the short-term.We are still expecting this to just be a relief rally, and for the next few months to be choppy. Therefore, we'll look to take advantage of this choppiness, and we'll be looking to rebuild/re-add to long-term Spot bags, should prices retest the lows, and potentially make new lows. For BTC, that longer-term accumulation zone is between $63,400 and $75,500.
BTC could test $74,700 support
11 April 2025BTC is testing critical levels, with resistance holding strong and support just below. Will the market see a breakout or another pullback? Let’s take a closer look at the latest BTC movements.
Disclaimer: This is not financial or investment advice. You are responsible for any capital-related decisions you make, and only you are accountable for the results.
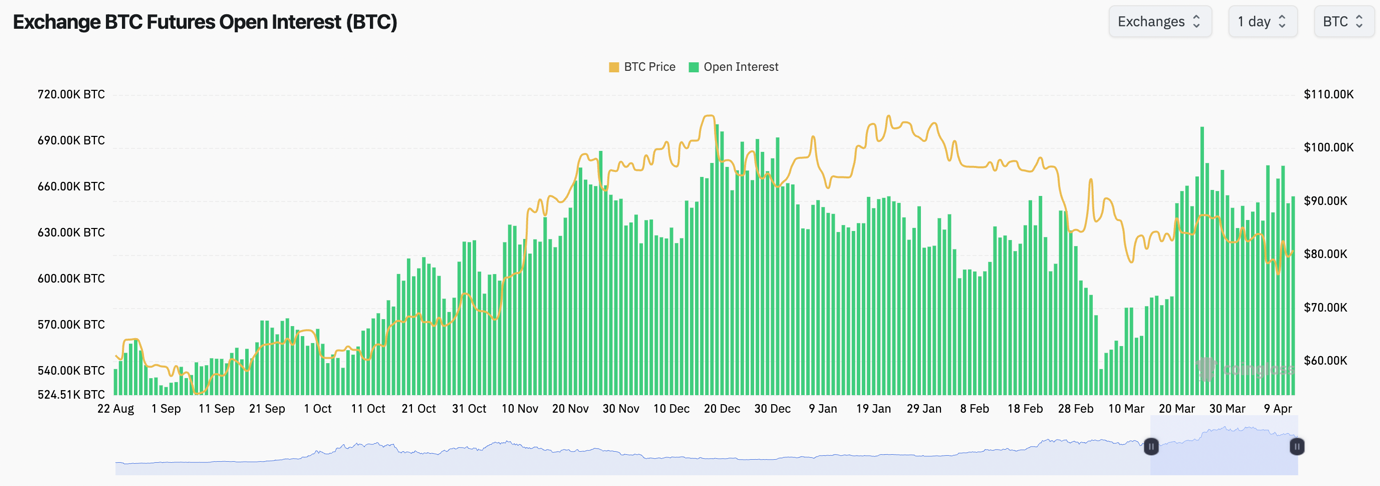
- BTC's Open Interest has remained slightly elevated over the last week or so, suggesting there is still some appetite for leverage exposure.
- Funding Rates are subdued and remain tight to 0.00%, with there being a slight negative skew currently, indicating that there is a small lean amongst traders to be Short.
Technical analysis
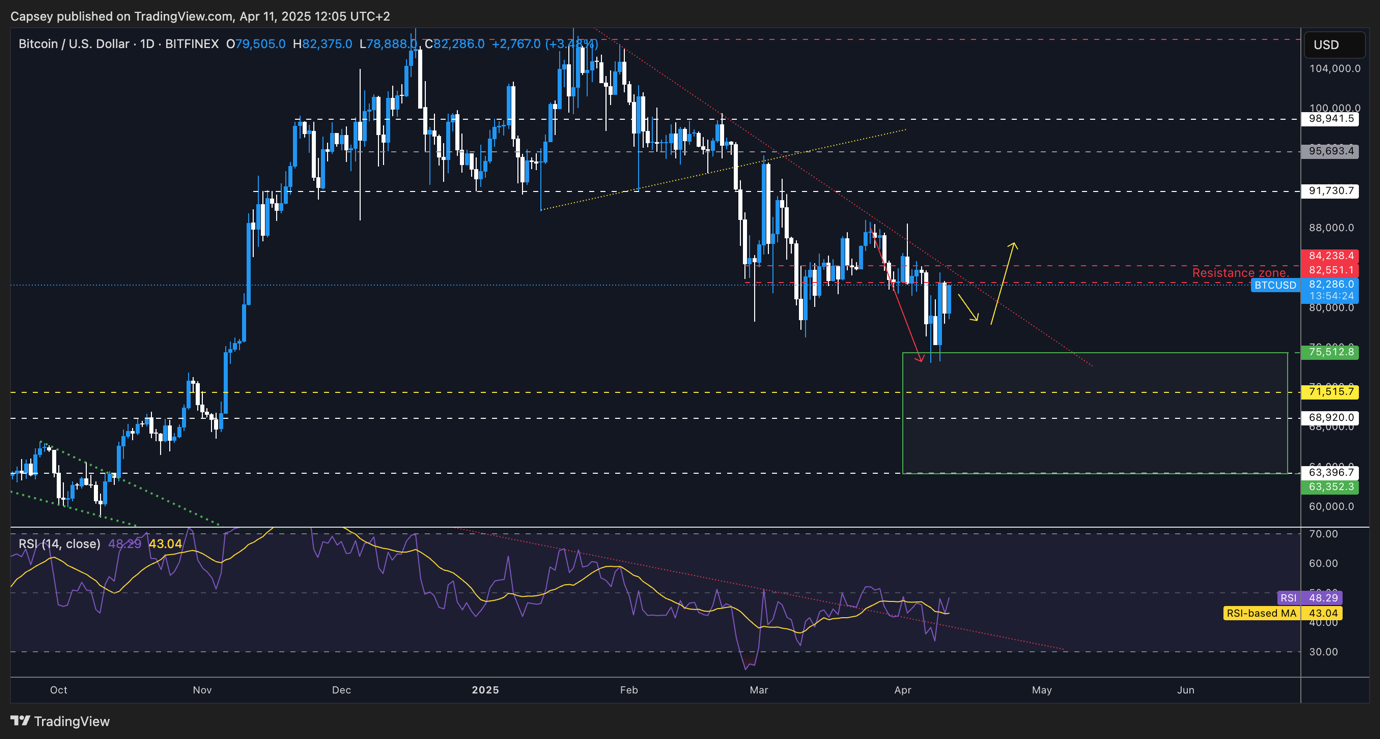
- Price moved down towards the top of the Green Buy Box, and price bounced from $74,700.
- Price then bounced into a new resistance zone that we have identified between $82,500 and $84,200. In our view, this is now the key level for price to reclaim.
- Price remains in its main downtrend, and we'll be closely watching for a breakout of this main downtrend line.
- In terms of downside, we expect $71,500 to $75,500 to be major support.
- The RSI broke out of its downtrend, and it's put in back-to-back bullish divergences (lower low in price, and higher low on the oscillator), whilst it's also above its moving average. We could see this reflected in helping prices go higher.
- Next Support: $74,700
- Next Resistance: $84,500
- Direction: Neutral/Bullish
- Upside Target: $87,000
- Downside Target: $74,700
Cryptonary's take
In the short term, price action is really hard to call here. If we had to call here, we could see the price pulling back slightly and then maybe moving up into the downtrend line and potentially pushing for a breakout. We've identified this with arrows on the chart.In terms of accumulating BTC, or playing this move, in all honesty, we're not too confident; it's extremely hard to call considering the whip-sawing price action we've been seeing lately as we constantly get the headline tennis playing out.
In the short term, we have low confidence. But, the game plan will be to accumulate in the Green Buy Box between $63,400 and $75,500, should we see retests, which we expect to see over the coming months.
BTC could drop another 10%
07 April 2025As the crypto market stabilizes, BTC faces key support at $71,500 while market sentiment remains cautious. Let’s explore the current price action and what could come next for BTC.
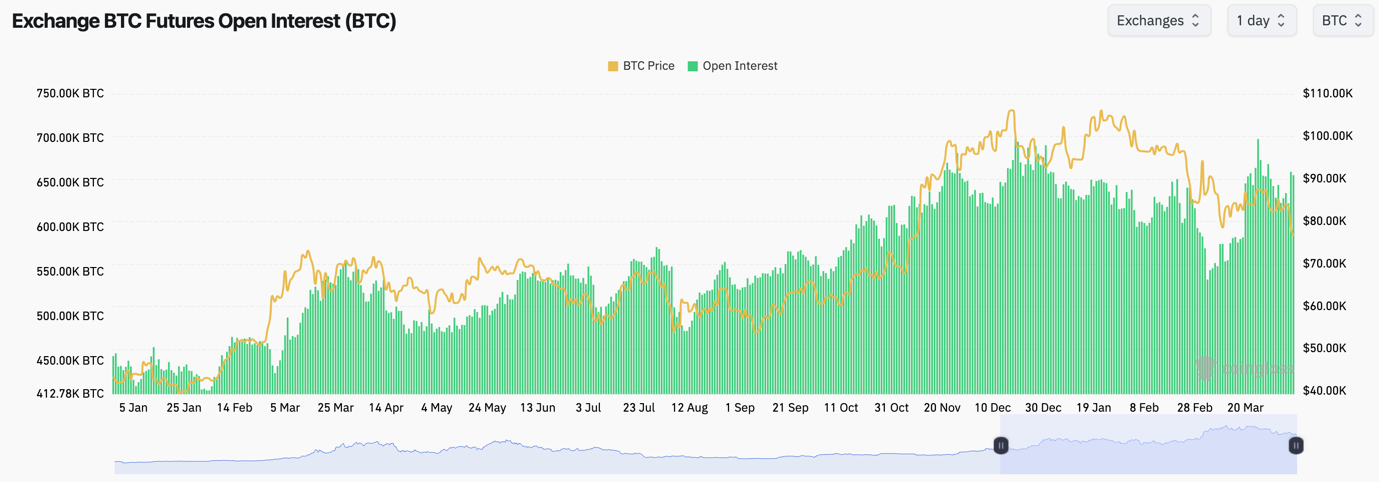
- BTC's Open Interest has spiked up slightly, but that's likely due to the price of the coins falling.
- Funding Rates are positive, but they're subdued.
- There is far less appetite than in previous months for traders to be heavily leveraged in trades.
Technical analysis
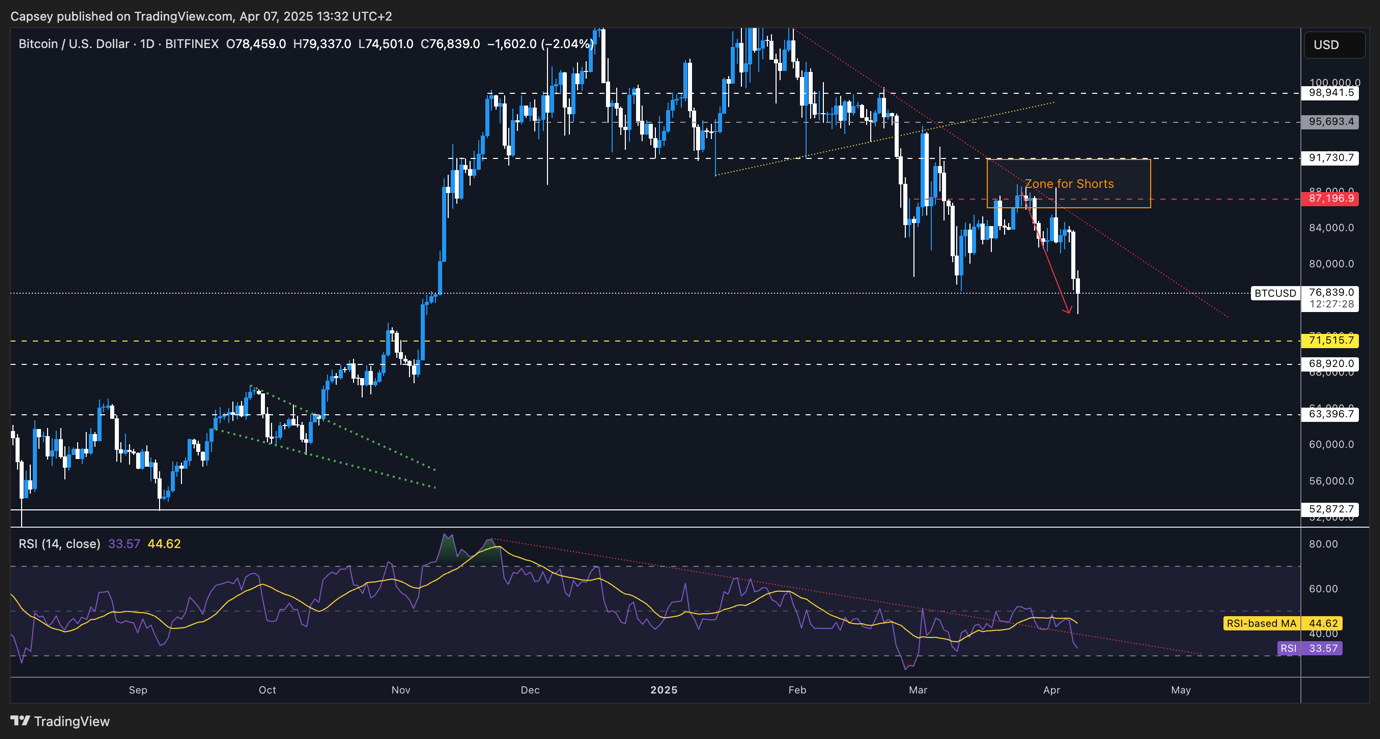
- BTC moved into our Short box, and it has rejected down to our target zone of $76k to $78k. Perfect move.
- The key battle for price came at the $81,500 to $82,000 level. When the price lost that level, it moved straight into the $78k level as we expected it might do.
- The new supports we're looking at are between $68,900 and $71,500, so again, another zone, rather than a specific price point.
- To the upside, the new horizontal resistance is now at $81,500 (the old horizontal support).
- In terms of resistance, we also have the main downtrend line. But, once price bottoms, we should see a grind sideways, and price will move into that main downtrend line, and that'll be what then potentially sets us up for a breakout.
- The RSI is once again close to approaching oversold territory.
- Next Support: $71,500
- Next Resistance: $81,500
- Direction: Neutral/Bearish
- Upside Target: $81,500
- Downside Target: $71,500
With the S&P and the Nasdaq down substantially, it's possible that a bottom for BTC isn't too far away. Now that doesn't mean we're looking for Longs here, but we would be very wary of Shorting BTC here, even if there is room for another 10% downside move. But, with the huge overextension to the downside in the S&P and the Nasdaq, a potential relief rally could be quite aggressive if it comes.
For now, we're patient and remaining on the sidelines. But, we're seeing many on the timeline getting really bear'd up here, and to us, that seems a bit too late to be doing that. The time for getting ultra bearish was months ago.
Whilst we think there's more downside to be had in the medium term, we're wary of a potential market bounce (just from very oversold levels). Therefore, we're not looking to Short BTC here, and we're starting to eye levels to buy.
For us, that's between $69,000 and $71,500 (assuming we get there). If we do, we'll begin to add lightly. This may come sooner than we expected, and that's due to Trump's aggressiveness.
What’s Next?
You’ve seen the analysis for BTC. The next trades — ETH, SOL, HYPE, and SPX6900 — are lining up now, with targets ranging from -20% to -45%. We’ve pinpointed the exact short zones, liquidation levels, and our strategy for execution.
BTC eyes $78,000 as next target
01 April 2025As the crypto market grapples with volatility, Bitcoin is testing key support levels while traders await direction. Let’s explore the latest technical analysis for BTC and what’s next in this unpredictable market.
Disclaimer: This is not financial or investment advice. You are responsible for any capital-related decisions you make, and only you are accountable for the results.
- BTC's Open Interest has pulled back a tad whilst Funding remains close to 0.00%, indicating that there isn't a huge appetite amongst traders to be placing heavy leverage bets.

Technical analysis
- Price rejected into the $87k to $88k region (our Short Box), and price has pulled back to $82k, which we have identified as a local support.
- $81,500 to $82,000 is the local support zone, and the price has bounced slightly from there over the last 24 hours.
- There is now a very local resistance at $84,500, with $87,200 as a more meaningful resistance. Beyond that, the key level is $91,700. But, we don't expect this level to be even tested anytime soon.
- Below $81,500 to $82,000 (the local support), the major support is likely the zone between $76,000 and $78,000.
- Interestingly, the RSI broke out of its downtrend, it pulled back to retest the downtrend as support, and it's now bouncing. However, it does remain below its moving average.

- Next Support: $81,500
- Next Resistance: $87,200
- Direction: Bearish
- Upside Target: $85,500
- Downside Target: $78,000
Cryptonary's take
Bitcoin is in a tighter range between $81,500 and $87,200, however, the levels on either side are also open. These would be $78,000 and $88,500. We don't, however, expect any major upside in the short-term, and in fact, we are quite confident that this price range will break, and the break will be to the downside.The market is on edge going into Trump's reciprocal tariff announcement tomorrow, and even if that comes in lighter than expected (we don't think it will), then any rally off the back of it we expect to be short-lived.
Ultimately, in the short or medium term, we do expect the price to break down and eventually retest that $76,000 to $78,000 level. We'll exercise patience in the meantime.
Bitcoin moves into key 'short box' zone
28 March 2025As market uncertainty looms, Bitcoin ($BTC) face critical price levels that could signal major moves. Let’s explore the latest trends and potential scenarios for BTC.
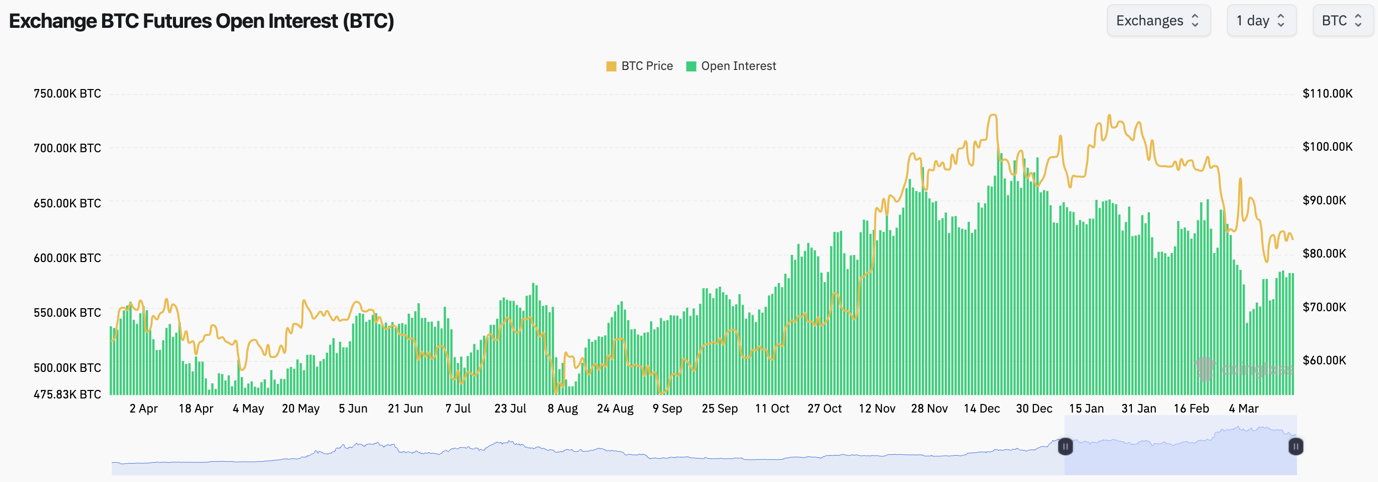
- BTC's funding rate has fluctuated between slightly positive and slightly negative, as we can see below. This indicates a lack of conviction amongst traders, who are flip-flopping between Longing and Shorting.
- BTC's Open Interest increased substantially from the lows, up approximately 20%. This was leverage traders chasing the price higher as it moved into the $87k to $88k area. Although this wasn't matched by strong Spot buying, hence we've seen the move higher be relatively weak and short-lived.

Technical analysis
- BTC has seemingly fallen into the 'Short Box' we identified between $86,300 to $91,700.
- Price rejected into the main downtrend line (red line).
- Price has now pulled back to the local support of $85,000, although the major horizontal support is at $78k.
- To the upside, $87,200 is a key local horizontal level for price to reclaim and hold above. If price can do this, then $91,000 to $91,700 is a potential target, and we'd reassess at that point. However, we don't see this happening in the short term.
- The RSI downtrend line has seen a breakout with the RSI now sitting on top of its moving average and in middle territory. This could help the $85,000 area be a local support.
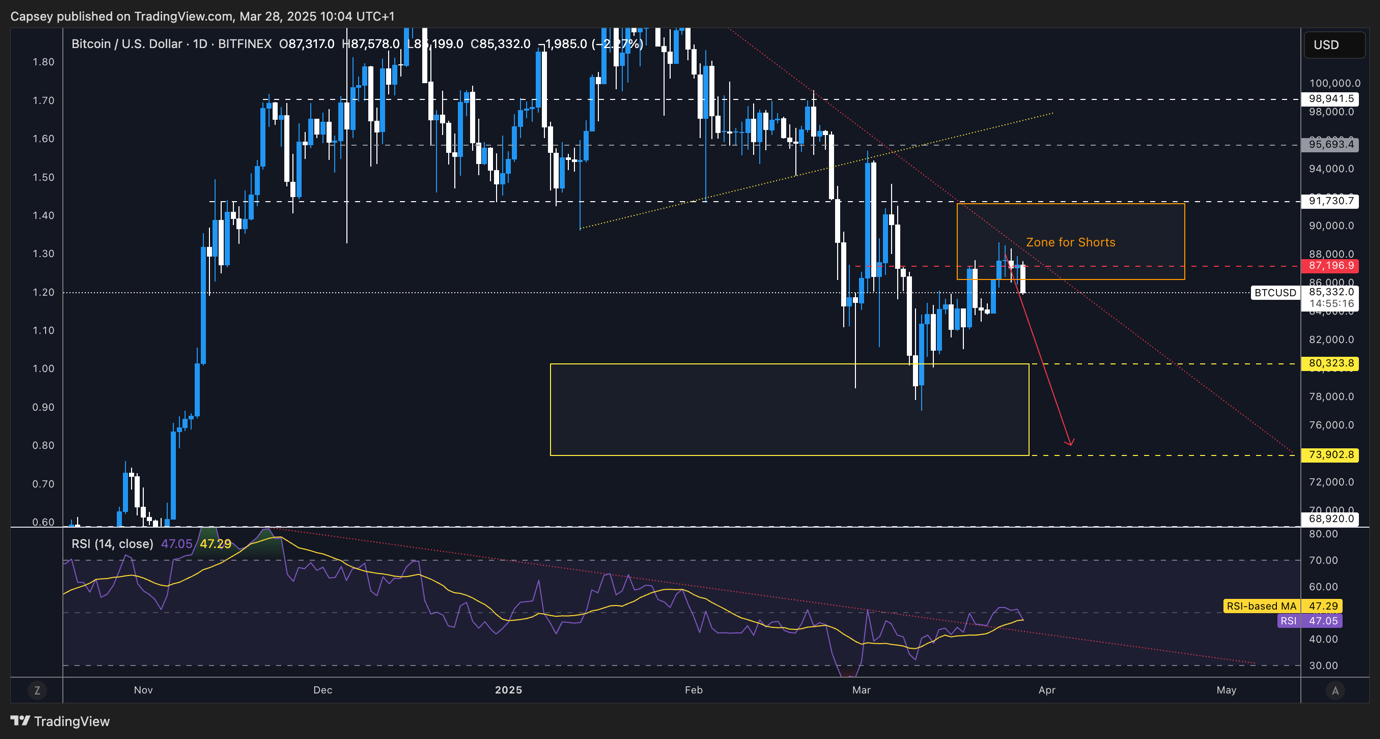
- Next Support: $85,000
- Next Resistance: $88,500
- Direction: Bearish
- Upside Target: $88,500
- Downside Target: $82,000
Cryptonary's take
BTC has moved into our 'Short Box' that we had identified a number of weeks ago. We had to be patient in letting the price grind up to the box and to fill Short orders, which have now filled between $86,300 and $88,600.We are of the view that the recent move up has just been a small relief rally and not much more than that. We expect BTC to move down to retest $82k as a minimum target over the next week or two. However, we see the possibility of a retest of $78k as somewhat likely as well.
BTC targeting $78,000 support zone
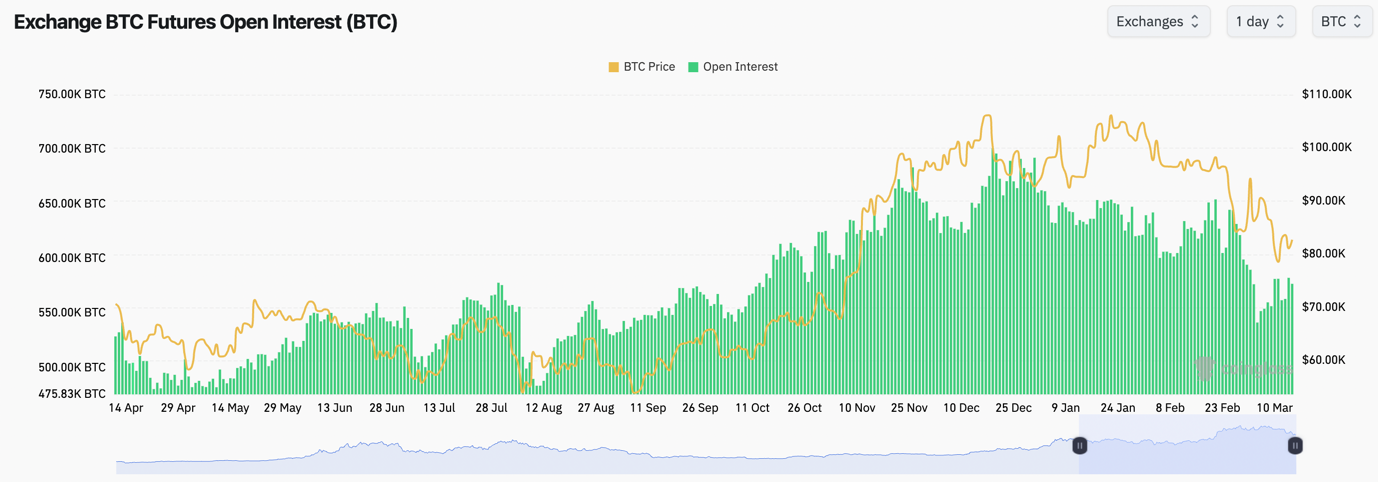
18 March 2025- BTC's Open Interest is up approximately 10% from the bottom, seen a few weeks ago. Although it still remains in a downtrend. This indicates that traders have less appetite to leverage trade BTC.
- Funding Rates are mostly flat, or fluctuating between slightly positive and negative. This suggests that there is indecision amongst traders.
Technical analysis:
- Bitcoin has moved up from the lows, as we expected, following the bullish divergence that is being formed (lower low in price, higher low on the oscillator).
- Price has now bounced into the $85,000 to $86,300 range which is a resistance zone, and also a lower high.
- The zone of major resistance, and where we'd strongly consider Shorts, is between $86,300 and $91,700.
- The RSI remains in a downtrend, although it's not in oversold territory, whilst it's also sat on top of its moving average and potentially looking for a breakout in the short-term.
- On the downside, major support remains between $77,000 and $78,000. A loss of this zone and price likely dips into $72,000, the old horizontal resistance, now potentially new support.
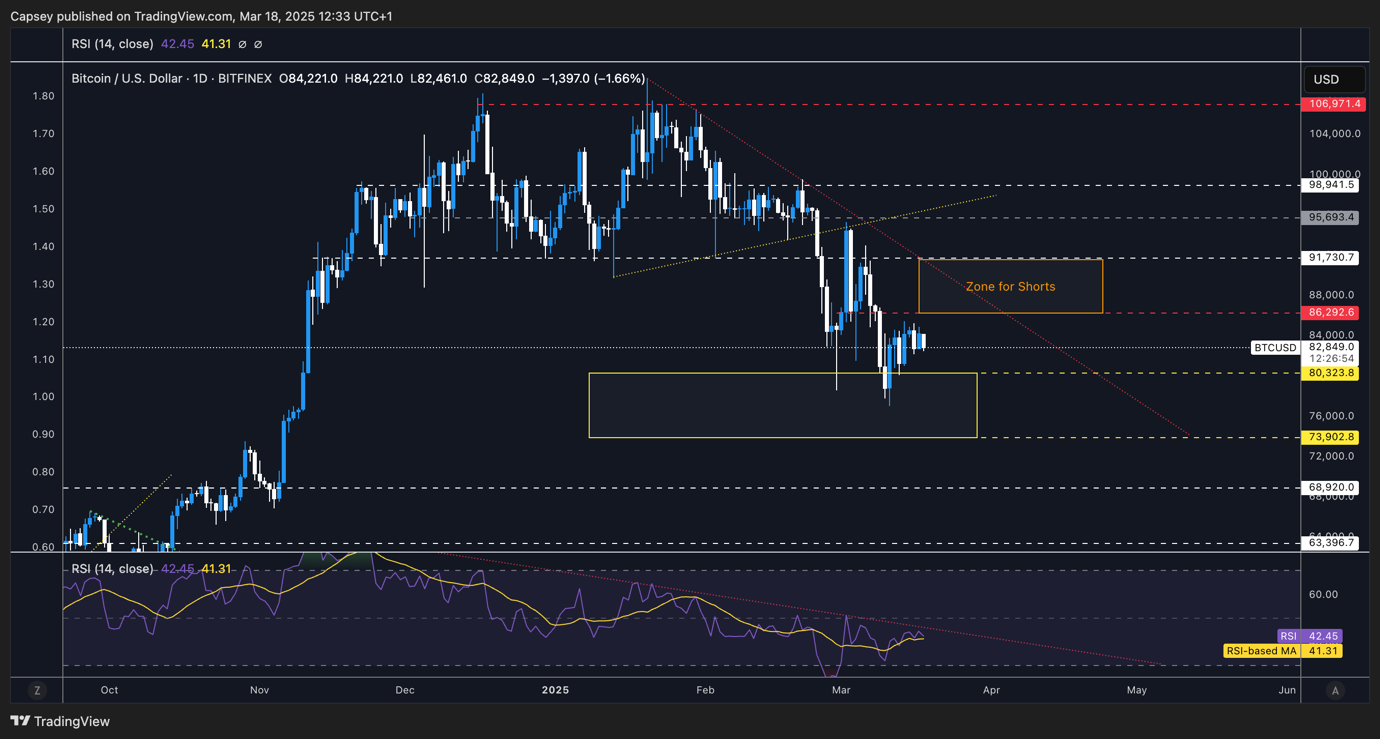
- Next Support: $78,000
- Next Resistance: $86,300
- Direction: Neutral
- Upside Target: $86,300 to $89,000
- Downside Target: $78,000
Cryptonary's take:
Bitcoin has moved off of the local lows, having put in the bullish divergence. Price has now slowly moved up, and likely helped by the bounce in TradFi Index (SPX and NDX). In the short term (coming days), we do think the price can continue this slow grind higher.However, we still expect we're in a multi-month downtrend, and therefore, if the price were to move into the $86,300 to $91,700 zone, we'd look to layer Short orders in that range for a move back to $ 70k over the coming 2-4 weeks.
BTC resistance at $86K looms
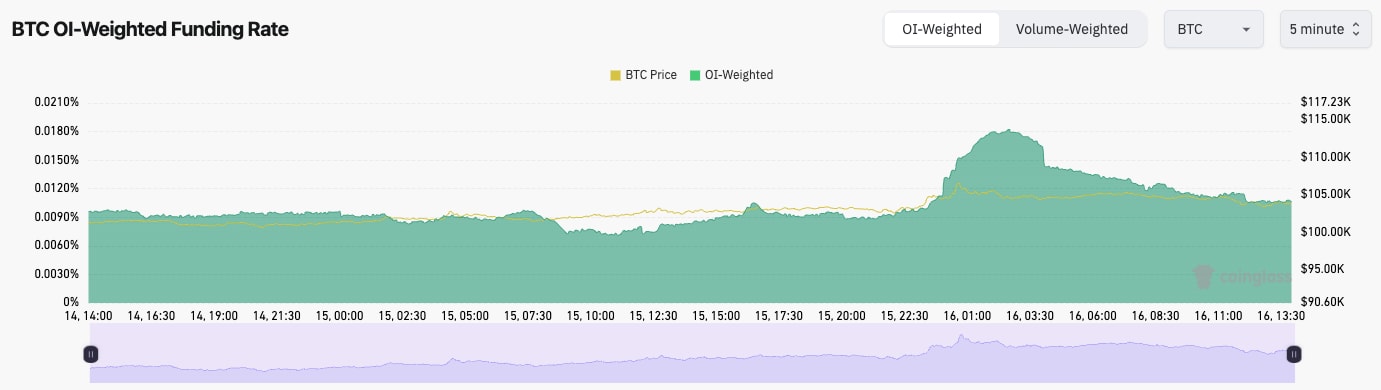
14 March 2025- BTC's Funding Rate is positive but muted, indicating that there's a small bias amongst traders to be Long.
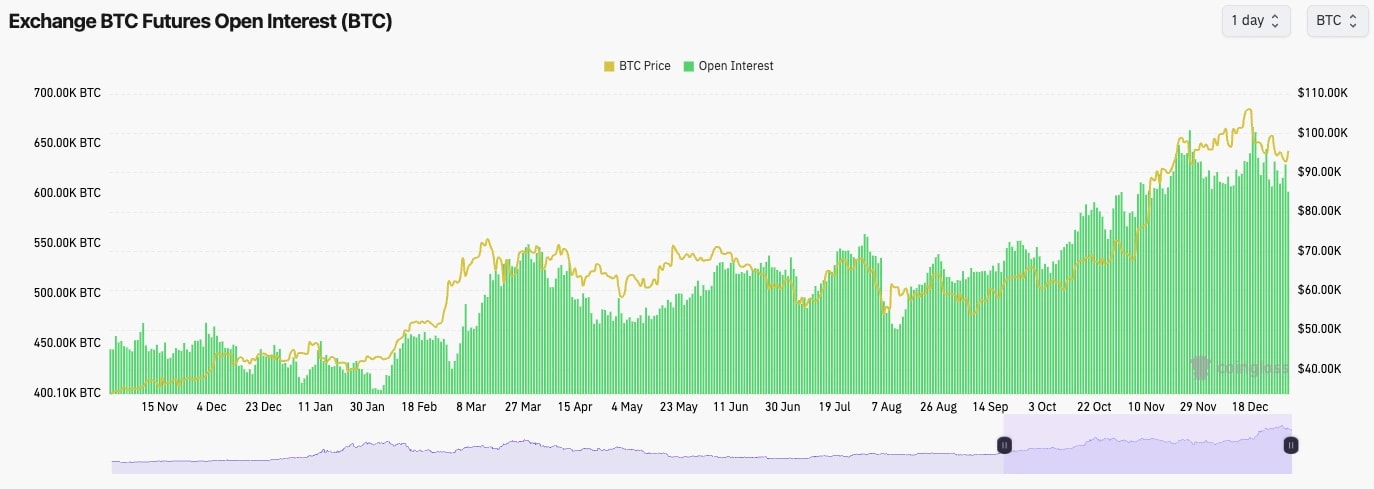
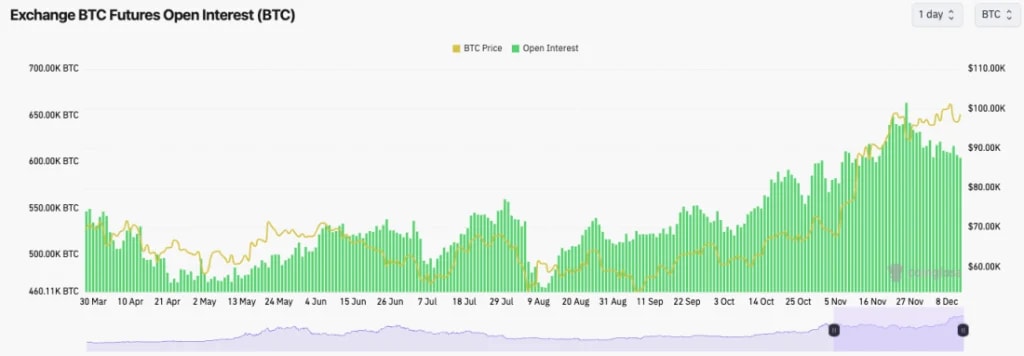
- BTC's Open Interest has been up off the bottom since March 3rd, but it's still in an overall downtrend, indicating that there's not the appetite for leverage that there was at the highs at the start of the year. OI was down from 700k BTC at the start of the year to 582k BTC. This is a meaningful reset.
Technical analysis
- BTC has found some support for now in the late $70k's.
- Price has also put in a lower low, whilst the RSI has put in a higher low, very close to overbought territory (bullish divergence). This could ignite a small relief rally if the TradFi Index can also bounce.
- There is a short-term resistance at $86,300, which price may likely struggle at. However, beyond that, the main resistance is $91,700. We don't expect the price to get near $91,700, let alone breach it in the short-term.
- The major support to the downside is $69,000 to $72,000. We expect this area to be bid quite heavily should BTC trade that low in the coming weeks.
- The RSI is off of oversold territory, and it's battling at its moving average. However, it remains in its major downtrend. We'd get more excited upon an eventual breakout of this downtrend. But, we're not expecting this anytime soon.

- Next Support: $78,000
- Next Resistance: $86,300
- Direction: Neutral/Bullish
- Upside Target: $86,300
- Downside Target: $73,900
Cryptonary's take
Bitcoin has held up relatively well over the last 4-5 days considering how poorly TradFi Index's (S&P and Nasdaq) have traded. However, we do expect that we're in a downtrend, with local rallies likely to put in lower highs and see rejections at local horizontal resistances, the next one is $86,300.If BTC were to get a small relief rally - just due to oversold conditions, it's due one - then we'd look for new shorts potentially between $86,000 and $88,000 (if BTC can get there).
However, we've felt that price has been due for a relief rally for some days now, and we haven't really seen one. Let's see how the price develops over the weekend whilst the TradFi Index isn't trading.
For now, we remain patient. We won't be Shorting lows, but on relief rallies, we'll be looking for Shorts. That current target zone is $86,300 to $88,000. Unless we're given that opportunity, we'll remain sitting on the sides and patient.
Bitcoin battles to hold $80K support
10 March 2025Bitcoin struggles to reclaim resistance as sentiment weakens, while funding rates signal reduced risk appetite. As BTC searches for support, will a relief bounce emerge or is more downside ahead? Let’s dive into the latest price action.
- Open Interest has pulled back substantially over the last 10 days. 10 days ago, OI was at 644k BTC. Following the full retrace of the move on March 3rd, OI came down to 541k BTC. This whip-sawed traders on both sides and this saw a lot of realised loss-taking.
- Funding Rates are now quite subdued, suggesting that there isn't the appetite to take large leverage bets at the moment.
- In the below, we can see how subdued Funding Rates are today, in comparison back to November when the market was overheated post-Trump win.

Technical analysis
- On Thursday, BTC rejected into the horizontal resistance at $91,700, losing the price range that had been supporting BTC, and since then, the price has retraced $10,000.
- Zoomed out, the price remains in an overall downtrend, along with the RSI.
- The RSI has now put in a bullish divergence though (a lower low in price, and a higher low on the oscillator), whilst the RSI is now also creeping above its moving average. This may help to generate a small relief rally.
- So far, the rice has found support in the last $ 70k and the $80,000 level.
- It's hard to identify a clean local resistance at the moment, although if we had to suggest, we'd say it's the $86,000 to $87,000 zone that can be that next local resistance.
- The major overhead resistance is at $91,700. That's the level that'll need to be reclaimed in order to see a bullish reversal.

- Next Support: $80,000
- Next Resistance: $86,000
- Direction: Neutral
- Upside Target: $86,000
- Downside Target: $75,000
Cryptonary's take
We see on the timelines (Twitter etc) that sentiment is more bearish despite there still being the dip buyers out there. Price likely bottoms when the 'dip buyers' are no more. However, it is possible that we can get a small relief rally potentially in the immediate term just simply more as a slight mean reversion move.We're also looking at the S&P and the Nasdaq, both of which are close to oversold and are likely to see a small bounce in the short also. The tricky part to this is that it's hard to know if we go lower before a relief bounce.
Therefore, the way to play this is to look for Shorts into meaningful relief bounces. That's how we're looking to play the short term. We still expect over the coming weeks for BTC to move into the low $70k's at least.
Bitcoin faces critical support test after rally
3 March 2025Bitcoin’s recent surge has hit a wall, with resistance levels proving tough to break. Meanwhile, key support zones across major cryptos are under pressure. Can the market hold strong, or is there a deeper pullback ahead?
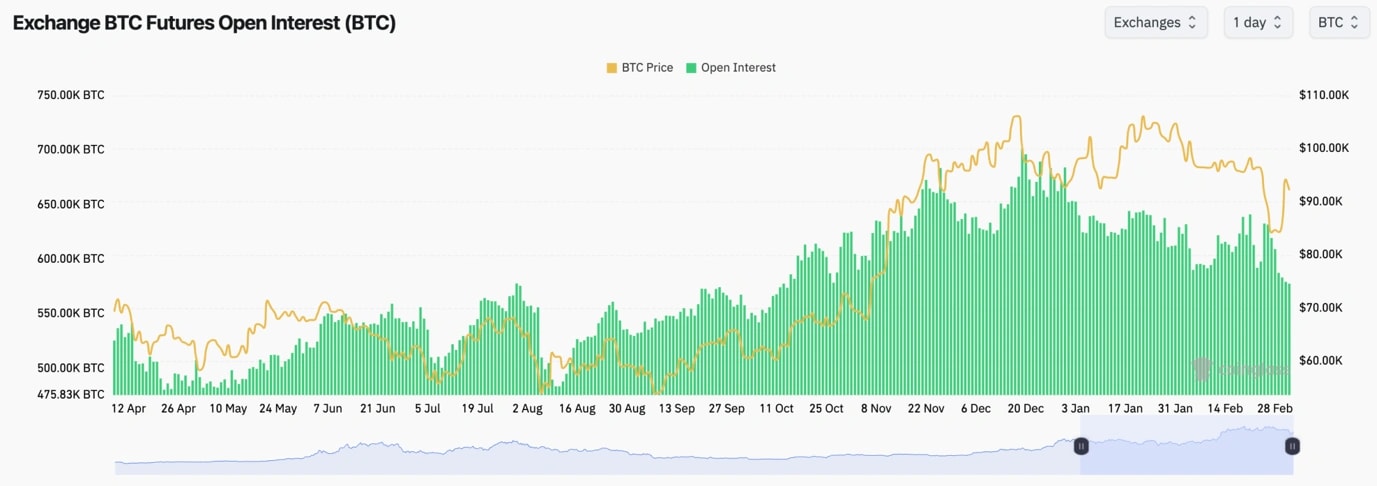
- BTC's Open Interest has continued its slight downtrend, this is in spite of the large move up yesterday in price.
- This suggests that yesterday's move up in price was a spot-driven move rather than a perps-driven one.
- Funding Rates have also remained relatively flat, with Shorts and Longs being mostly evenly balanced.
Technical analysis
- At the back end of last week, price moved in to the Yellow box, printed it's lowest oversold reading since August 2023, and price swiftly bounced.
- Price has now moved into the underside of the horizontal resistance at $95,700, and so far, it looks as if it's rejecting. Today's candle close will be an important assessment of this.
- BTC is now fighting at the major horizontal level of $91,700. This may become new support if price can hold. If price falls below it and remains below it (uses it as resistance), expect $80k again.
- The RSI has bounced out of extreme oversold territory, but remains in it's downtrend. It has now put in a hidden bearish divergence (higher high on the oscillator, lower high in price).
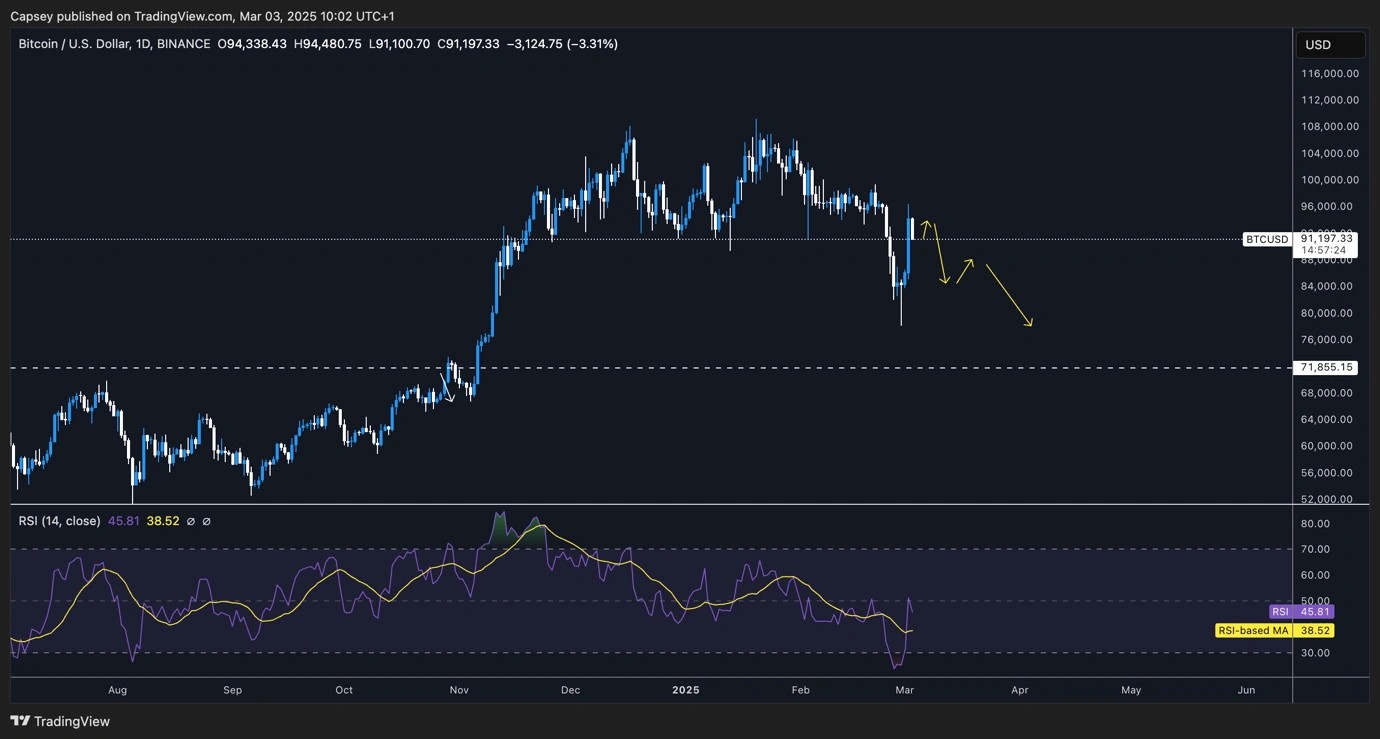
- Next Support: $91,700
- Next Resistance: $95,600
- Direction: Bearish
- Upside Target: $95,600 (maybe $98,900)
- Downside Target: $91,700 (then $87,000)
Cryptonary's take:
The move yesterday was really extreme, and you can get that kind of move when confidence/sentiment is on the floor. The good news is then overpriced as all those that have sold out rush to buy back in.For now, though, this move remains a move into high timeframe resistance, where there's a strong potential we can see a lower high put-in and price move lower in the coming month. The Crypto audience will now expect big announcements at the Summit this week. So, unless the move is ultra bullish (outright buying of coins) then expect it to be a 'sell the news event'.
The key level to watch in the short-term is $91,700. If that level is lost, and news out of the Summit isn't super bullish, then we expect lower prices. PS - the CME gap that was created is now down to $81k. It's common for gaps to be filled.
Bitcoin’s next move: $87K or $98K?
24 February 2025As Bitcoin hovers near key support, market sentiment remains fragile. With macro risks in play and resistance holding firm, traders prepare for potential downside. Let’s analyze the latest BTC trends and key levels shaping the market’s next move.
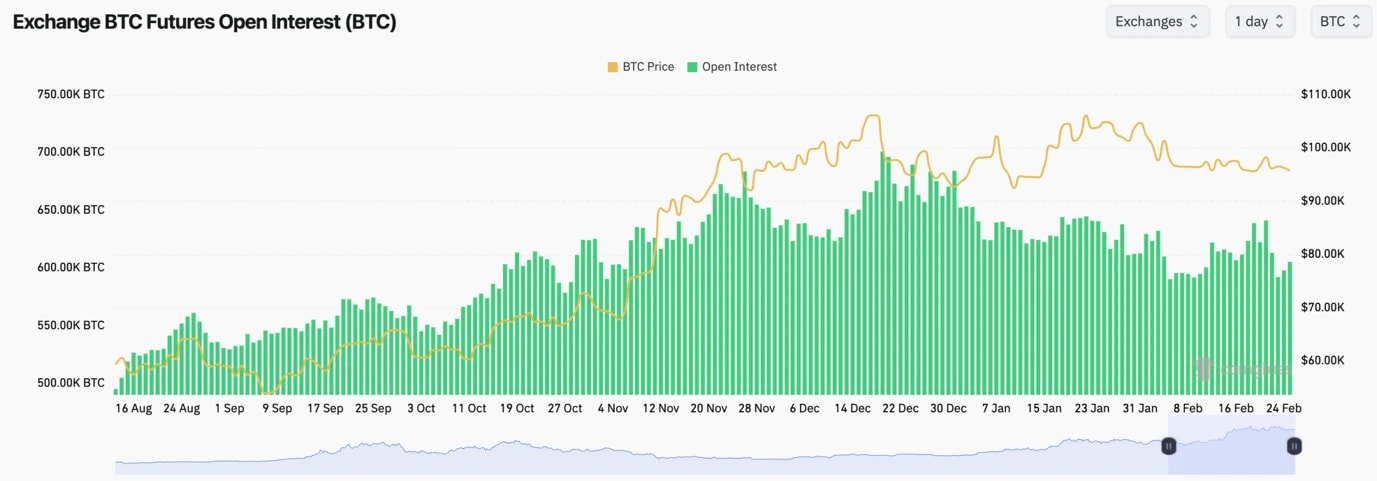
- We're still in a general downtrend for Open Interest, and it was interesting to see the OI pop higher into $99k before the price pulled back and OI came back down and into new lows.
- Interestingly, Funding Rates have mostly stayed positive, meaning Longs are still more dominant.
- This has been contrarian to the rest of the space where we've seen a lot of ALTS have negative Funding Rates.
Technical analysis
- Amazing really to see that Bitcoin has remained tight in its range.
- Bitcoin is still ranging between the major horizontal resistance of $98,900 and the horizontal support of $95,700.
- On Friday, the price tested the horizontal resistance and the local downtrend line, but the price was rejected and it's now back to the lows of the range. As we expected, the upside is capped.
- The RSI is still in a downtrend but remains in the middle territory and it's battling at its moving average.
- On the downside, if $95,700 breaks, $91,700 is the next level. We expect this level to be tested again at some point in the coming weeks.
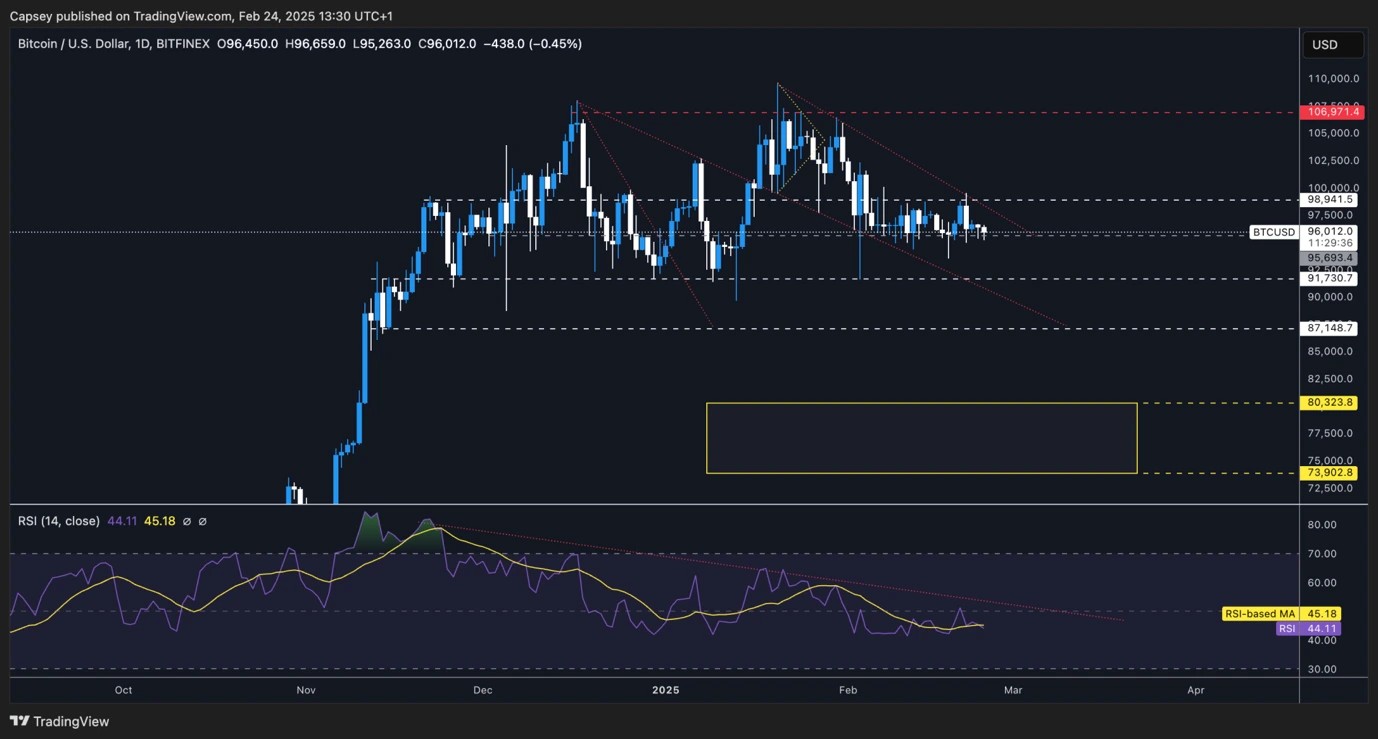
- Next Support: $95,600 (then $91,700)
- Next Resistance: $98,900
- Direction: Bearish
- Upside Target: $98,900
- Downside Target: $87,000
Cryptonary's take
Whilst it's possible for Bitcoin that we still get these small pops higher, and granted the range lows have continued to hold, but we do expect them to break. In the coming weeks, we see a more material breakdown coming with $91,700 being the likely target, although the price may extend to the high/late $80k's - $87k to $91k say.We still lack catalysts in the short-term, whilst there are macro headwinds with Trump policies (companies are cautious until they see the effects of the policies). This can potentially set us up for more downside in the coming weeks. And for now, this is what we're expecting and positioning for. If the price retests north of $98k, Shorts can be considered.
Bitcoin to $80K or $100K next?
18 February 2025Bitcoin ($BTC) remains range-bound between $95,600 and $98,900, with key support at $91,700. The funding rate suggests indecision, but downside risks persist. A breakout is coming—will BTC move higher or break lower?
Disclaimer: This is not financial or investment advice. You are responsible for any capital-related decisions you make, and only you are accountable for the results.
BTC:
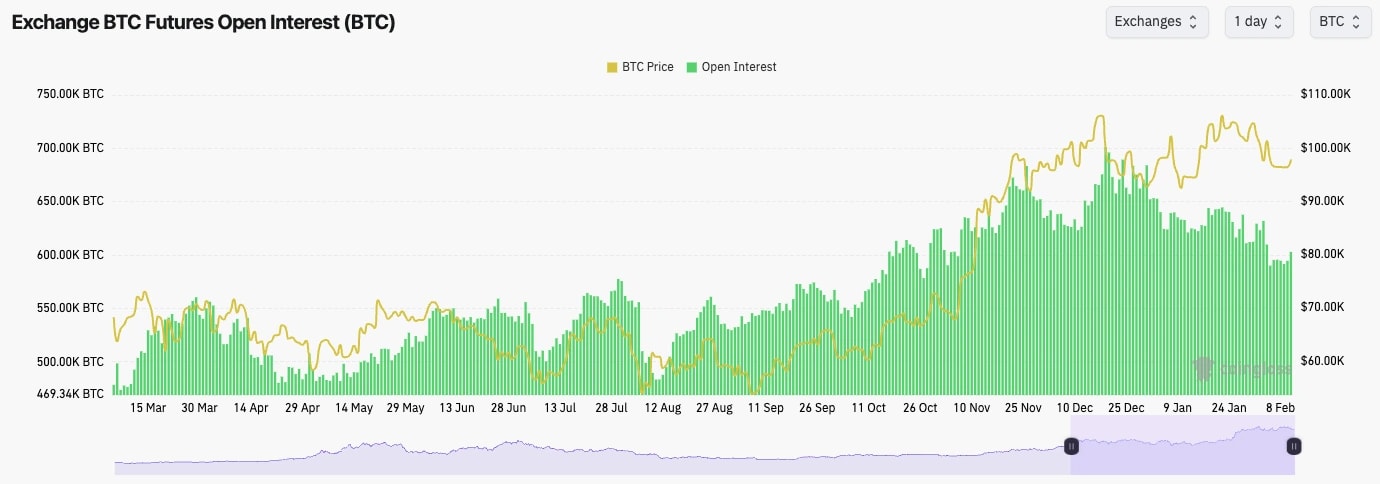
- Bitcoin's Open Interest has generally downtrended since mid-December, however, it has risen 6% from the lows in late January.
- The Funding Rate has remained positive and fluctuated between 0.004% and 0.01%. This suggests some indecision amongst traders, but still with a slight bias towards Longs.
- Overall, this is a more healthy leverage environment.
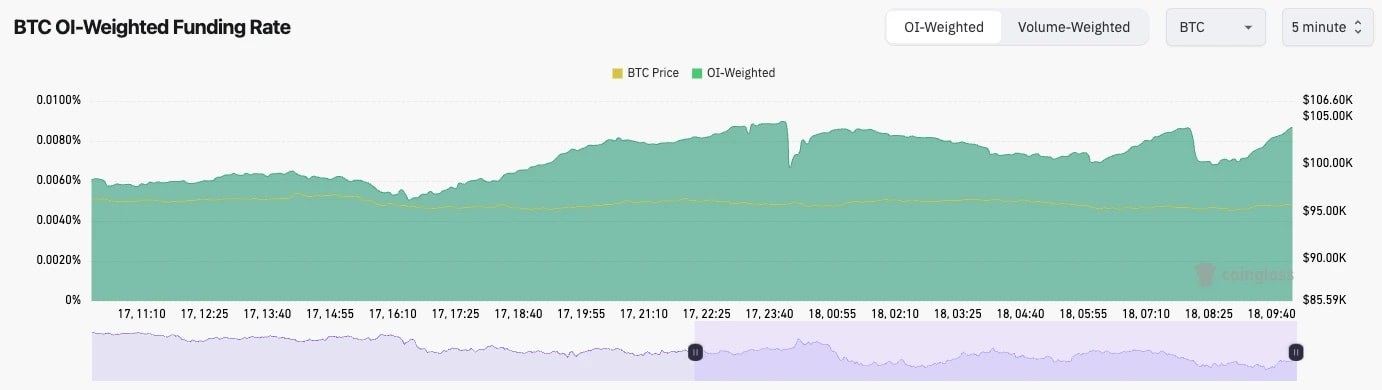
Technical analysis
- BTC has remained in a really tight range between its local support of $95,600 and its local resistance of $98,900.
- Beyond $98,900, the $100k level should act as a tricky psychological level, whilst the main horizontal resistance is at $106,900.
- To the downside, we expect $91,700 to act as key support as this also closely matches the short-term holder cost basis price ($92k).
- Sub $91,700, and the key levels are $87,100 and $80,300.
- The RSI is in relatively middle territory, so it has a downside if the price wants to go lower. The RSI is also beneath its moving average and finding that to be resistance currently.
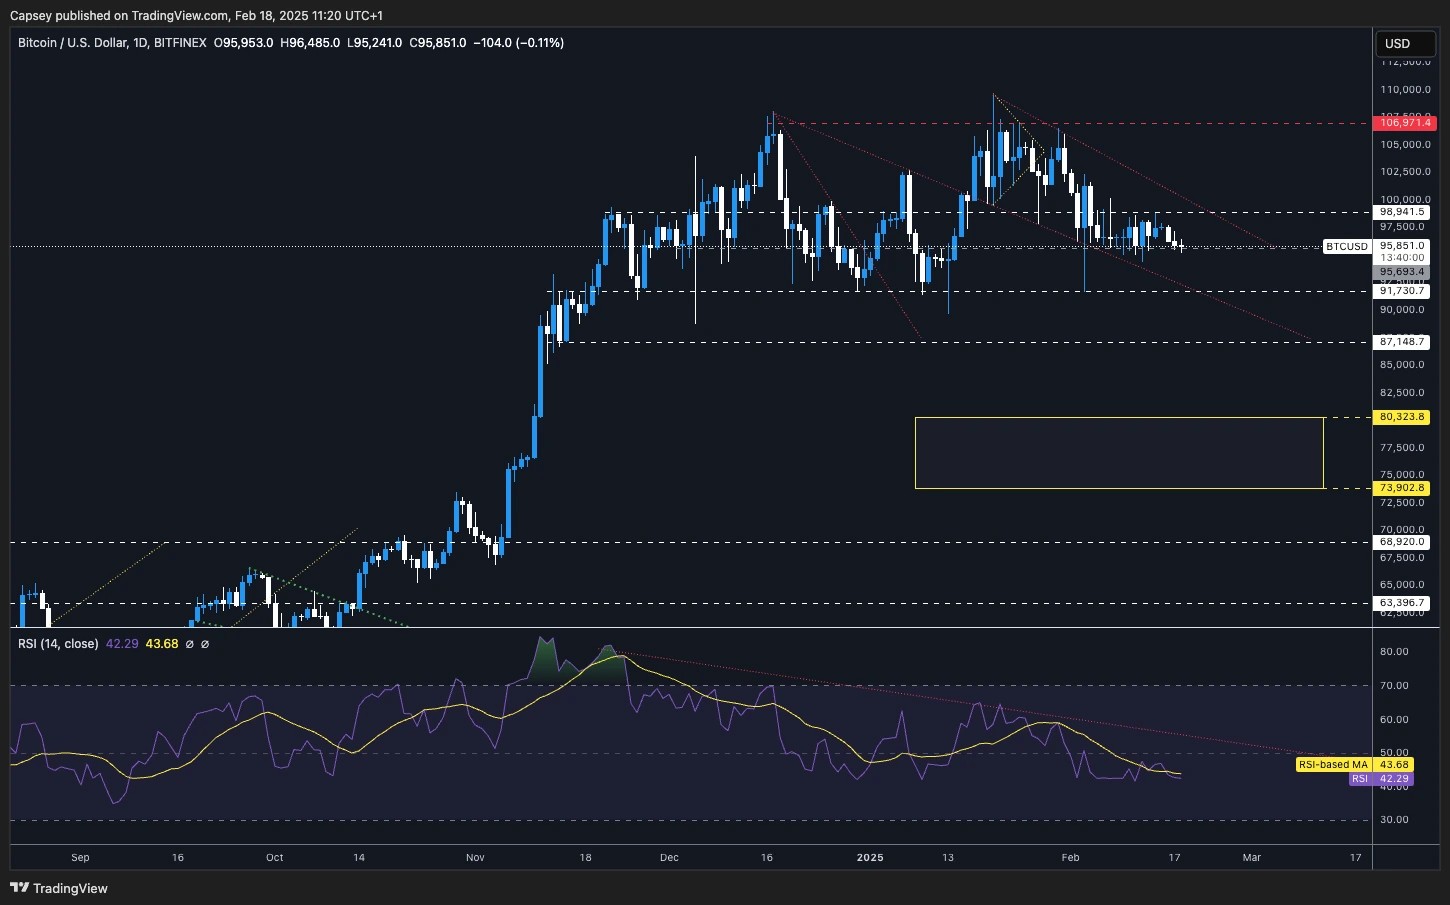
- Next Support: $95,600
- Next Resistance: $98,900
- Direction: Bearish
- Upside Target: $98,900
- Downside Target: $91,700
Cryptonary's take
Bitcoin has been in this tight range now since early February. We are expecting a break at some point soon, and we're expecting this to be to the downside. For now, we remain risk-off, however, we will look to lightly add to our long-term BTC bags between $87k and $91k. Whilst we'll more aggressively add between $80k and $87k.Will BTC hold $95.7K support?
10 February 2025Bitcoin ($BTC) is attempting to reclaim $98.9K, but resistance remains strong. Alts and meme coins are struggling, and a key retest of $91K is possible. Will BTC break out or head lower?
- BTC's Open Interest has kicked up from the lows, but only very slightly. Since the last week of December (OI highs), OI has reset by approximately 15%.
- BTC's Funding Rate has been fluctuating around neutral but it is gradually moving up to 0.01%.
- Overall, this is a positive leverage environment and we have seen a flushing out of the froth that did exist towards the end of 2024.
Technical analysis
- BTC has found some support at the horizontal support of $95,700.
- Price is now attempting to put in a small bounce, with price moving into the horizontal resistance of $98,900.
- If $98,900 can be broken to the upside, then the next level of resistance to watch would be $101,500 to $102,300.
- The RSI is in the middle territory but it is now butting up into the underside of it's moving average.
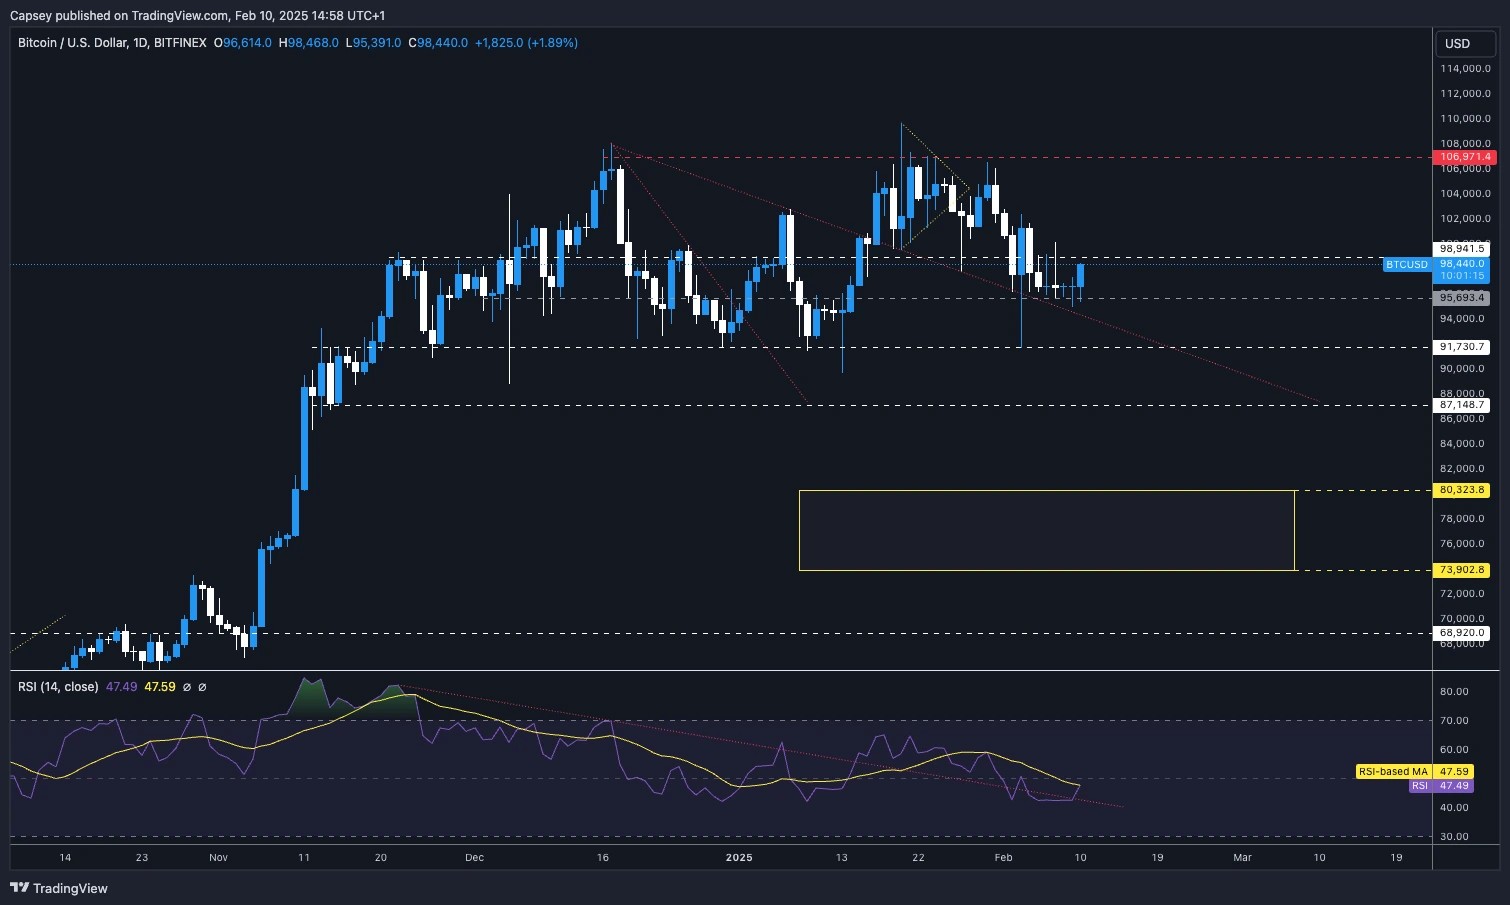
- Next Support: $95600
- Next Resistance: $98,900 (then $102k)
- Direction: Neutral/Bullish
- Upside Target: $102,000
- Downside Target: $91,700
Cryptonary's take
It is still our expectation that BTC is in a downward trend to sideways chop for the upcoming weeks, and maybe months. We view the current move as a slight relief rally.This is less the case for BTC, but particularly the case for Alts and Memes. In order for us to consider changing our stance, we'd need to see a convincing break of $104k or to see a real rapid change in the macro, which we're currently not expecting. We still expect $87k to $91k to be retested in the coming weeks.
For the traders; if BTC reaches $102k to $104k, this may open the door for a trade opportunity. A Short. However, if the price reaches those levels, we'll reassess at the time also.
BTC eyes $102K but risks $91K retest
04 February 2025Bitcoin faces uncertainty after a 5% drop due to liquidations. BTC rejected $105K resistance, fell to $91.7K support, and now hovers near $99K. Traders remain cautious as funding rates fluctuate.
Disclaimer: This is not financial or investment advice. You are responsible for any capital-related decisions you make, and only you are accountable for the results.
- BTC's Open Interest has been downtrending since mid-December, and we've seen a further 5% decline over the last 48 hours due to the liquidation event on Sunday/Monday.
- Funding Rates have been choppy between slightly positive and slightly negative, indicating traders have been chopped up. We've seen Funding Rates go from negative to positive as the price has moved up (Shorts getting hit) and then the opposite on the way down (Longs being hit).
- Ultimately, there's indecision amongst traders in the current market, and we've seen the froth come out of the market over the last month.
Technical analysis
- BTC rejected from the $105k - $106k level (top of the range) as we expected.
- Price then collapsed below the horizontal supports of $98,900 and $95,700 on the Trump tariff news.
- Price found support at the major horizontal support at the bottom of the range at $91,700. This is a key area we have marked for the last few months.
- Price recovered nicely off the back of progress around deals with Canada and Mexico. It reclaimed $98,900, and the price is now using that horizontal level as new support.
- The RSI is in the middle territory, but it remains beneath its moving average.

- Next Support: $95,700
- Next Resistance: $102,000
- Direction: Bearish/Neutral
- Upside Target $102,000
- Downside Target: $91,700
Cryptonary's take
It's very positive that we've seen a capitulation event like we saw on Sunday/Monday, and BTC is at $99k and holding in the upper end of the major range (between $91k and $107k). In the short term, we wouldn't be surprised to see a return back to $102k. However, we are expecting more downside in the coming week or two, whether that be from $102k or from the current levels. We are expecting a retest of $95k, at least in the short term.BTC range-bound between $99K-$107K
31 January 2025Bitcoin remains in a tight range between $98,900 and $106,900, with a potential pullback in sight. Meanwhile, Alts are stabilizing, and some sectors are showing signs of strength. Let’s break down key levels and market trends.
Disclaimer: This is not financial or investment advice. You are responsible for any capital-related decisions you make, and only you are accountable for the results.
BTC:
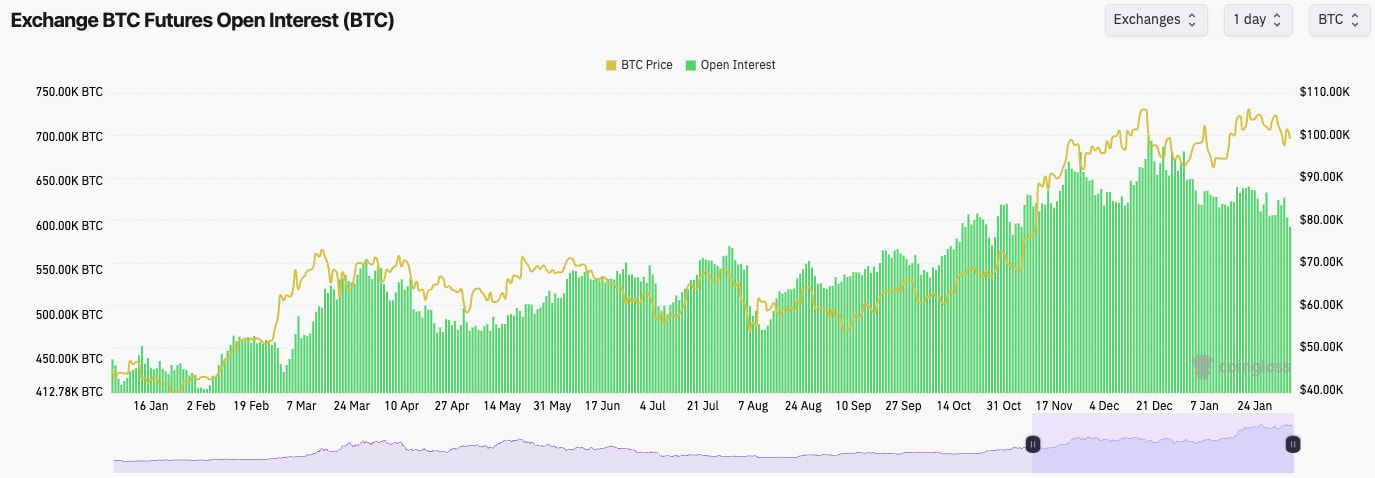
- We're seeing a lower BTC's Open Interest trend, which suggests there's less demand amongst traders to leverage it. This is positive but also expected when the market is in more choppy conditions.
- Funding Rates range from 0.00% to 0.01%, indicating there's an even balance between Longs and Shorts.
Technical analysis
- Next Support: $98,900
- Next Resistance: $106,900
- Direction: Bearish/Neutral
- Upside Target: $106,900
- Downside Target: $95,700
Cryptonary's take
Bitcoin currently ranges between $95,700 and $106,900. Whilst we're in this post-Trump inauguration period where too much good news was priced in (the market had overpriced against a realistic reality), it's possible now that we do see a pullback for BTC in the coming 1-2 weeks. It's possible BTC pulls back to $95,700 to say $98,900.We have highlighted this with a yellow arrow on the chart. We'll add two other things to this. Firstly, if BTC does pull back 5-10%, it doesn't necessarily mean Alts/memes will have another major pullback. Looking across the board, we feel most of the Alts/Memes have done the substantial portions of their pullbacks, but we also think they'll be range-bound for a while.
Secondly, in a range-bound market, it doesn't mean there won't be good pockets of outperformance. For example, $HYPE over the last 3-5 days has heavily outperformed.
Bitcoin stalls below $107,000 ahead of FOMC
28 January 2025Bitcoin remains range-bound between $98,900 support and $107,000 resistance, with traders awaiting a breakout. Institutional adoption strengthens BTC, but FOMC uncertainty keeps price action choppy. The market direction remains undecided.
Disclaimer: This is not financial or investment advice. You are responsible for any capital-related decisions you make, and only you are accountable for the results.
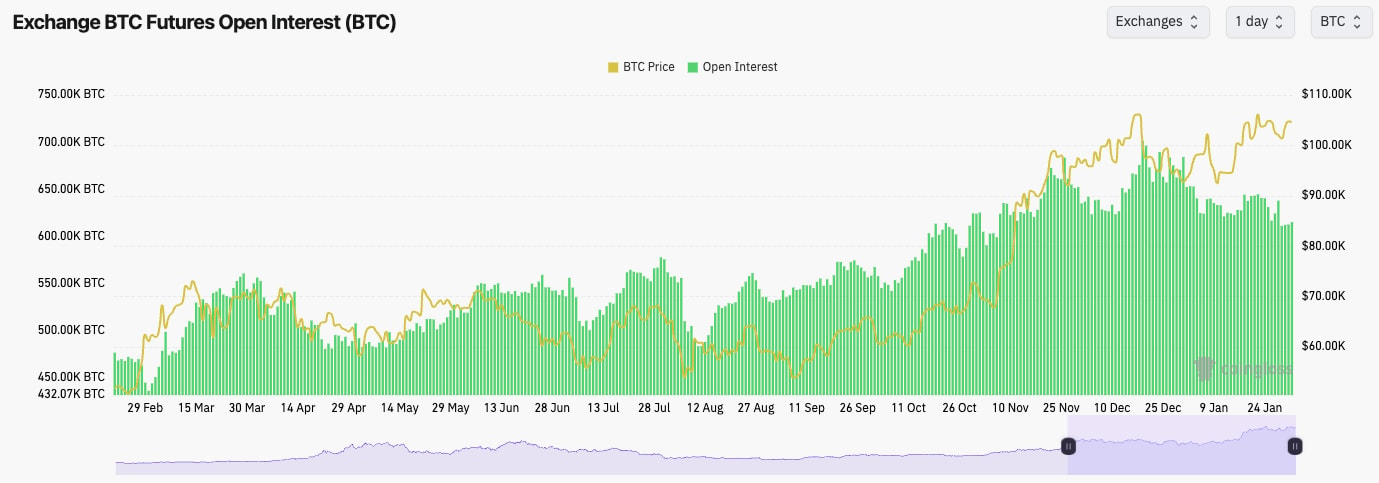
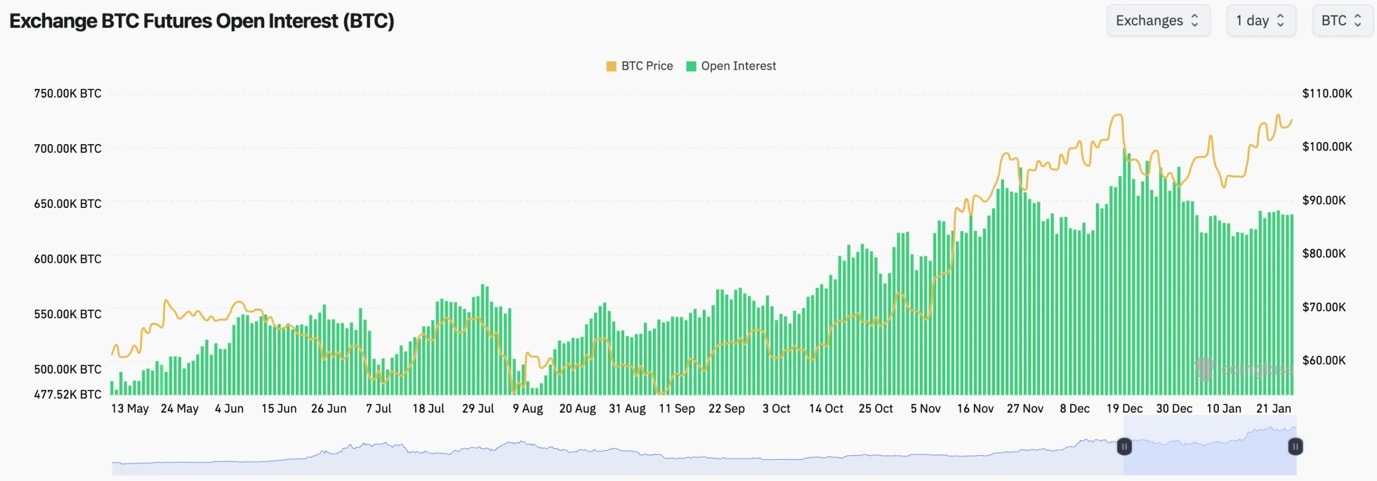
- BTC's Open Interest has continued its decline over the past few days, meaning that there's less of a leverage build-up.
- BTC's Funding Rate is at 0.01%, indicating there's an even balance between Longs and Shorts.
- Overall, this is a healthier leverage market, but that also doesn't mean that the rice has to go up because of it.
Technical analysis
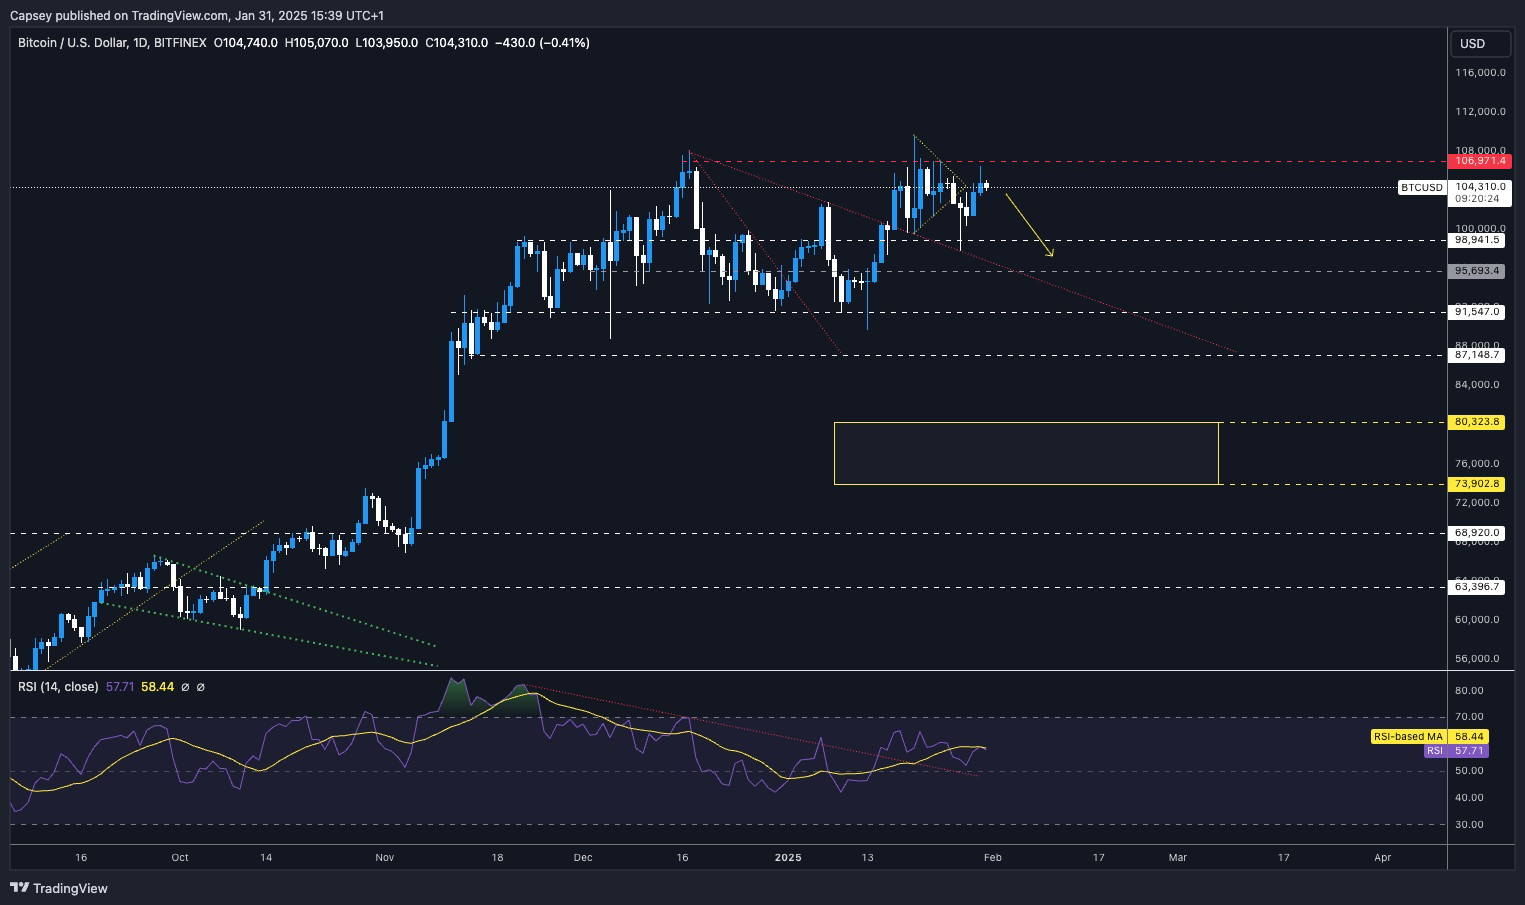
- BTC rejected into the main horizontal resistance of $107,000. This was following the announcement of 'exploring a stockpile' and not a mention of a 'Strategic Bitcoin Reserve'.
- Price formed a bullish pennant but then broke down from that pennant off the back of the DeepSeek news yesterday.
- However, the price bounced strongly from the horizontal support of $98,900, and the downtrend line was used as support.
- Price is currently just choppy and range-bound between the horizontal support of $98,900 and the horizontal resistance of $107,000.
- The RSI is in the middle territory, and for now, the only negative here is that it's below its moving average. However, that isn't something we'd get too caught up with.
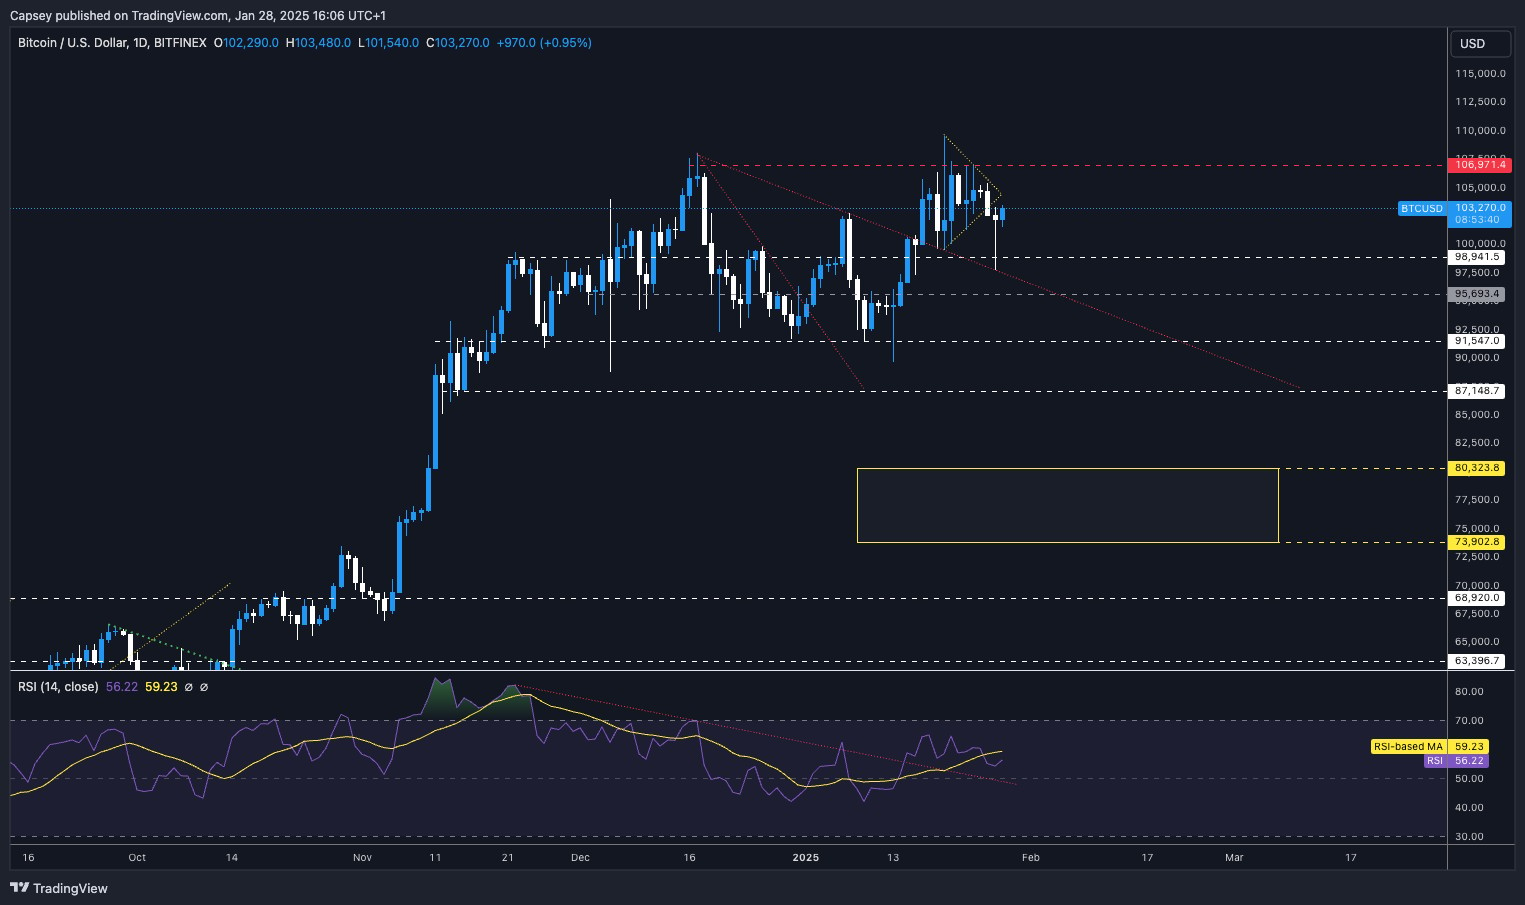
- Next Support: $98,900
- Next Resistance: $107,000
- Direction: Neutral
- Upside Target: $107,000
- Downside Target: $95,700
Cryptonary's take
Considering what Alts, Meme's, and TradFi markets have done over the last few days to a week, Bitcoin has held up really impressively. This is probably due to the fact there is this Institutional adoption happening, especially now that SAB21 has been overturned.But in the short-term, it's possible BTC price is still a tad ahead of its ski's post-Trump excitement. We're also going into an FOMC tomorrow, and the expectation is that Powell will continue in a hawkish tone.
Ultimately for now, we need to see BTC show us the direction, with either a breakout or a breakdown. There's an edge really in this choppy, range-bound price action, and in this situation, it's best to sit tight and let the market show you its hand first before you then act on that. We wouldn't be surprised if the price remained range-bound for more time as well.
$107K resistance challenges Bitcoin bulls
24 January 2025As Bitcoin ($BTC) clings to $100K support and tests $107K resistance, market participants await a decisive move. Let’s explore the latest analysis to uncover what’s next for BTC and the broader crypto market.
Disclaimer: This is not financial or investment advice. You are responsible for any capital-related decisions you make, and only you are accountable for the results.
BTC:
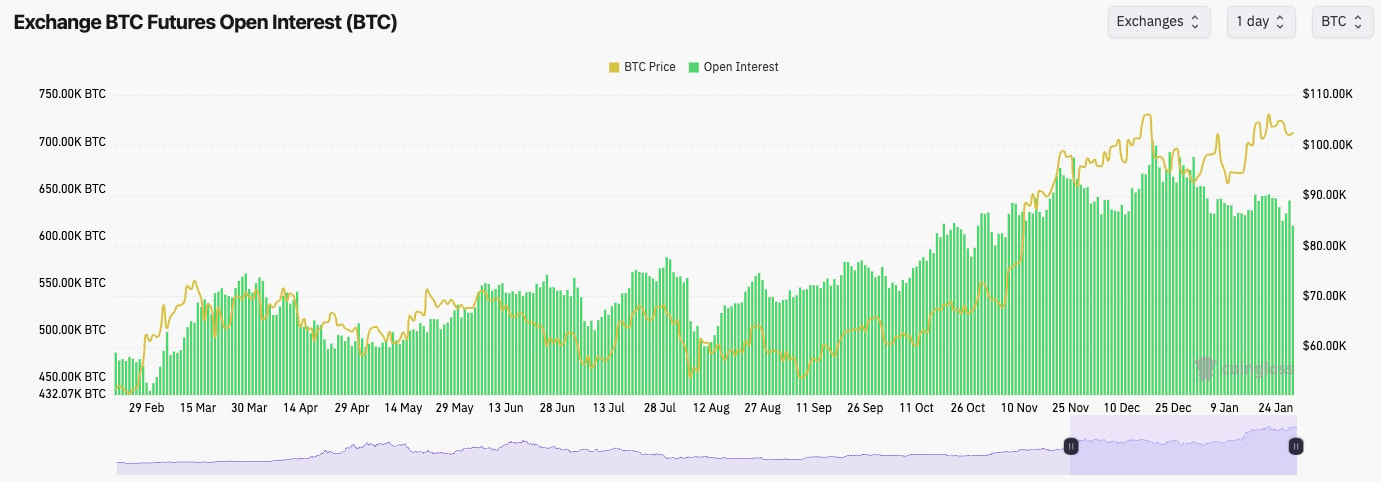
- BTC's Open Interest by number of coins has generally turned a tad lower over the last few days. We had a move-up in OI going into the inauguration, but that's tapered off slightly since.
- The Funding Rate is at 0.004%, indicating there is an even balance between Longs and Shorts currently.
Technical analysis
- Price has broken out of the downtrend line and is now range-bound between the horizontal support of $98,900 (and the psychological level of $100,000) and the horizontal resistance of approximately $107,000.
- We've also had a breakout of the downtrend line on the RSI, but that has also become range-bound whilst also putting in a bearish divergence (higher high in price, lower high on the oscillator). Although, it isn't in or close to overbought territory.
- The key support zone is between $98,900 and $100,000.
- $107k to $108k is the breakout zone to watch out for.

- Next Support: $100,000
- Next Resistance: $107,000
- Direction: Neutral
- Upside Target: $107,000
- Downside Target: $98,900
Cryptonary's take
It's been very tricky trading BTC this week with the market feeling weak at times, but also knowing that any positive pro-Crypto Executive Order could be dropped by Trump at any moment.We've seen a price rally on positive news, but it has had a decreasing effect as the week has gone on. The market had also pulled back when the news was released, and it essentially wasn't the Strategic Bitcoin Reserve. However, each time, the price has seemingly comfortably held the lows of $100k - $101k and bounced relatively swiftly.
Ultimately, this range will probably resolve itself soon. The market at times has felt weak, and the rallies into positive news have faded, which feels like a sign of exhaustion. But, on the other hand, the price comfortably held the lows when it pulled back.
BTC is very evenly balanced here, and direction is really difficult to call. We'd expect that when there is a breakout or a breakdown, it'll likely be a relatively big move in that direction. But calling the directions is super hard here.
Bitcoin eyes $108K resistance breakout
21 January 2025As BTC defends its $98.9k support, the crypto market looks to Bitcoin for direction. With key resistance at $108k, all eyes are on the next move in this dynamic landscape.
Disclaimer: This is not financial or investment advice. You are responsible for any capital-related decisions you make, and only you are accountable for the results.
BTC:
- BTC's Open Interest has crept up slightly, but it still remains quite a way from the highs we saw in mid-December.
- The Funding Rate is at 0.01%. So it's flat, with an even balance between Longs and Shorts.
- This is a more healthy leverage environment. There aren't signs of froth, but there also remains good activity.
Technical analysis
- BTC has broken out of the downtrend line, and the price has rejected roughly into the prior price all-time highs.
- But, when the price pulled back to retest key levels, it bounced nicely off of the horizontal support of $98,900, the old horizontal resistance. Price has also used the psychological level of $100k as support.
- The major resistance to the price being cleared above is $108k.
- The local resistance is at $105k
- If the price were to break down below $98,900, there are quite a few supports in the $ 90k range. The first being at $95,700 and then $91,500.
- BTC has broken out of its downtrend on the RSI, and it has come back, retested it, and moved higher. Alongside this, it's also above its moving average. Positive.
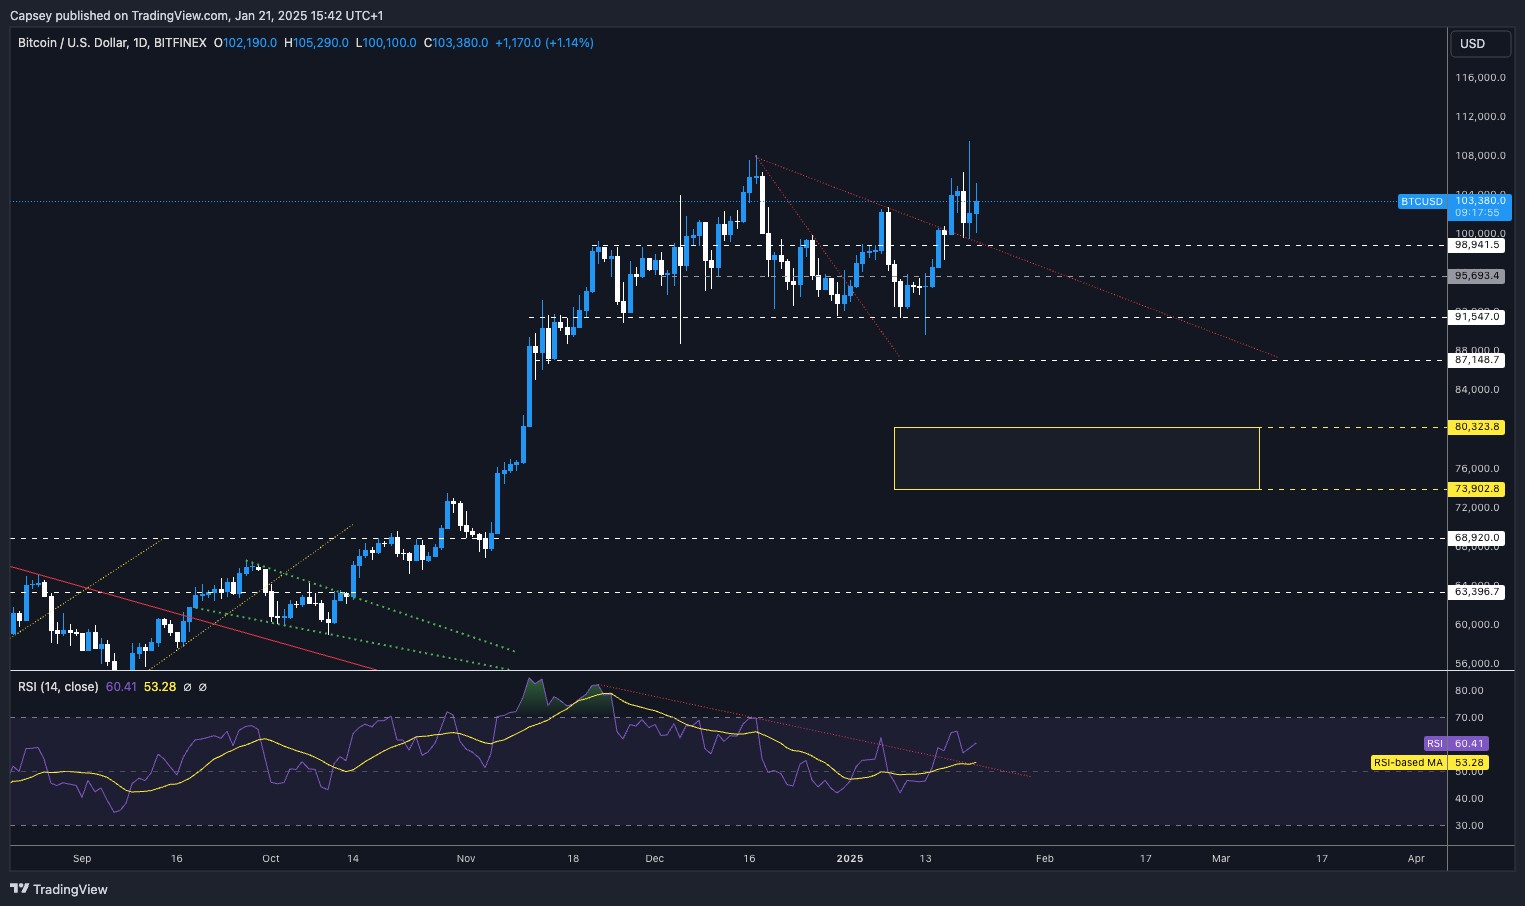
- Next Support: $100,000
- Next Resistance: $108,000
- Direction: Neutral/Bullish
- Upside Target: $108,000 (then $112k)
- Downside Target: $98,900
Cryptonary's take
BTC looks very positive here, and considering Trump didn't mention it, now that we have seen any pro-Crypto Executive Orders (as of yet), BTC has done very well to hold up at the $103k area. For now, let BTC show you its next move, either a breakout of the highs or a breakdown. The rest of the market feels a tad flat, and BTC, holding at the price it's at, seems to be what's holding the rest of the market up for now.My (Tom) personal feeling is that I'm just not sure here. I feel like BTC can come down a bit, almost a sell the news now, and we're not sure where the next major catalyst is. But at the same time, we're expecting a positive year, and in the short term, Trump can issue an Executive Order, and everything turns around. Tricky spot here. Best off just being passive and seeing how this week and price action unfolds.
I'm not scared/worried here, so let's definitely clarify that. I'd just rather get some clarity before making my mind up on positioning. But overall, BTC has held up well, considering no Executive Orders have come (yet).
Next BTC resistance: $108,000
17 January 2025Bitcoin rallies past $102,600 resistance with spot-driven momentum, fueled by pro-crypto sentiment and easing inflation. Other assets like ETH, SOL, and POPCAT are holding critical levels.
Disclaimer: This is not financial or investment advice. You are responsible for any capital-related decisions you make, and only you are accountable for the results.
- BTC's Funding Rate has returned to 0.01%, indicating an even balance between Longs and Shorts.
- BTC's Open Interest has kicked up slightly from the lows in the last 24 hours, but not in any meaningful way. This indicates that the recent rally is more Spot-driven than leverage-driven. This is positive for the bulls.

Technical analysis
- BTC wicked into the $90k's and has bounced aggressively, breaking through a number of key horizontal resistances @ $95,700 and then $98,900.
- Price is now breaching the prior local high of $102,600.
- What's also positive is that the price has seemingly broken out of the local downtrend line. We need to see how today's Daily candle closes, but so far, it looks good.
- The RSI is also breaking out of the downtrend line and coming from a middle territory, still with some way to go before it becomes overbought.
- On the RSI though, we do have to be careful of any potential hidden bearish divergences (lower price highs, higher highs on the oscillator). We'll monitor this.
- Next Support: $102,000
- Next Resistance: $108,000
- Direction: Bullish
- Upside Target: $108,000
- Downside Target: $102,000
Cryptonary's take
Overall, it's a really solid move. Mostly, this has been driven by hype/positivity around Trump issuing pro-crypto Executive Orders on day 1. It's also been driven by the positive inflation print (less inflation than what the market expected) we saw on Wednesday, plus some dovish FED speak from Waller (granted, he's about as dovish as they get, so take it with a pinch of salt).It's possible the rally will continue into Monday, despite the price being at a local resistance of $102,600, but it has smashed through the other resistances so far. In my opinion (Tom's), Trump will likely have to over-deliver next week for this rally to really continue into a multi-week/multi-month rally into new price highs.
However, if Trump drops a load of overly positive (more than what the market currently expects) pro-Crypto Executive Orders, then it's possible we will see $108k early next week.
Ultimately, I think a lot of next month will depend on what Trump does next week. If he heavily over-delivers, that is what would invalidate my thesis for lower. However, the weaker inflation print on Wednesday has also helped me invalidate my prior thesis.
BTC's $91,500 support critical now
13 January 2024Bitcoin’s struggle between $91,500 and $95,700 has traders bracing for volatility. With shorts increasing and RSI weakening, will BTC test the $80k range next?
Disclaimer: This is not financial or investment advice. You are responsible for any capital-related decisions you make, and only you are accountable for the results.
- BTC's Funding Rate is at 0.005%, indicating there is some Short interest here.
- BTC's Open Interest is up 4% from the lows but still remains 10% off the highs. The recent 4% increase is likely more dominated by Shorts. However, it is not so dominant that the funding rate has gone negative.
- Positioning is still relatively even overall here.
Technical analysis
- Bitcoin is currently playing between the key range of $91,500 (support) and $95,700 (resistance).
- Beyond $95,700, the main horizontal resistance is $98,900.
- There is a zone of support below $91,500, with that extending down towards $90,000.
- If $90k is lost, it's possible that the price dips into the low $ 80k in the short term.
- The RSI is at 41, so it's a middle-ish territory, but it probably still has room to go down further, particularly as it is below its moving average and remains in a downtrend.

- Next Support: $91,500
- Next Resistance: $95,700
- Direction: Bearish
- Upside Target: $95,700
- Downside Target: $87,000
Cryptonary's take
So far today, the price has held the lows (in the $ 90k range) and actually responded positively. However, we'll need a strong amount of bidding to push BTC into the resistance of $95,700 and then beyond that. Whilst BTC remains between $91,500 and $95,700, we remain with the view that it's more likely we'll see a breakdown and for BTC to head into the $80k's in the short-term.A breakout above $95,700 would invalidate this. Today, we have the S&P and Nasdaq gaping down, so we might see a bid there as they close the gap, which could give BTC a bid. However, we expect them to reject after the gap has been filled, and that would also likely result in BTC going lower with them. We expect BTC to head into the low $ 80k in the short term (next 1- 2 weeks). No, we don't believe the inauguration is a buy-the-news event.
Bitcoin breaks $101K, heading toward $108K
6 January 2025Bitcoin ($BTC) gains momentum with a bullish setup, targeting $108k after breaking $98,900 support. Healthy consolidation signals further upside with strong ETF inflows and technical strength.
Disclaimer: This is not financial or investment advice. You are responsible for any capital-related decisions you make, and only you are accountable for the results.
- BTC's Open Interest is down to 570k BTC from the local high of 667k BTC. This approximate 15% drawdown in OI is good and healthy to see. It means that excess leverage has been flushed, and BTC sits at $101k... super strong.
- Funding Rates are also at normal levels of 0.01%; again, excess leverage has been flushed, which is good to see.
- Overall, this is a healthy setup from a leverage perspective.
Technical analysis
- BTC found support at $91,500, and it has broken out of the local downtrend line, sending prices higher.
- We've had a move higher into the local horizontal resistance at $98,900, and on the US open today, we've had a convincing break above. We'll now be looking for today's candle closure to be in this kind of area ($101k; anything north of $100k is good).
- Beyond $98,900, the main horizontal resistance is between $101,700 and $102,500. A break above this level, and you'd expect a swift retest of $108k.
- If we get a strong close today, we'll be looking at $98,900 to become new horizontal support.
- The RSI is above its moving average, and now it's retesting its downtrend line. A breakout from here is what likely pushes us to $108k again.
- The RSI is also not too close to being overbought yet. Room to go higher here.
- Next Support: $98,900
- Next Resistance: $102,500
- Direction: Bullish
- Upside Target: $108,000
- Downside Target: $95,500
Cryptonary's take
Overall, it was a really nice and clean move so far, exactly what we wanted to see going into the first few trading days of 2025 when the big boys have come back to their desks. Today, the US open drove prices higher, which again is a positive sign. We'll be looking to see strong ETF inflows today. In the short term, we expect BTC to continue to move up here. It's possible that $108k will be retested again in the coming 5-10 days.BTC eyes $98,900 target soon
31 December 2024Bitcoin ($BTC) holds $91k support while targeting $98,900 resistance. Healthy open interest pullback and spot demand drive positive momentum despite thin order books.
Disclaimer: This is not financial or investment advice. You are responsible for any capital-related decisions you make, and only you are accountable for the results.
- Open Interest has pulled back from 660k coins to 606k coins over the last two weeks. An approximate 10% pullback in OI is healthy.
- Funding Rates remain flat at 0.01%, indicating that there isn't excessive gambling in the futures market, as would be reflected in very high Funding Rates.
Technical analysis
- Bitcoin has been in a local downtrend since mid-December, and its price is at an all-time high.
- So far, the price has found support in the high $91k's which was a prior all-time high resistance back in early November.
- We expect the low $ 90k to hold as support in the short term. But, if the price were to break lower, we'd expect $88k to be a major support.
- To the upside, BTC is moving into a local horizontal resistance at $95,700, although the price is currently attempting to push through.
- Beyond $95,700, there is the local downtrend line and the more major horizontal resistance of $98,900 that price would need to break through.
- The RSI is in the middle territory, although it is butting up against its moving average.
- Next Support: $91,000
- Next Resistance: $98,900
- Direction: Neutral (Bullish)
- Upside Target: $98,900
- Downside Target: $91,000
Cryptonary's take
What's important to note is that between Christmas and just after New Year, the order books are quite thin, so the price can move in a volatile fashion. Currently, there is an underlying Spot bid (today) which is driving the price higher, which is good to see.Bitcoin has looked really strong throughout the past month despite us seeing weakness in other sectors. Whilst it's possible that price remains range-bound between $91k and $96k, we are actually leaning more towards Bitcoin breaking out to the upside in the coming days.
This would have a potential target of $98,900, and we'd reassess price action around there once/if the move we're predicting happens.
BTC breakout could target $120K
16 December 2024Bitcoin’s fresh all-time highs face resistance, while SOL and WIF test key support levels. With markets awaiting FED signals, let’s explore the latest price moves and what's next.
- BTC's Open Interest (by the number of coins) has increased again as the price has hit a new all-time high. However, OI still remains slightly below the highs prior to the leverage flush out.
- The Funding Rate has also remained positive but flat at just 0.01%.
- Overall, this is a positive setup from the mechanic's viewpoint, with BTC moving into all-time highs.
Technical analysis
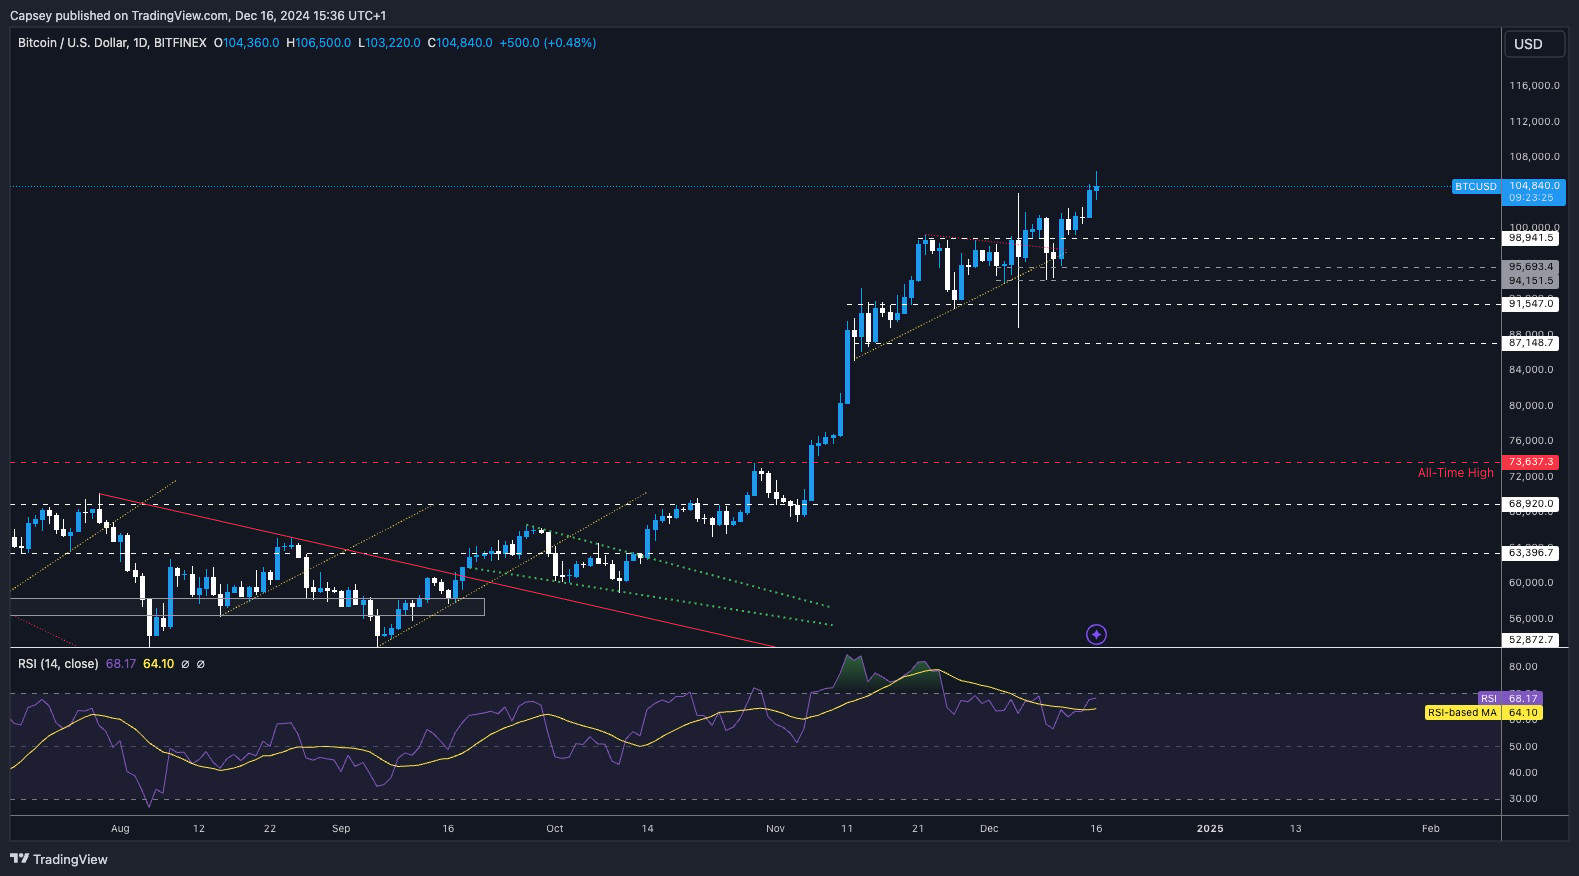
- TA-wise, the BTC chart is quite awkward-looking here, with not many clear levels.
- BTC popped higher last night into a new price all-time high, but it has pulled back slightly today.
- Over the last two weeks, BTC has hammered out the $99,000 level as a new horizontal level, so we are now looking at that as a new horizontal support.
- The major zone of support is between $87,100 and $91,500; however, we're not confident that BTC will revisit those levels again. If it did revisit, we'd be buyers in that area.
- To the upside, yesterday's all-time high of $106,500 is the new horizontal resistance, and then you're looking at psychological levels, e.g., $100k, $120k, etc.
- The RSI is no longer overbought, but we have formed a bearish divergence again (a higher high in price and a lower high on the oscillator).
- Next Support: $98,950
- Next Resistance: $106,500
- Direction: Bullish/Neutral
- Upside Target: $115k (by Christmas)
- Downside Target: $95,700
Cryptonary's take
Overall, BTC does feel really strong with any meaningful dip being swiftly and aggressively bought up, and that's price action you have to pay attention to. Since breaking above $100k, BTC has had a number of pullbacks, and this has now formed a number of strong support areas, which we see as important for BTC to end up pushing up even further.In the immediate term, we're unsure of BTC's direction. We appreciate that BTC has been very strong, and we expect it to continue in this way. However, this week's price action might be determined by the FED Press Conference on Wednesday, although we are expecting a dovish Powell, who we think could reassure the markets on a further rate-cutting path in 2025.
BTC eyes $104,000 resistance soon
11 December 2024As BTC recovers from a major leverage flush and tests key support at $94,100, all eyes are on the FED meeting. Could this consolidation fuel the next breakout? Let’s explore BTC’s latest price action and outlook.
Disclaimer: This is not financial or investment advice. You are responsible for any capital-related decisions you make, and only you are accountable for the results.
BTC:
- BTC's Open Interest has pulled back by 10% over the last week. This reset was needed.
- Funding rates have also returned to normalised levels (around 0.01%), having been at extremely elevated levels a week or so ago.
Technical analysis
- Quite messy price action and technical analysis here, to be honest.
- We had the deleveraging event for BTC last week, and since then, the price has recovered, having tried a run back to the highs but ultimately rejected.
- Locally, we now see $94,100 to $95,700 as a new local support zone.
- The main horizontal resistance remains at an all-time high at $104,000. However, there is now also a local resistance at $101,500.
- The last week of price action has seen the RSI meaningfully reset, and it is now not very close to overbought territory.
- Next Support: $200
- Next Resistance: $250 - $260
- Direction: Neutral
- Upside Target: $300 (then $330)
- Downside Target: $200
Cryptonary's take
After the deleveraging events we've seen recently, it may take more time for confidence to come back in. But, as a minimum, we're expecting the price to be range-bound here for more days/a week. Although, we do think the next major move will be higher and a breakout to the upside. If we do see a further period of consolidation, we wouldn't see this as a bad thing. We look at the current setup very positively.BTC is at $99,300 (a 5% move from all-time highs) and it is following a major leverage flushing out. This looks really healthy and clean to us here. We're expecting higher either this weekend or next week. The only thing to keep in mind with trading going forward is next week's FED Meeting on the 18th.
$100K breakout to $110K possible
06 December 2024Bitcoin ($BTC) underwent a healthy leverage flush-out, resetting funding rates. Major support held strong, and $BTC now targets $104K-$110K, signalling potential upside momentum this week.
- Yesterday, BTC underwent a small leverage flush out.
- This is where too much leverage was put on, in this case, in Longs, and as prices came down, these late Longs were flushed out.
- On Binance, the Open Interest fell from 98k BTC down to 91k BTC, so a 10% move down in Open Interest.
- The Funding Rate had also moved too high (too much Long leverage). It was at 0.1%, which is approximately 10x too much. Since the flush out, Funding has reset to 0.01%, so there is a large decrease.
- This leverage flush-out was needed, and it is healthy in bull markets.

Technical analysis
- Wow, what a candle that was yesterday.
- We had a breakout of the bullish pennant, and upon this breakout, we saw Longs really pile in.
- Too much leverage left Longs vulnerable to a flush-out, which is exactly what we got.
- The flush out was swift, with the price pulling back all the way to $90,500. However, it was aggressively bought up.
- The $87,000 to $91,500 zone we identified as our major support is exactly where the price bounced from.
- Price now finds itself back in the bullish pennant, squeezing towards its highs of the last fortnight.
- If the price can break back above $100k, then it's very likely that the price swiftly moves back to $104k 105k.
- The RSI remains just shy of overbought territory, so there is room for the price and this indicator to move higher.

- Next Support: $91,500
- Next Resistance: $104,000
- Direction: Bullish
- Upside Target: $104,000 (then $110,000)
- Downside Target: $91,500
Cryptonary's take
Yesterday's flush-out had seemed inevitable over the last week or so as we've seen Open Interest continue to move up. As soon as funding began to ramp up aggressively, Longs became vulnerable, as we expected it would be.This then happened (late Longs piled in) upon a clean breakout of $100k. We see yesterday's price action as necessary in this kind of market, and bull markets need this to happen in order for the bull to continue. So, we see it as really healthy and necessary.
We still expect that Bitcoin can break out over the coming days/week. It's possible there's more range-bound at these higher $90k levels, but we do expect another breakout to the upside to come in the coming week. We wouldn't be surprised to see BTC back to $104k by the end of play this Sunday.
BTC at $100k breakout zone
04 December 2024Bitcoin ($BTC) holds strong above $91k, forming a bullish pennant targeting $100k-$105k. Open Interest dips slightly while funding rates climb, signalling cautious optimism in the market.
- BTC's Open Interest remains high, although it has pulled back approximately 9% over the last week, as BTC has been in the range bound at $ 90k.
- BTC's Funding Rate has crept up over the last few days, now up to 0.035%. This is beginning to get somewhat elevated, and therefore, a pullback in price could catalyse a further pullback. For now, we're not too worried, but we're watching to see how this develops.

Technical analysis
- Price has held up really well in the mid $90k's, which continues to be a positive development.
- The price is also well above the more major horizontal support of $91,500. If the price were to break below $91,500, we'd expect $87k to be the next major support.
- Price is now also in a bullish pennant, as outlined by the borders. This has a bias to break out to the upside, with a target being between $100k - $105k, assuming huge sell orders don't move back in at the $100k level again.
- To the upside, it's $100k, which is the clear level for the price to clear above.
- The RSI has pulled back, having been substantially overbought, and now it's just shy of overbought territory at 63. This is positive.
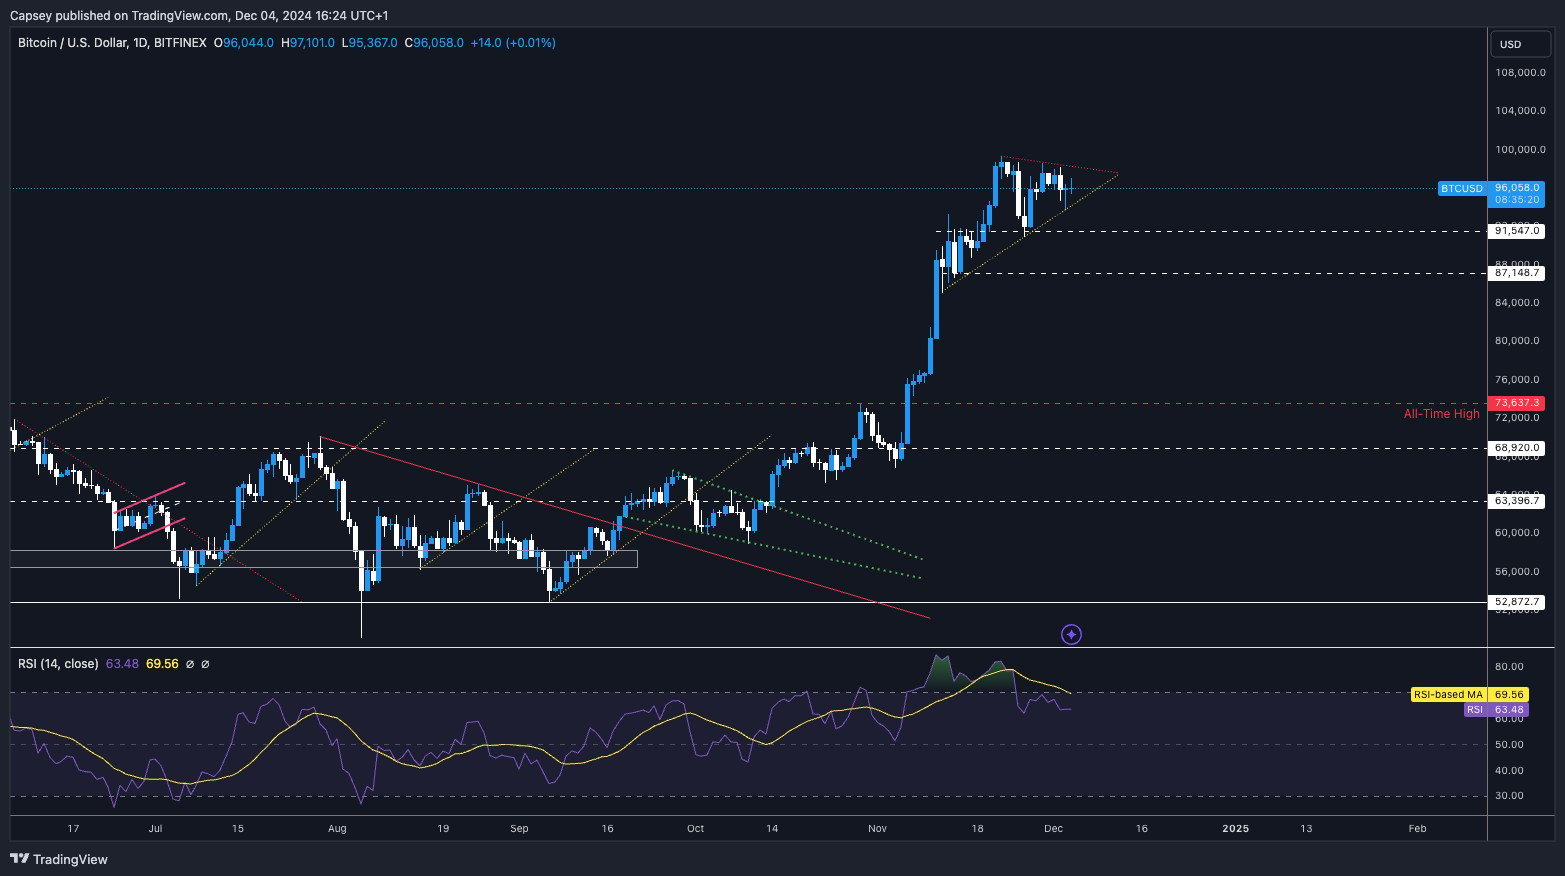
- Next Support: $91,500
- Next Resistance: $97,500
- Direction: Neutral/Bullish
- Upside Target: $100k to $105k
- Downside Target: $87,500
Cryptonary's take
At the start of the week, the thinking was that BTC might be range-bound for more time, and therefore, the range between $87k to $91k might be a possible downside target. However, over the last few days, we've seen strong Spot buying pressure, with price dips quickly and aggressively bought up.It's possible in the coming days, and due to the lack of breakdown for price, it's possible that we might be close to a break out to the upside. It's hard to judge here, as we also see it as possible that the price is range-bound for more time. We're bullish/neutral here.
Bitcoin eyes $99,500 this week
29 November 2024Bitcoin ($BTC) is consolidating between $91,500 support and $99,500 resistance, resetting RSI levels. A breakout toward $100K or a dip to $87K support is in focus.
Disclaimer: This is not financial or investment advice. You are responsible for any capital-related decisions you make, and only you are accountable for the results.
- BTC's Open Interest remains very high, although denominated in coins, and BTC's OI has pulled back approximately 5% since OI peaked, just following the price's all-time high.
- Bitcoin's Funding Rate remains elevated. However, it is not at excessive levels that might suggest that a flush-out is imminent.
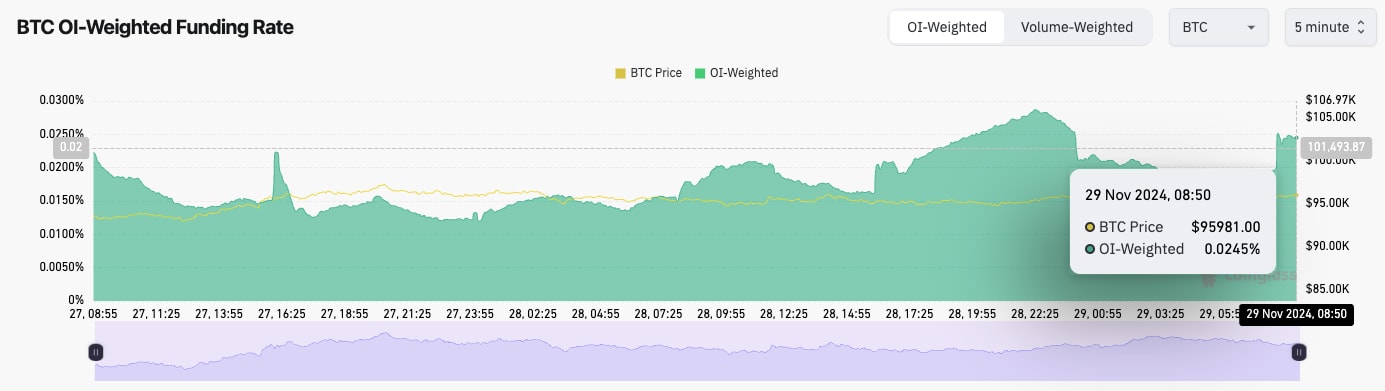
Technical analysis
- For the last few days, BTC has been range-bound between its all-time high of $99,500 and the prior resistance, now flipped new support at $91,500.
- This range-bound price action has helped the RSI pull back slightly from overbought territory. However, it's still close to overbought territory. Further consolidation would likely see the RSI continue to pull back.
- On the downside, the support for BTC is $91,500 and then $87,000. Whilst we don't rule out a break below $91,500 (but we think less likely), we expect $87,000 to be major support.
- On the upside, the all-time of $99,500 and the psychological level of $100k will act as the major resistance zone.
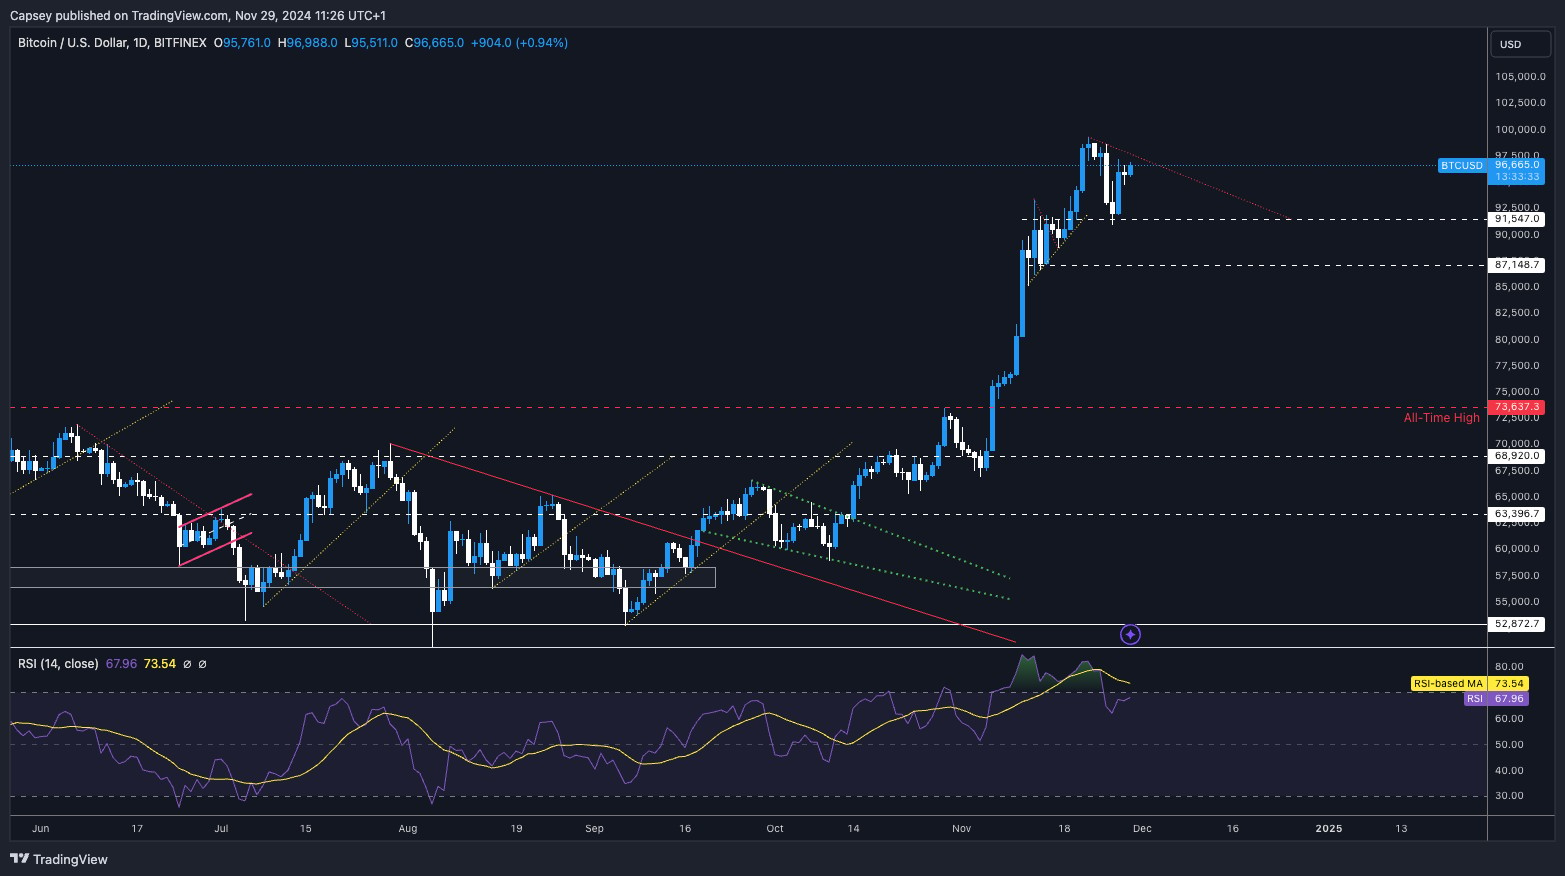
- Next Support: $91,500
- Next Resistance: $99,500
- Direction: Neutral
- Upside Target: $99,500
- Downside Target: $91,500
Cryptonary's take
As we expected, Bitcoin holds between $91,000 and $99,500 in this range. It is really positive to see that prices are consolidating at these higher levels following such a huge move after the US Election.We expect to see the price continue to be range-bound for possibly another week. We would see this as positive as it would continue to reset some of the indicators that were significantly overbought. It's important in larger uptrends to have periods of consolidation. This is what we believe we're getting now before the next leg higher.
BTC eyes $87k support zone
26 November 2024Bitcoin faces a pivotal week as it retraces to $92k, with funding rates and RSI signalling a healthy pullback. Altcoins await their moment, promising excitement in this ongoing crypto bull market. Let’s explore the action ahead.
Disclaimer: This is not financial or investment advice. You are responsible for any capital-related decisions you make, and only you are accountable for the results.
- As BTC has retraced from $99k back to $92k, Open Interest (the amount of leverage in the system) has pulled back very slightly, although it still remains very high.
- The Funding Rate has also crept back up again to 0.038%, indicating that new Longs have piled in on this 7% price pullback for BTC.
- In bull markets, it's common to see the amount of leverage be high. However, currently, this doesn't strike us as enough of a flush out yet. Therefore, it's possible that BTC could still see slightly more of a pullback here, potentially somewhere between $87k and $92k.
BTC funding rate (5min timeframe):
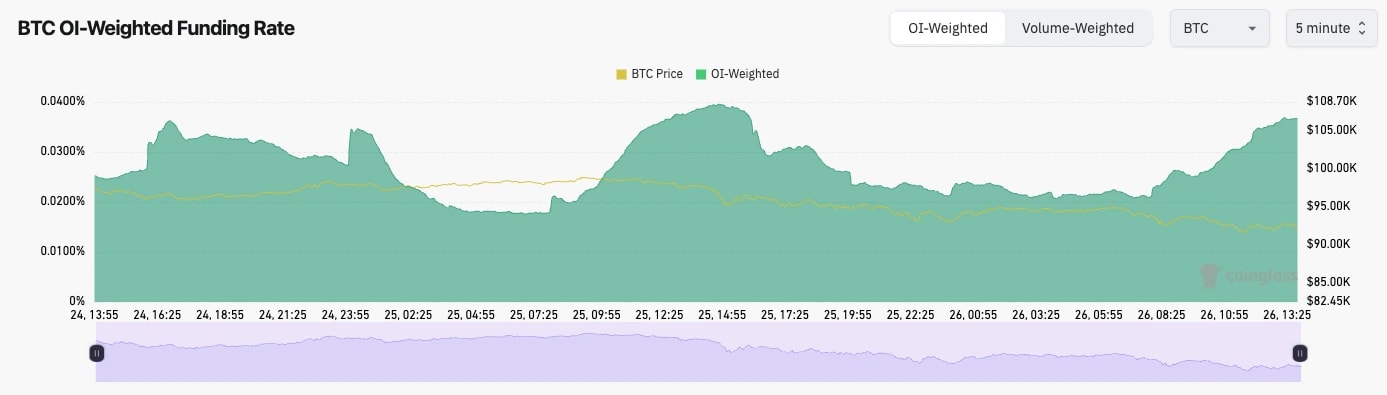 Technical analysis
- BTC broke out of the bullish pennant at the $92k level and immediately moved on to $99k, where it was met with large sellers at $100k. As to be expected at that psychological level.
- The price was extremely overbought, and as we mentioned in our last update, it had caused a bearish divergence. This is now playing out with price pulling back.
- This pullback has seen the RSI pull down from extremely overbought territory to 61. This is welcome, and we'd even welcome slightly more.
- Price is now resting on top of the old local resistance ($92k) and the new local support of $92k.
- Beneath $92k, there is a more significant support zone between $87k and $92k. We expect the price to find support in this zone, and we'd be extremely surprised if the price were to fall below $87k in the short term.
- On the upside, the resistance is at an all-time high of $99,500.
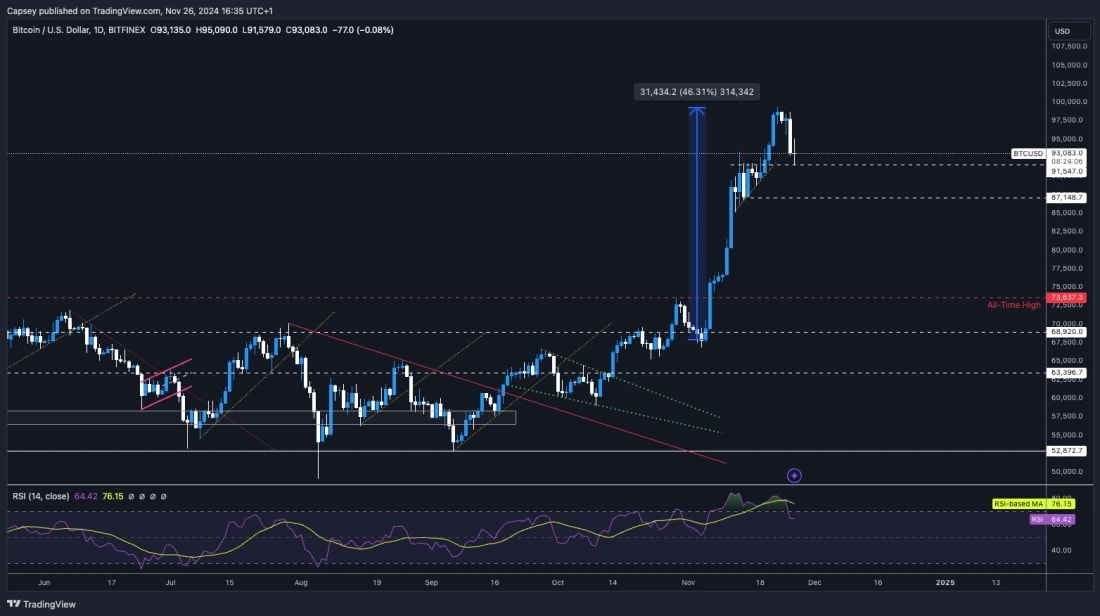
- Next Support: $91,500
- Next Resistance: $99,500
- Direction: Neutral
- Upside Target: $99,500
- Downside Target: $87,000
Cryptonary's take
Price was up 46% in 3 weeks (since the election), and a pullback was absolutely needed. And we had called for this for the last week, where we have exercised some caution across the board. This pullback for price is very normal in a bull market, and it might feel worse in that most don't have much exposure to BTC, and rather Alts and Meme's, which, in our view, are yet to really have their run.We expect BTC to find support over the next week, probably below $92k, but between the range of $87k and $92k. What we're looking for is a break into the range (between $87k and $92K) and enough of a breakdown that we see the Open Interest pull back more substantially and Funding reset. We expect this over the next week. Once/if we get that, we'd look at that as being the local bottom.
For now, we're sitting tight in Spot positions, as we signalled for last week. We are in a majorly bullish environment overall, so it would feel wrong to sell Spot when we expect much more from this market over the coming months. We remain in Spot, with no plans to sell soon.
Bitcoin’s upside: $110k projection
22 November 2024Euphoria drives Bitcoin upward, but with $91k support and $100k resistance in play, pullback risks loom. Explore BTC’s critical levels and potential outcomes.
Disclaimer: This is not financial or investment advice. You are responsible for any capital-related decisions you make, and only you are accountable for the results.
- Open Interest (the amount of leverage in the system) remains really high.
- The Funding Rate is higher than normal, but it's not currently majorly overheated. We have also seen that it has got too high over the last week (twice), and it's pulled off again without the market pulling back and flushing the leverage out.
- With Open Interest as high as it is, it's likely we will see a flush out at some point, but that may take time.
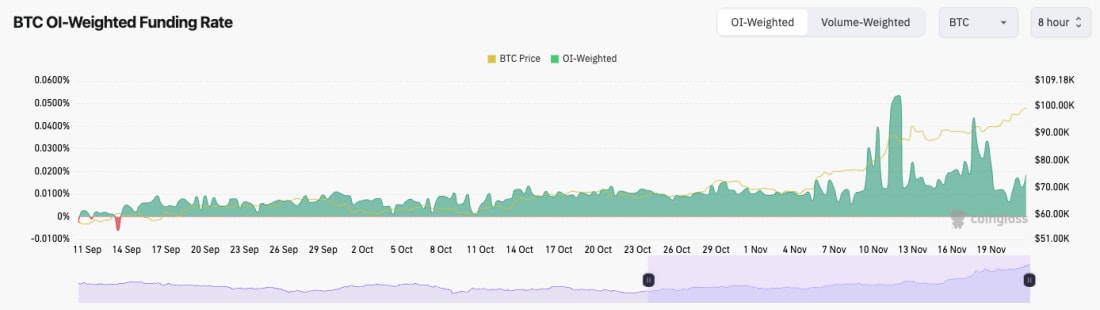
Technical analysis
- Bitcoin broke out from its bullish pennant and broke to the upside, just stopping shy of the psychological $100k mark.
- The small consolidation of price action in the low $90k's can likely help as support if BTC were to see a pullback.
- Below $91k, the next horizontal support would be at $87,000.
- On the upside, the resistance is now at the psychological level of $100k.
- The RSI has printed a bearish divergence (higher high in price, lower high on the oscillator). A breakdown target for this might be between $91,000.
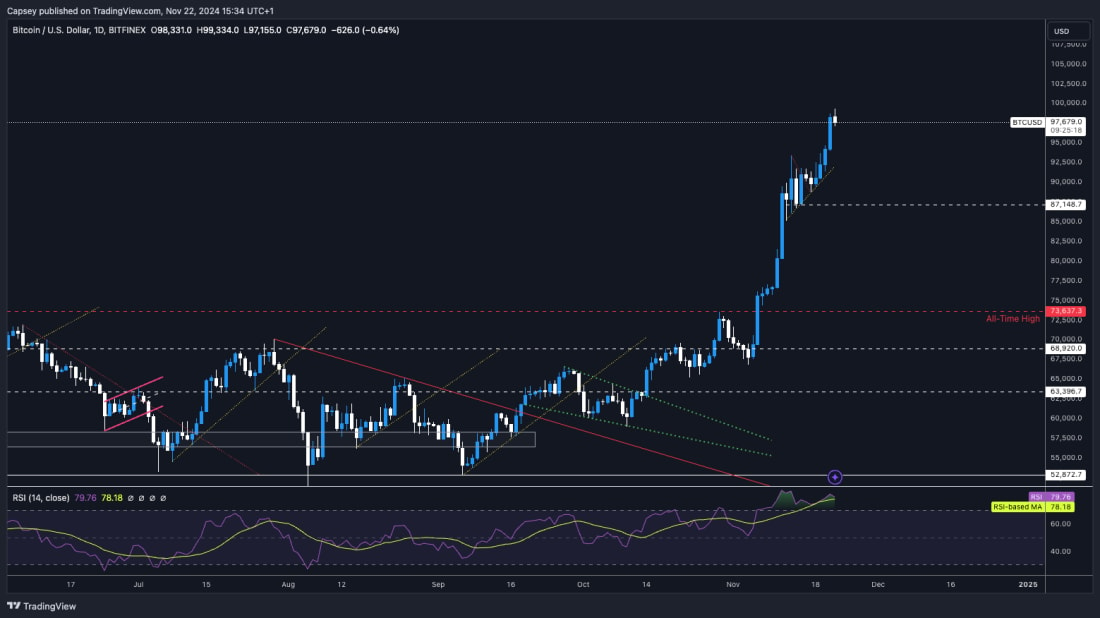
Get the latest Bitcoin price prediction—dive into our detailed analysis to stay one step ahead!
- Next Support: $91,000
- Next Resistance: $100,000
- Direction: Neutral
- Upside Target: $110,000
- Downside Target: $91,000
Cryptonary's take
Similarly to our last update, BTC is grinding on higher as we're in this euphoria part of the cycle. However, it is very overbought here, and it has printed bearish divergences. This usually results in a bearish outcome. But because we're in the euphoria period, it's possible that the price will also continue grinding higher.We're of the opinion that a pullback might be on the cards quite soon, but we'd be buyers of any meaningful pullback (7-15%). We expect prices to keep grinding higher, but we'll see a number of pullbacks along the way. We believe the odds of a pullback have increased here, and we wouldn't be surprised if we got one in the next few days to a week.
BTC’s $93k resistance approaching fast
19 November 2024- BTC's Open Interest (in USD value) is massive. In the last three weeks, OI has increased by 43%. But, the BTC price has increased by 50% since one month ago.
- The Funding Rate is creeping higher again. For now, it's still ok. But, if it were to rise substantially further, then this may result in a leverage flush out with the price falling. When this happened a week ago, the price went from $92k down to $87k. So, not that bad, really.
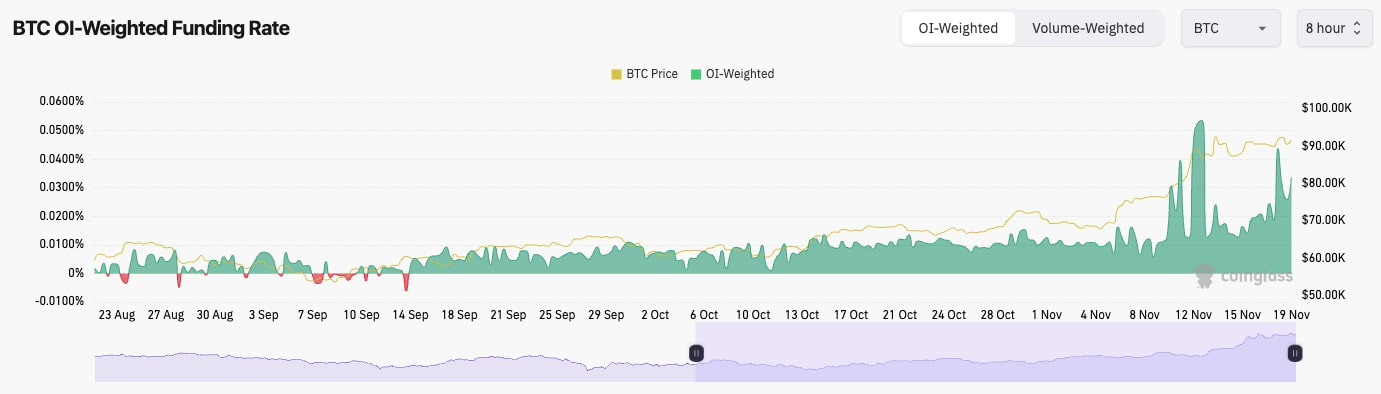
Technical analysis
- BTC has managed to remain around its highs in the low $ 90k range, which is impressive considering the size of the rally from the late $ 60k.
- Price is holding its local uptrend line, but currently, it's finding the $93,000 level as a horizontal resistance.
- Price has used the $87,100 area as support, so that'll be the first area to watch on a possible price breakdown.
- Beneath $87,000, the levels are tricky to identify. But, if the price does fall below $87k, we'd expect $82k to be the support.
- The RSI has remained in overbought territory, and it is currently printing a bearish divergence (higher high in price, lower high on the oscillator). In the euphoria phases of the market, BTC can shake off bearish divergences, but we would be somewhat wary of this one.
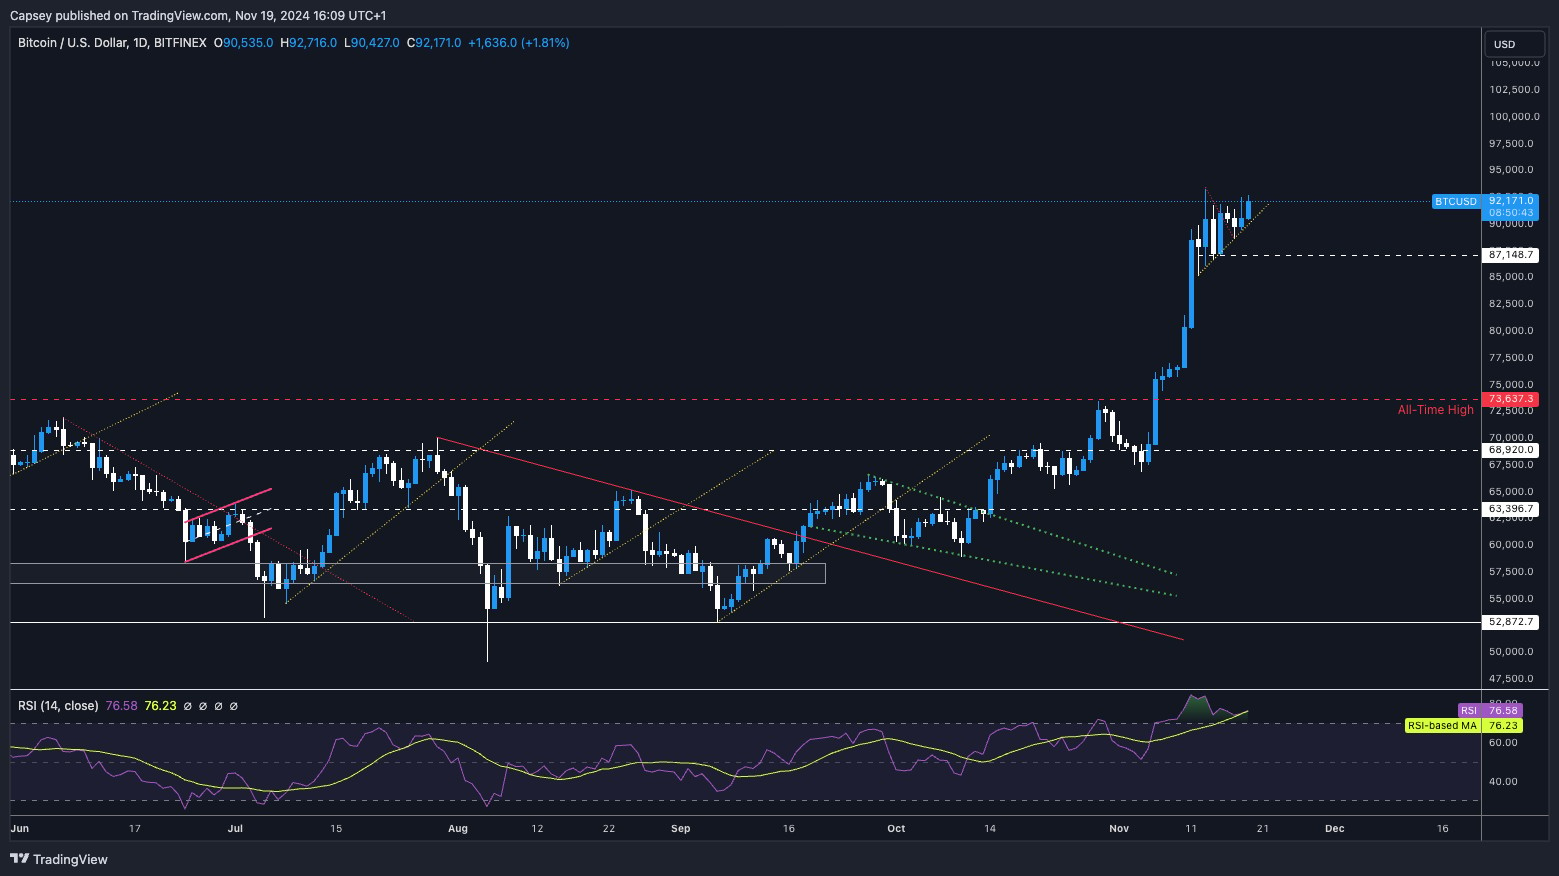
- Next Support: $87,000
- Next Resistance: $93,000
- Direction: Neutral
- Upside Target: $100,000
- Downside Target: $87,000
Cryptonary's take
Price has had a mega move up, and with Open Interest and Funding where it is, we wouldn't be surprised to get some sort of flush out to the downside. However, if we did, we'd expect it to be shallow. On the other hand, we do believe BTC is in the "euphoria phase" of the market, and these moves higher can just continue.Therefore, we remain bullish in the medium term, and we continue holding all spot positions. However, we're open to the idea that there may be a 5-10% pullback in the short term. But we're not super confident about this, and we wouldn't sell Spot bags with the aim of re-buying them at a lower price. Retail participants are beginning to come in, and that can just continue to push prices higher for now, so we wouldn't be surprised to see BTC continue to increase.
In short, we're in a bullish environment, but it's possible we're slightly over-extended in the very short term. We're super bullish on all other timeframes, and it's also possible that BTC will just continue to rip in the immediate term. No plans to sell anytime soon.
$100K in sight for Bitcoin
15 November 2024Bitcoin ($BTC) is balancing between $87K support and $93,300 resistance, with funding rates reset and mixed signals from a bullish pennant and bearish divergence.
Disclaimer: This is not financial or investment advice. You are responsible for any capital-related decisions you make, and only you are accountable for the results.
- BTC's Open Interest still remains high (as measured by the number of coins), suggesting there's still a lot of leverage in the system here.
- BTC's funding rate has been substantially reset, meaning that there is a more even balance between Longs and Shorts. This is a healthier leverage setup than when Funding was 5/6 times the current level.
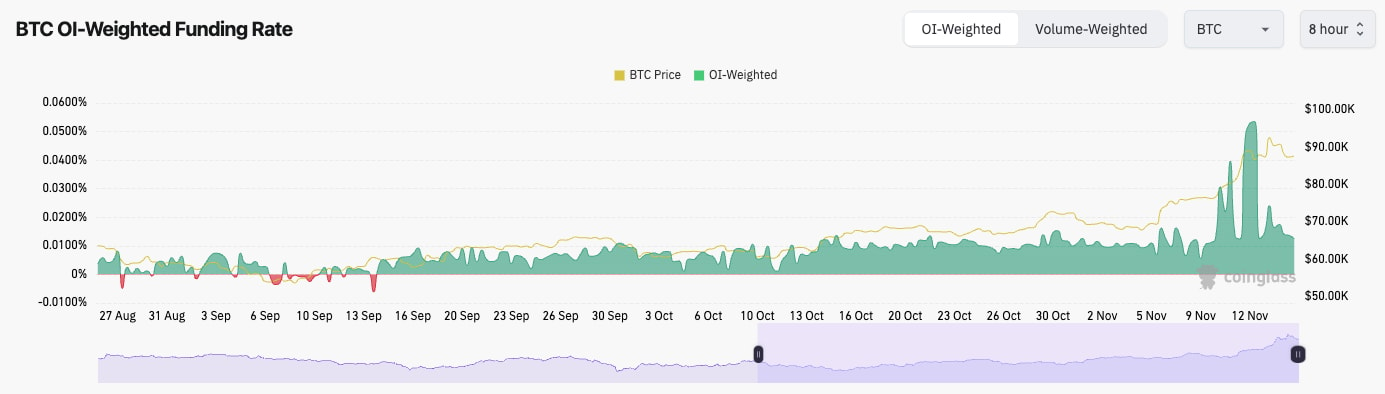
Technical analysis
- For the TA, we will look to the 12-hour timeframe just to get more information, as the move-up has essentially been a straight move-up. Zooming in slightly helps us to identify levels.
- On the 12hr, BTC has formed a bearish divergence (a new high in price whilst putting in a lower high on the oscillator). This bearish divergence has also been printed in overbought territory in both the 12-hour and the daily timeframes.
- Local support is at $87,000, whilst the deeper level for a pullback might be around $82k. However, it's very hard to identify a clear, deeper level.
- To the upside, the all-time high of $93,300 is the level for the price to clear above.
- BTC is potentially forming a bullish pennant despite the bearish divergence. If this pattern played out, we'd likely see BTC break to the upside.
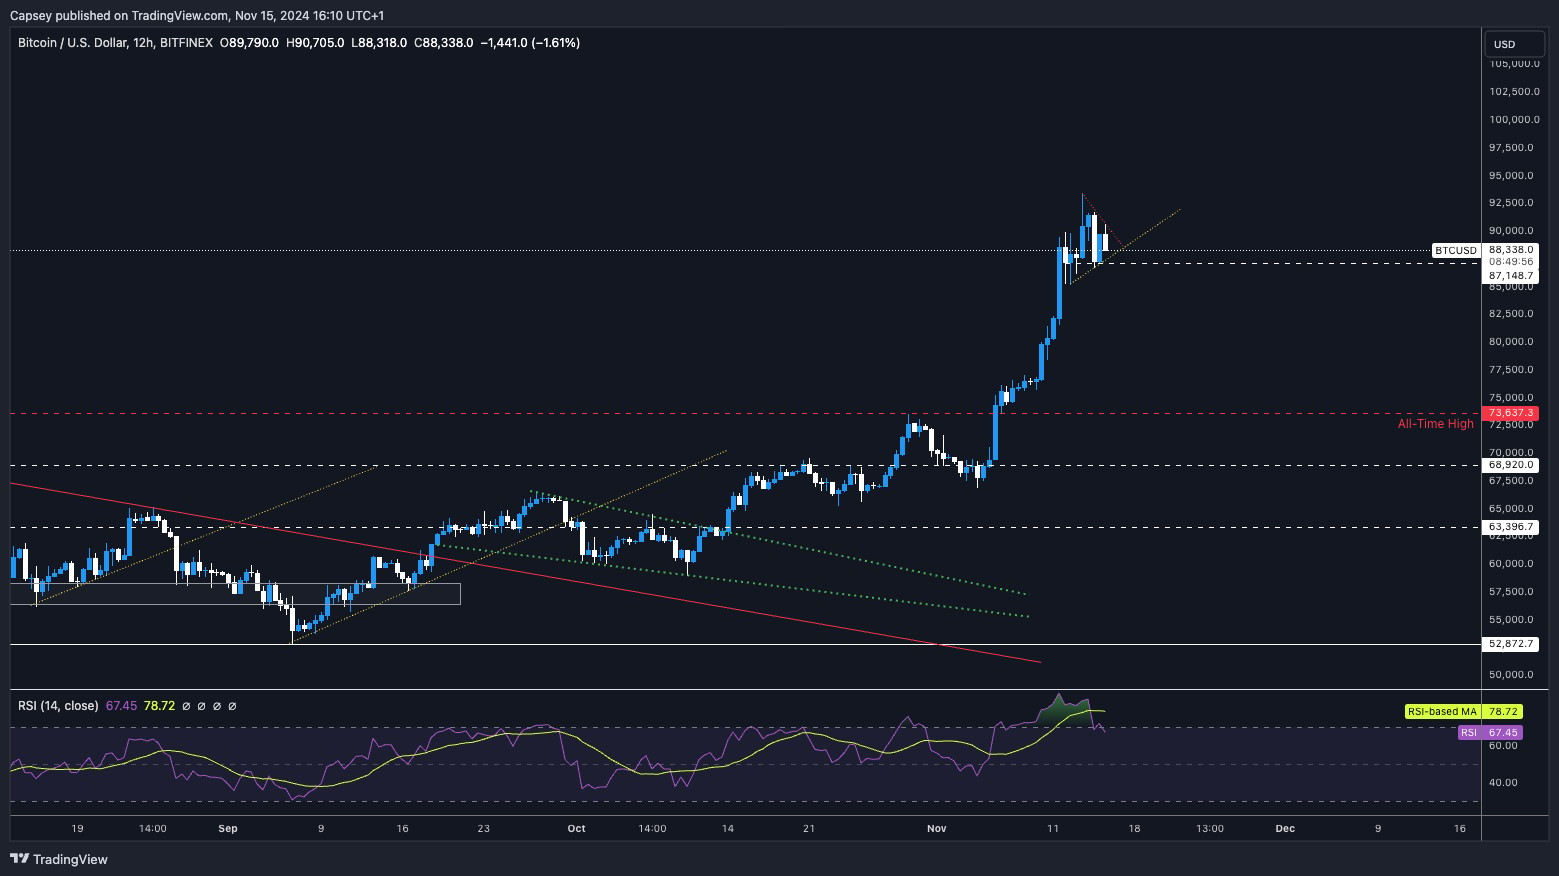
- Next Support: $87,000
- Next Resistance: $93,300
- Direction: Neutral/Bullish
- Upside Target: $93,300 (then $100k)
- Downside Target: $87,000
Cryptonary's take
There are two key contrasts here currently: the bullish pennant and the bearish divergence. Both have opposite results. Market momentum suggests more upside, but the extremity of the move suggests a small pullback. It's very difficult to know which will play out here, and unfortunately, we can't see one outcome favouring the other here. Sorry guys.Personally, I (Tom) think a pullback to $82k - $85k, somewhere in there, would be positive for us in the medium term. This would reset some of the indicators and also prolong retail piling back into the space.
A grind higher is better for higher prices than a quick cycle blow-off top. Even though a pullback might be possible, it would be extremely risky to sell Spot positions here. We're certainly not doing that. We're holding and seeing what the next days/weeks give us. We're expecting much more upside in the coming weeks, even if we have a week of consolidation.
Euphoria phase sets BTC in motion
12 November 2024- Bitcoin's Open Interest is at a new cycle high (in terms of measuring by the number of coins), and it's at an all-time high in USD terms.
- The Funding Rate is also very high and now at alarming levels, at 0.07%. This is 75% annualised. So, traders are paying 75% per year to Shorts to hold their current Longs. Excessive.
- This setup likely needs and often results in a flush-out. We expect that this will also be needed here.
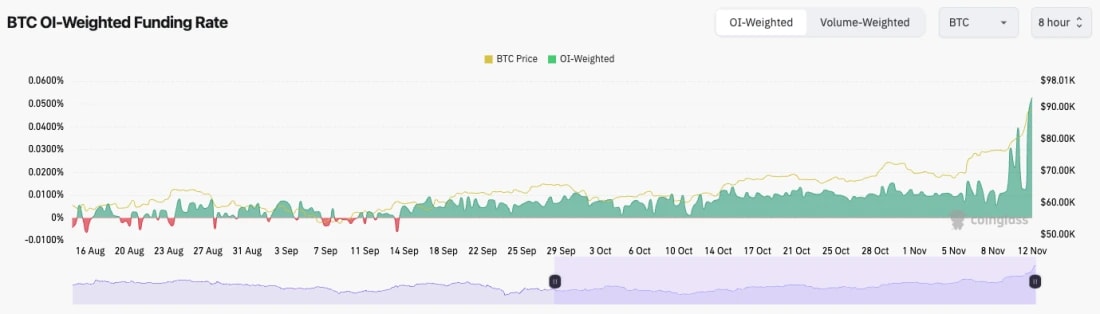
Technical analysis
- Overall, this chart is great, and we've seen a high timeframe breakout, which has seen BTC visit close to $90k. Mega.
- The move has been basically straight up, and even though it was, for the most part, driven by Spot buying, straight-up moves can have, and need pull backs.
- The last major resistance that was broken to the upside was at $73,600. It's now more tricky to find a new potential area of support.
- Looking at the lower timeframes, there is local support here at $85,500. But Funding is still high, and OI hasn't been flushed yet, so there's probably more downside to come to generate that flush out.
- Therefore, the possible support we're looking at is between $81k and $82k.
- To the upside, the all-time high is the next resistance.
- The RSI is also extremely overbought at 75. This suggests some downside, or at least a period of consolidation is needed for this indicator to reset.
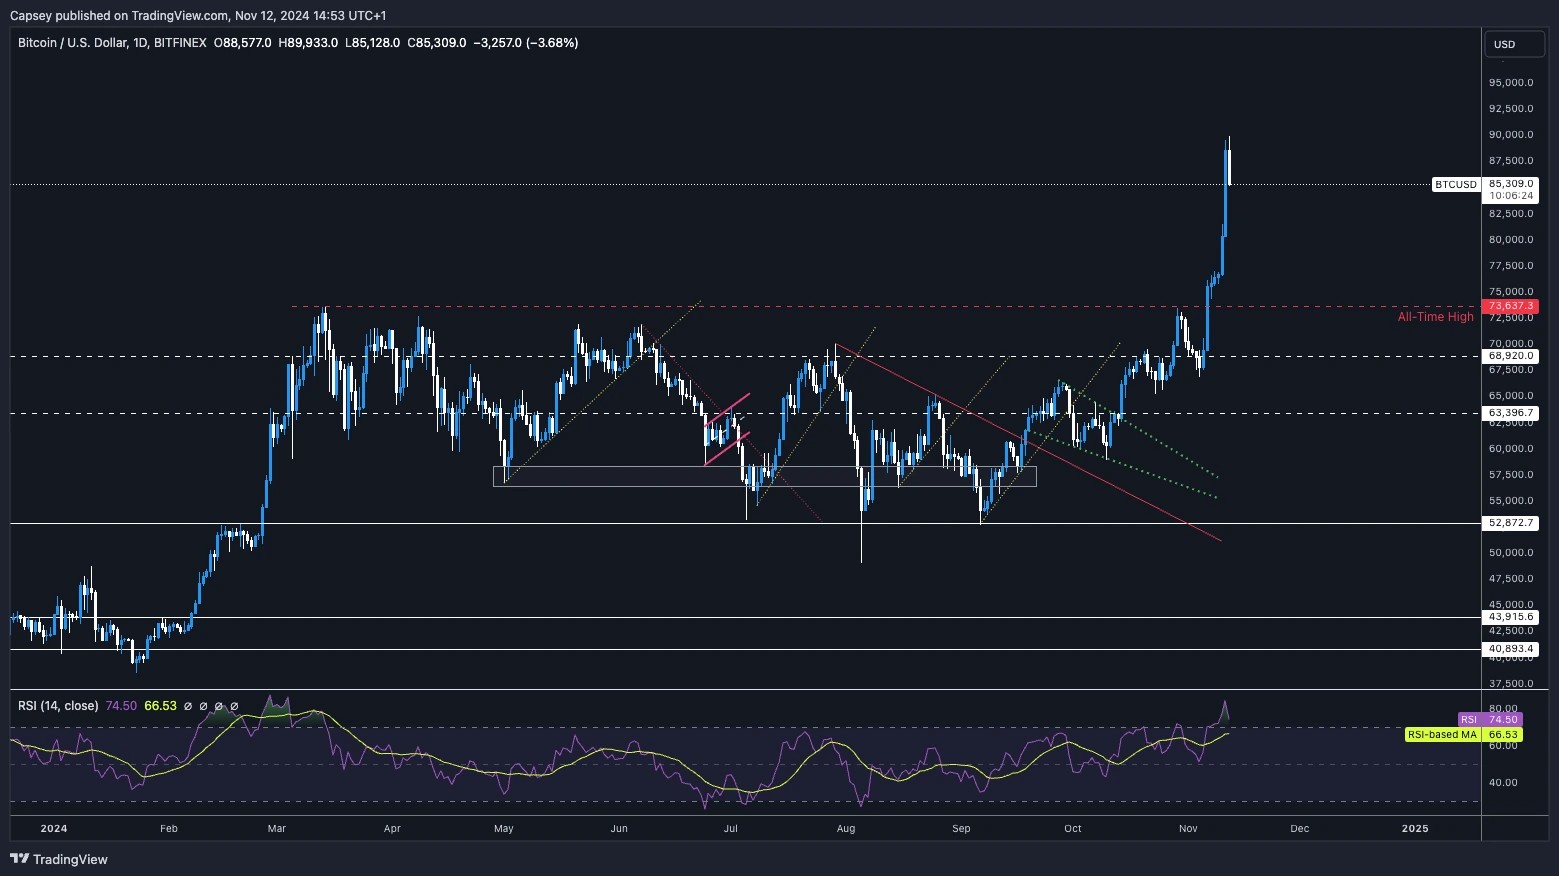
- Next Support: $81,000 - $82,000
- Next Resistance: $89,000
- Direction: Neutral/Bullish
- Upside Target: $89,000 (and then $100,000)
- Downside Target: $82,000
Cryptonary's take
We now fully expect that we're in the "euphoria" phase of the cycle, so we're expecting at least a number of months of strong upside price action. However, in the immediate term, BTC looks overbought here, while the leverage is high and overpositioned. It's likely we'll se a flush out of that leverage, and the price will likely pull back because of that.But major dips are for buying. So far, we've seen BTC and DOGE begin their breakouts. In the coming weeks, the rest is likely to follow.
Keep leverage light, preferably none at all. Dips are for buying, and the clue as to when to buy is when Funding Rates reset.
Bitcoin eyes $100K by Christmas
7 November 2024As markets react to political shifts, Bitcoin ($BTC) hits new highs, while ETH and SOL face crucial levels. Let’s explore the latest price action and market trends.
- Upon Trump's victory, Open Interest (in terms of the number of BTC) shot up to new cycle highs, whilst OI in USD terms hit a new all-time high.
- Funding Rates on the major exchanges are positive at 0.01%, but on less liquid exchanges, Funding has moved more significantly positively, indicating traders are paying a higher premium than usual to be Long.
- In the short-term, this isn't over-extended, but if the trend upwards continues, it might be soon.
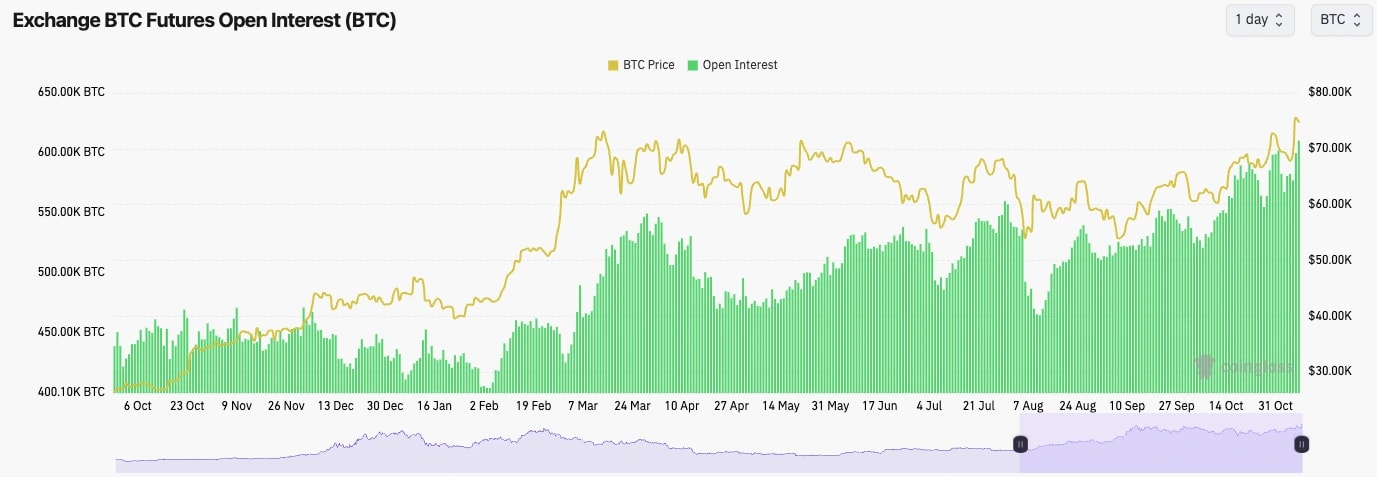
Technical analysis
- Bitcoin broke out to new all-time highs upon the Trump victory.
- The key level for the price to clear above was $73,600, which the price has now convincingly closed above.
- It's possible now that $73,600 becomes new local horizontal support and price may pull back and retest this level before breaking up higher again.
- The RSI is just shy of overbought territory, however we have seen in prior times when price breaks above all-time highs, price can still rally aggressively despite the RSI being overbought. For now, this isn't much of a concern.
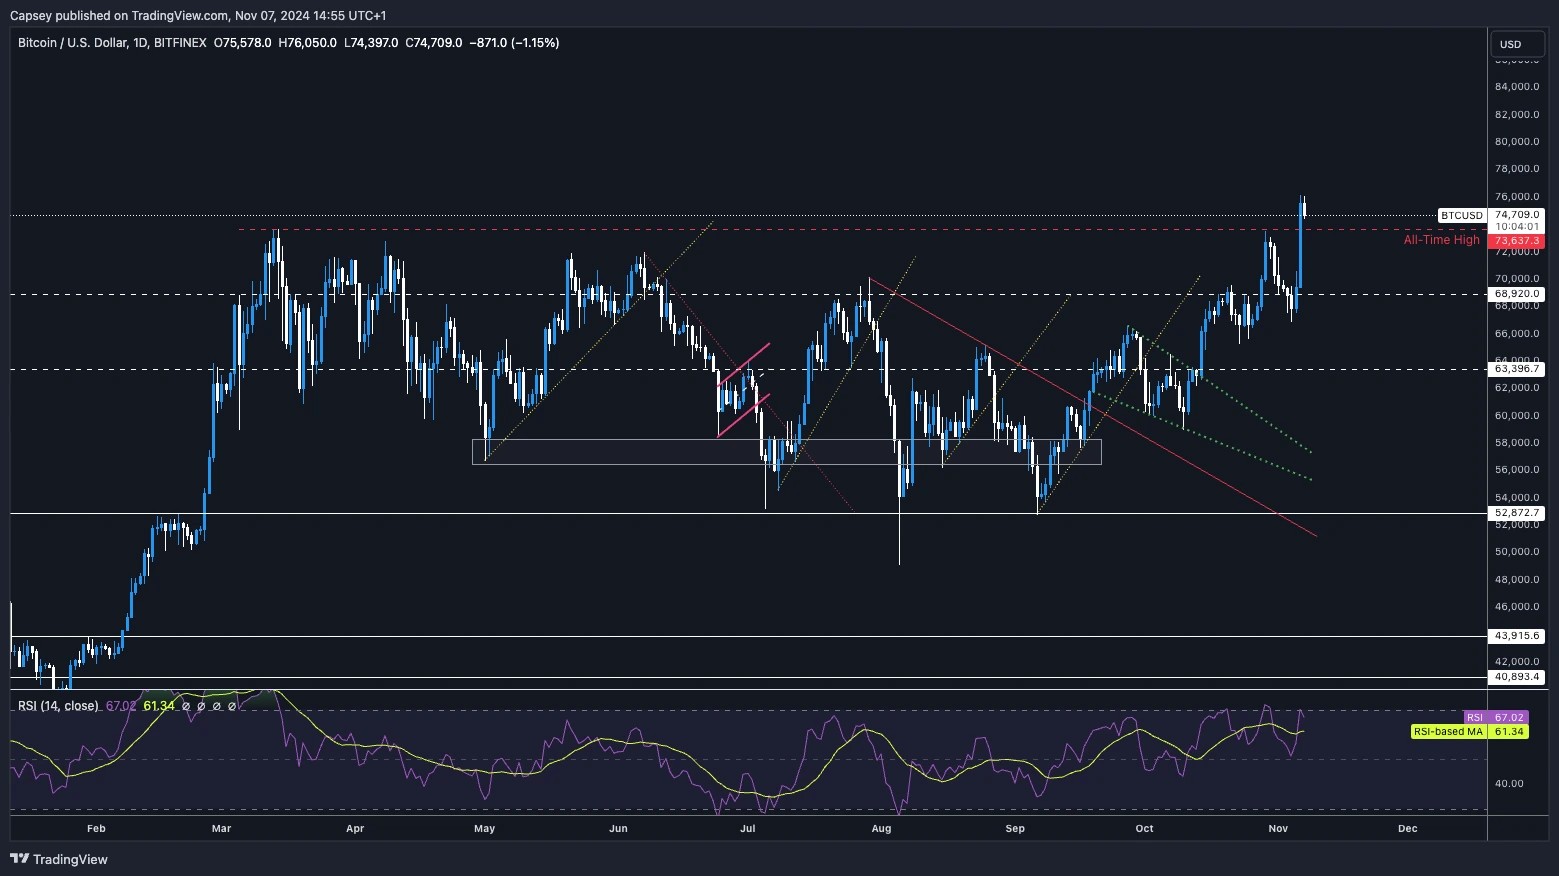
- Next Support: $73,600
- Next Resistance: $76,000
- Direction: Neutral/Bullish
- Upside Target: $80,000
- Downside Target: $73,600
Cryptonary's take
With the breakout to new price all-time highs, we believe the 7 month or so consolidation period is now over and that we're now in the very beginning stages of the "euphoria" part of the cycle. We're expecting BTC to be priced between $85k (extremely conservative target) and $100k (realistic target) by Christmas.From here, let the market do the hard work for you. Unless you're a competent trader, the best bet here is to let the market run, and take your bags higher for you. There's no need to get in the way here, let the market do that hard work for you.
In the coming days, it's possible BTC pulls back to $73k, tests the prior all-time high as new local support before shooting on higher again from there.
Election outcome to drive BTC's next move
04 November 2024- BTC's Open Interest remains high, although it has pulled back slightly in the last few days as Trump's odds have come in and "Trump trade" assets have pulled back.
- BTC's Funding Rate remains positive, around the upper end, but still a healthy area of 0.01%.
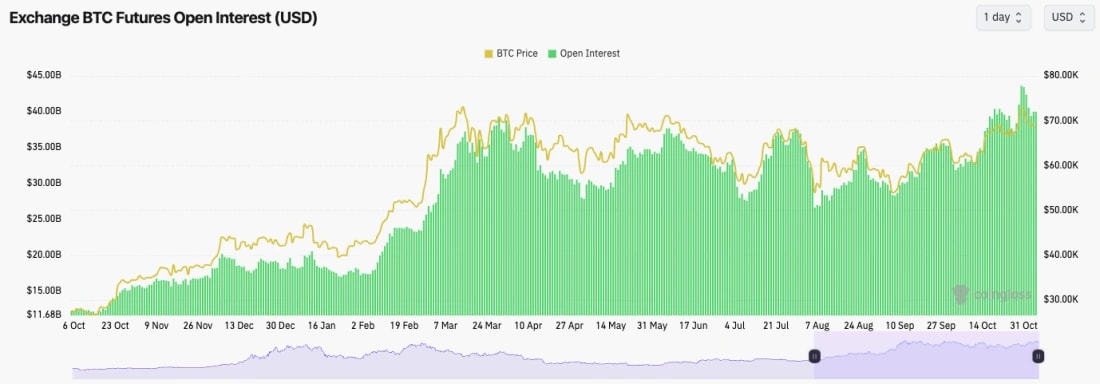
Technical analysis
- BTC was rejected from the all-time highs at $73,600 and has since pulled back to the prior horizontal resistance at $68,900.
- To the upside, $73,600 (all-time high) is now the major resistance and a clean break out above likely ignites the "euphoria" stage of the bull run.
- On the downside, the current level of $68,000 to $68,900 should act as support going into the election.
- Beneath $68,000, $66,000, and then $63,400 are the key horizontal levels.
- Since poking into the all-time highs, the RSI has pulled back from overbought levels, and it's now in a more middle and neutral territory at 54.

- Next Support: $68,000
- Next Resistance: $73,500
- Direction: Neutral
- Upside Target: $73,500
- Downside Target: $66,000
Cryptonary's take
It seems the obvious explanation for this pullback is that price moved into all-time highs on strong odds of a Trump win. However, as those odds have come in slightly, there has been profit-taking on "Trump trade" assets which has then led to a pullback. It was also unlikely that risk appetite was going to increase substantially pre-election.Most smart money waits for an outcome, regardless of what the outcome is, to put capital into work. If Trump wins, it's very likely we'll see BTC trade north of $75k by the end of this week. If Harris wins, it's possible that BTC will sell off and potentially trade between $60k and $63k. However, we would see this as a buying opportunity. We're bullish mid and long-term, regardless of who the winner is.
Eyeing $73,600 if $68,900 breaks!
28 October 2024Bitcoin (BTC) is eyeing a potential breakout after bouncing off the $66,000 support level, retesting its $68,900 resistance. With funding rates stable, could BTC head toward its all-time high of $73,600? Here’s today’s analysis and forecast.
Disclaimer: This is not financial or investment advice. You are responsible for any capital-related decisions you make, and only you are accountable for the results.
- On the move down to $66k last Friday, nearly 10% of Open Interest by coins was wiped out. This is a small, but a nice flush out on that move. However, we have seen OI move back up to it's highs over the last 24 hours.
- However, Funding Rates remain contained in positive territory, hanging around the 0.01% level, which is a very normal level and doesn't indicate over heating.
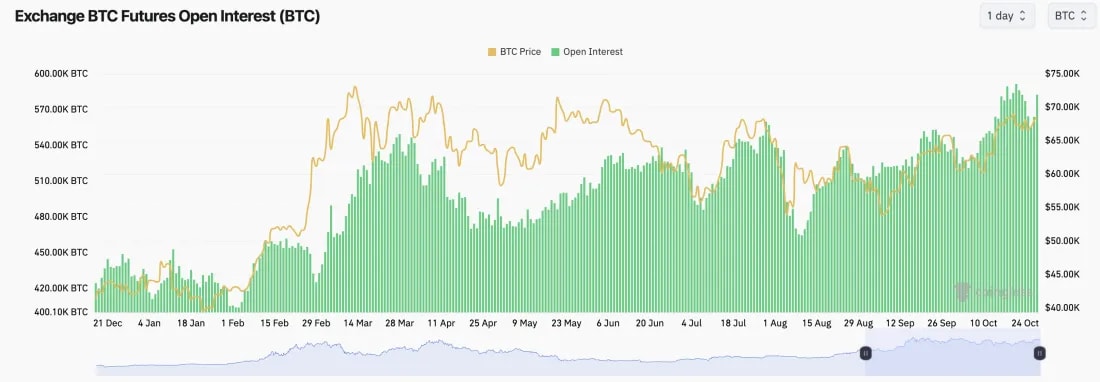
Technical analysis
- BTC initially rejected the overhead horizontal resistance at $68,900 and pulled back to our first marked area between $65,000 and $66,000.
- Price has since bounced really convincingly and is now retesting the underside of the horizontal resistance at $68,900 again, but this second time, the RSI isn't in overbought territory.
- To the downside, we'd expect the $65,000 to $66,000 area to continue to act as major support.
- To the upside, $68,900 is the main level for the price to break out above. Beyond that, it's the all-time high at $73,600.
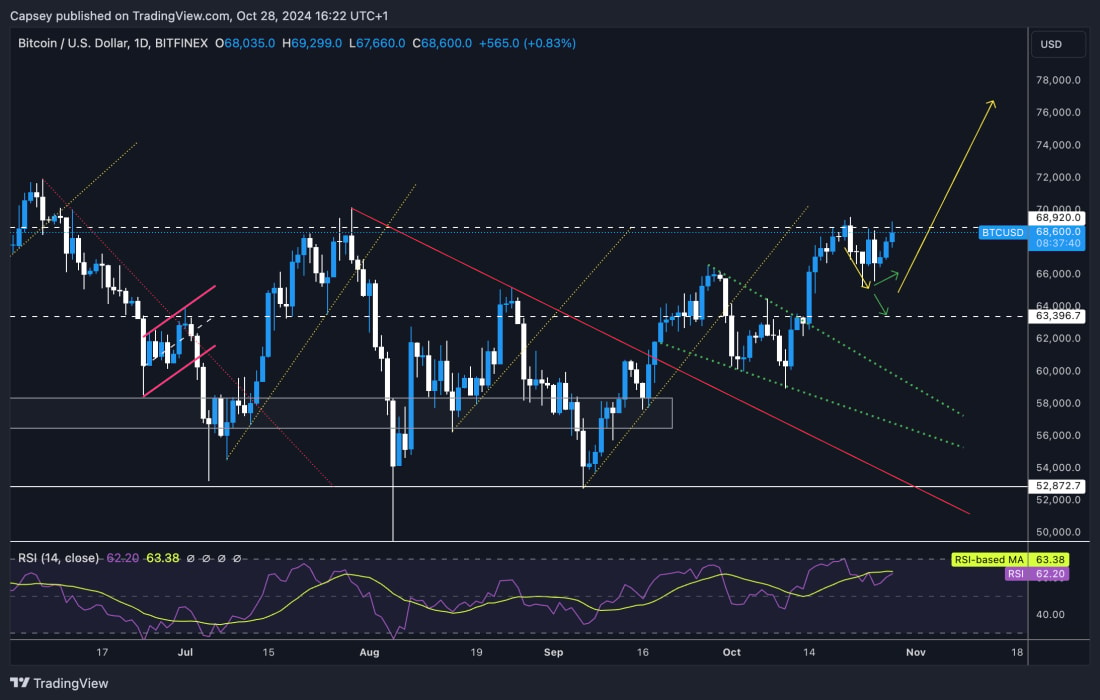
- Next Support: $66,000
- Next Resistance: $68,900
- Direction: Bullish
- Upside Target: $73,600
- Downside Target: $66,000
Cryptonary's take
BTC looks really positive here. You'd want to see price pullbacks bounce off the main areas of support, which is what we've got, and now the price is butting into the main horizontal resistance. It seems that risk appetite is becoming more comfortable for some people as it looks more likely that Trump might win the US presidential election.We wouldn't be surprised if BTC doesn't break above-price all-time highs pre-election. But we do think BTC can break above $68,900 between now and the election and be butting into all-time highs at and around election day.
Is BTC pulling back to $66,000?
22 October 2024Bitcoin’s price action indicates a possible retest of $66,000 support as it pulls back from $68,900 resistance. Discover what BTC might do next.
Disclaimer: This is not financial or investment advice. You are responsible for any capital-related decisions you make, and only you are accountable for the results.
- BTC's Funding Rate is at 0.01%, indicating that there is a small bias amongst traders to be Long.
- Open Interest is at Daily highs, so this is something to be mindful of as we move forward.
- Overall, from a mechanics perspective, the market looks relatively ok here.
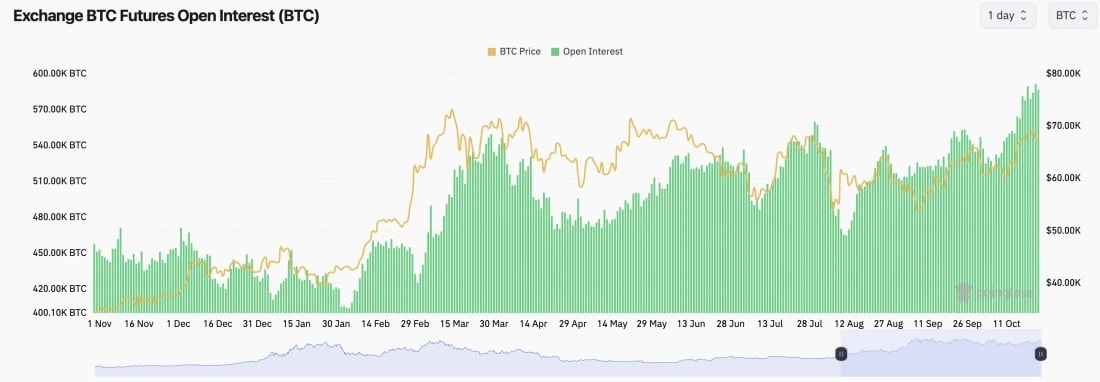
Technical analysis
- Late Sunday evening (never fully trust a late Sunday night pamp into the Weekly candle close), the price pushed beyond our $68,900 horizontal resistance but ultimately rejected from that level.
- The price has now pulled back very slightly, but the positive is that the RSI has pulled back from being overbought, is now at the 60 level, and is resting on top of the RSI Moving Average.
- To the upside, $68,900 remains the key level for the price to comfortably close above.
- To the downside, there is local support at $66,000 and more major horizontal support at $63,400.
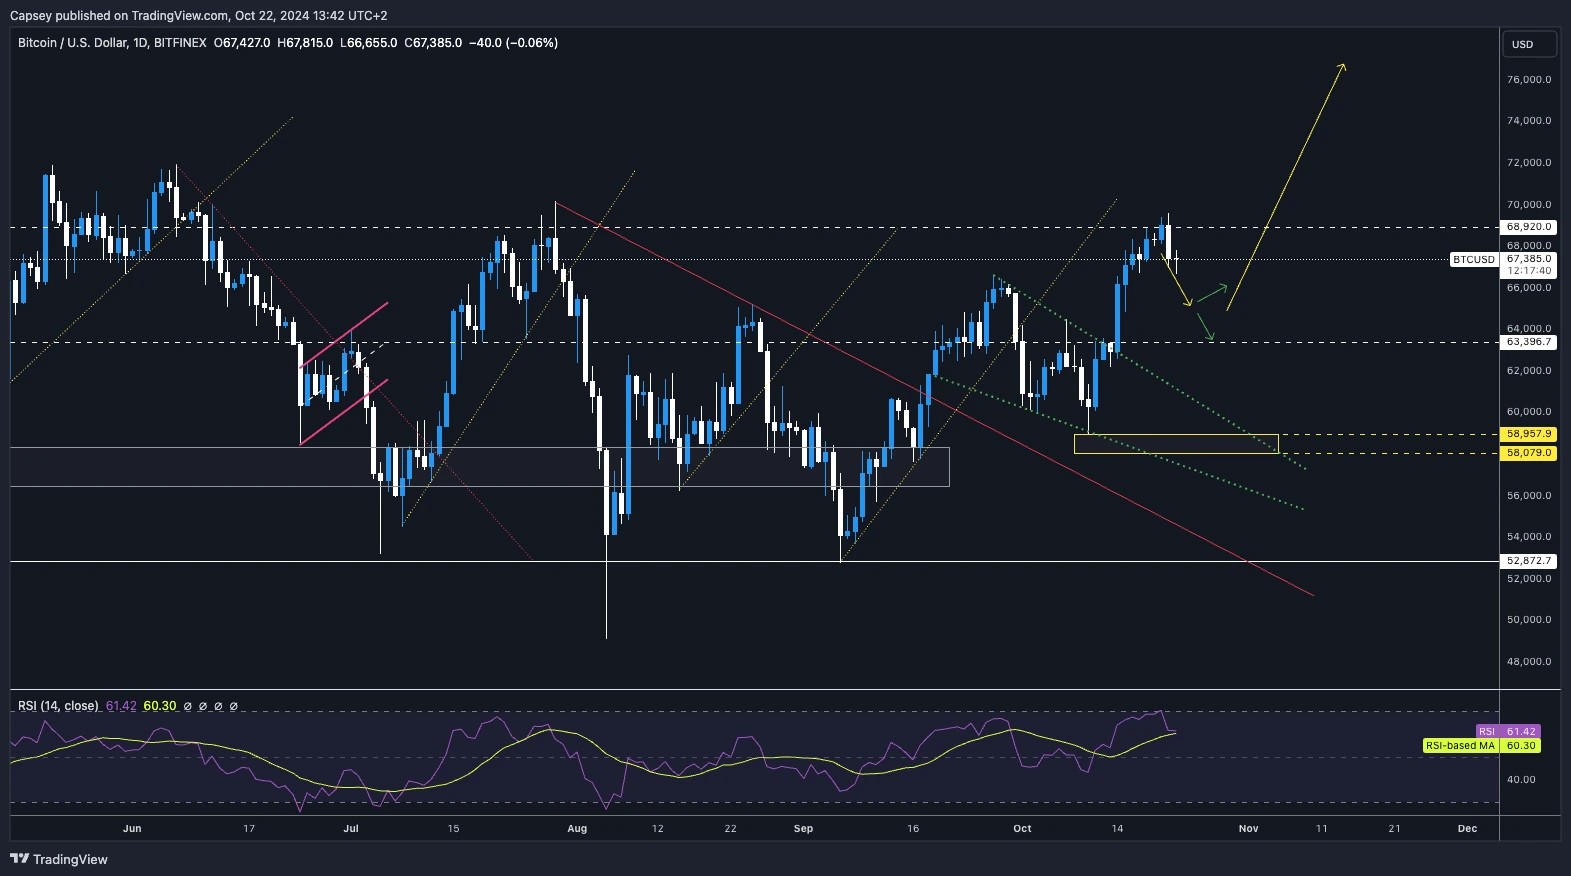
- Next Support: $66,000
- Next Resistance: $68,900
- Direction: Bearish/Neutral
- Upside Target: $68,900
- Downside Target: $66,000
Cryptonary's take
BTC has moved higher than we thought it might do a week or two ago, as we expected the market to be relatively contained/subdued the closer we move to the US elections.However, the price has performed well, and Trump's odds of winning have improved in the betting market. Now, with approximately two weeks until the election, it's possible that price does pull back a tad here, potentially retesting $66,000.
If there are any major pullbacks between now and the election, we would solely see them as buying opportunities.
For now, we remain in BTC Spot positions, of course, and we'd be buying anything between $63,400 and $66,000 (pre-election).
BTC dominance nears 60%: Will altcoins surge soon?
18 October 2024BTC dominance nears 60%, setting up a potential altcoin rally. Will Bitcoin maintain control, or are altcoins ready for their moment in the spotlight?
Disclaimer: This is not financial or investment advice. You are responsible for any capital-related decisions you make, and only you are accountable for the results.
Bitcoin's dominance is hitting the ceiling. BTC dominance has been slowly grinding upwards and recently hit 58.8%, just below the critical 60% level. This dominance spike has been a steady climb, but we're nearing the point where the trend could reverse, unleashing the altcoin market.
- Resistance: The 60% level is a major resistance for BTC dominance. The rising wedge formation that's been in place for over two years is approaching its peak.
- Potential scenario: A push towards 60% is likely, but once dominance hits this ceiling, we expect a breakdown. This will be the signal for money to flow out of Bitcoin and into altcoins, sparking an altcoin rally.
- Market dynamics: Bitcoin is soaking up capital for now, but this could be its final push before the market rotates back to altcoins. The longer BTC dominance hovers near this level, the stronger the eventual breakdown will be.
Conclusion
BTC dominance is peaking, and once it hits 60%, we expect a significant shift in market dynamics. This could be the trigger for alt season, with altcoins finally getting their moment in the spotlight.
BTC at $66k: What’s next?
18 October 2024Bitcoin’s price action approaches a crucial point. Will BTC break $68,900 or retest support at $63,400? Dive into today’s BTC market analysis.
Disclaimer: This is not financial or investment advice. You are responsible for any capital-related decisions you make, and only you are accountable for the results.
- Whilst funding rates remain positive and open interest has increased from the local lows, the Spot CVD is showing net selling due to this price increase. This Spot selling isn't in large volumes, but it's been downtrending since BTC moved up to $66k.
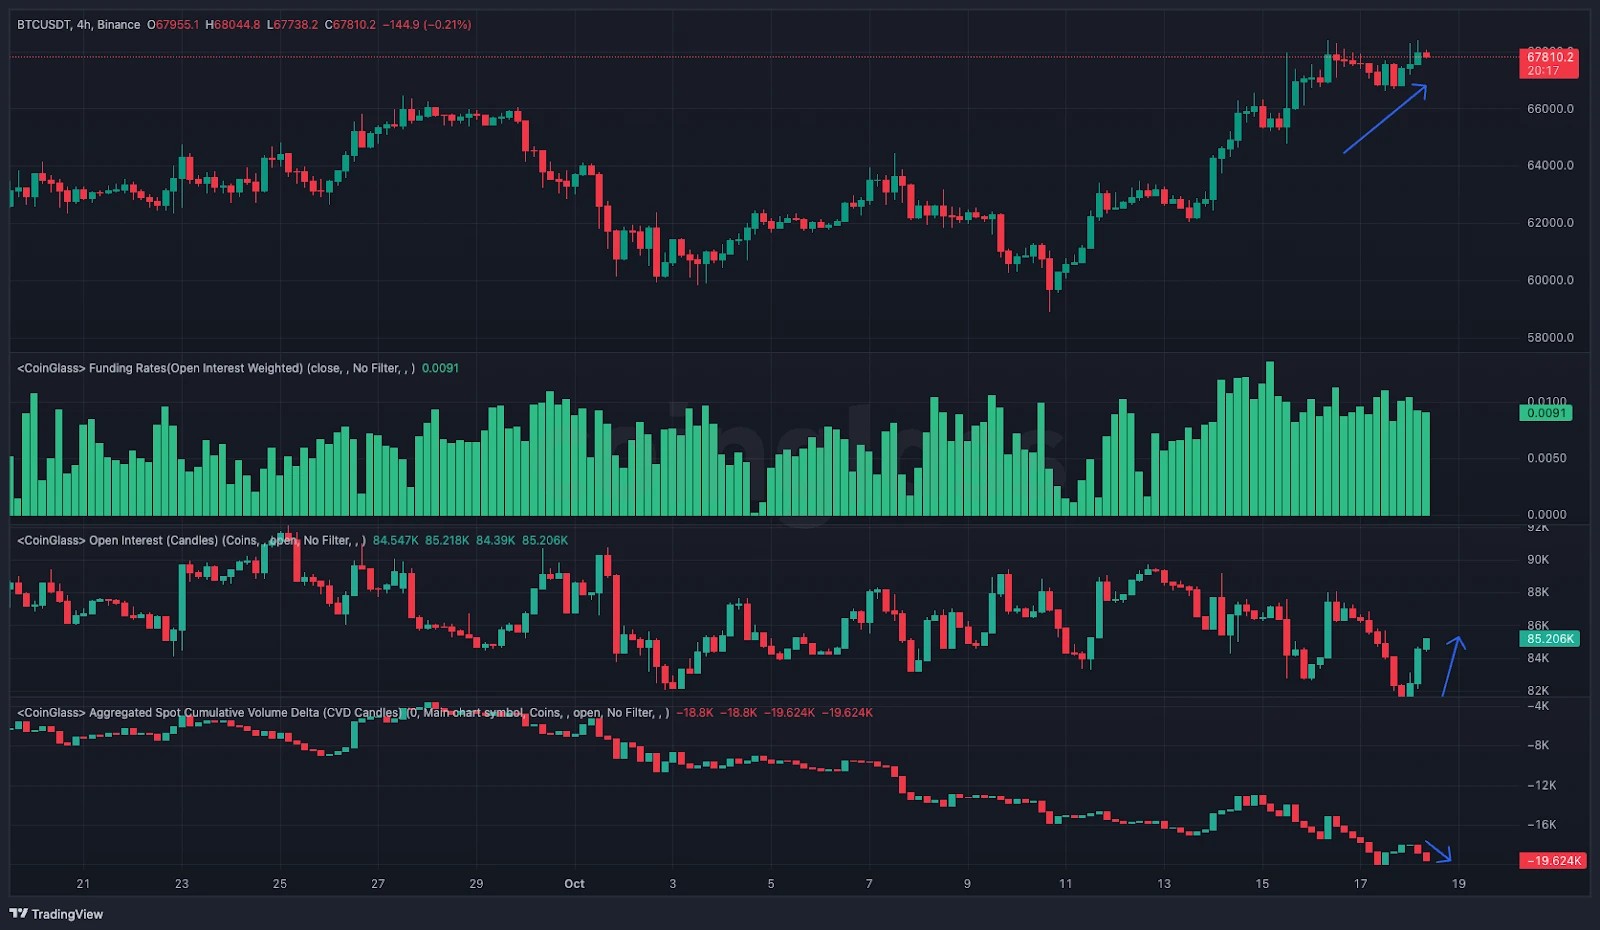
Technical analysis
- Price has broken out from the local resistance of the top border of the descending wedge and the local horizontal resistance of $63,400.
- Price is now at the upper end of the 7-8 month price range, and prodding into the $68,000 to $68,900 horizontal resistance zone.
- Beyond $69k, the price is essentially breaking out, and things can get exciting.
- To the downside, $63,400 should act as new major support, with $66,000 a local level of support.
- The RSI is at 67, which on the Daily timeframe is very close to being overbought. The oscillator hasn't been this overbought since mid-July.
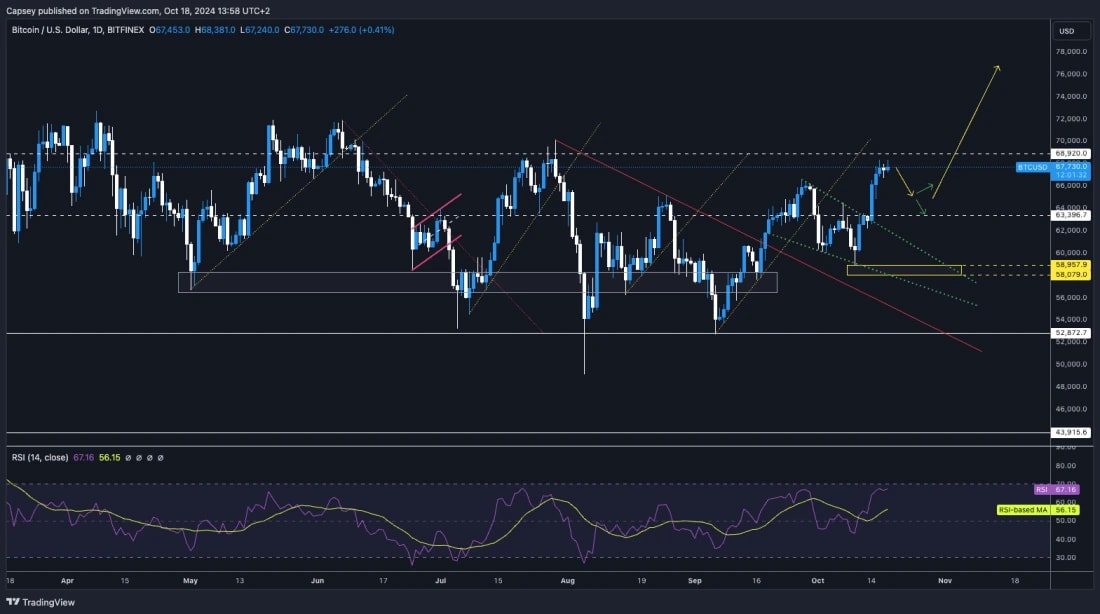
- Next Support: $63,400
- Next Resistance: $68,900
- Direction: Bearish/Neutral
- Upside Target: $68,900
- Downside Target: $63,400
Cryptonary's take
Price action has been really strong, particularly considering we're now just a few weeks out from what investors consider a very uncertain event - the US Elections.However, with Trump's odds improving in the betting markets following Harris' car crash Fox News interview, risk assets and Crypto have begun pricing in a Trump win.
In the short term, it's possible that BTC will correct this, possibly targeting $66,000 or, worse, $63,400. We're now at the upper resistance in the larger range, and the oscillator is now close to being overbought.
BTC still feels like a coiled spring, ready to pop and go higher. However, we're sceptical that this happens pre-Election. However, beyond that, we think a Trump win could be that catalyst that gets us well beyond new all-time highs.
Will BTC test $66k next?
14 October 2024Bitcoin approaches $65k-$66k resistance while $63,400 offers support. Will BTC break higher or pull back? Let’s dive into today’s price prediction.
Disclaimer: This is not financial or investment advice. You are responsible for any capital-related decisions you make, and only you are accountable for the results.
- Price has been pushed up by Spot buying, whilst Open Interest has decreased and Funding Rates are up (so Shorts closing out).
- From a mechanics viewpoint, this is what you want to be seeing.
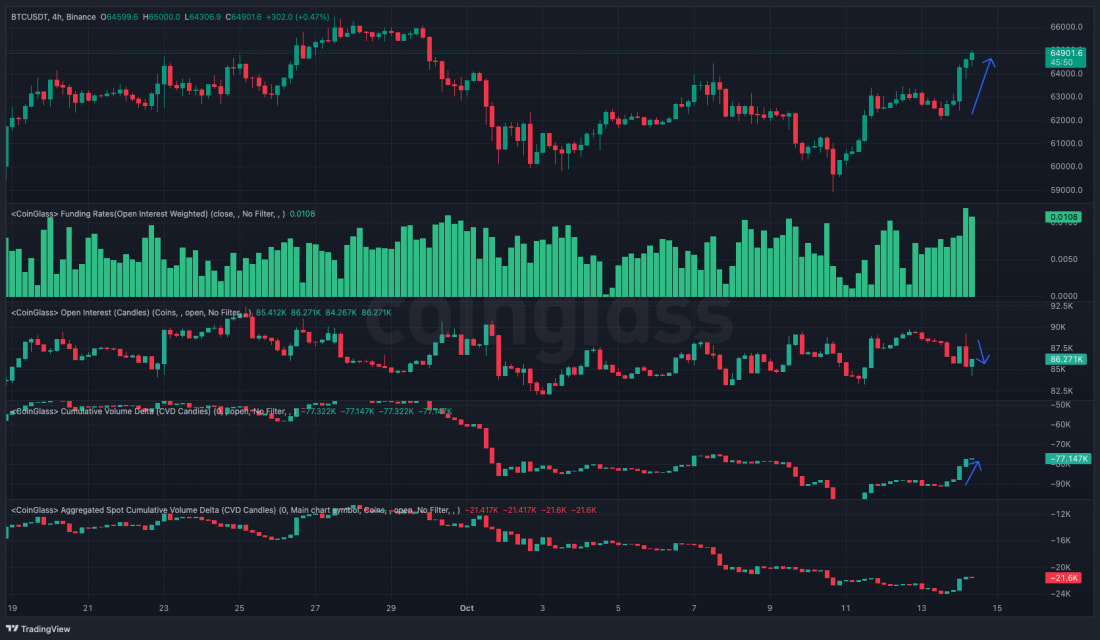
Technical analysis
- We initially thought BTC might reject at the $63,400 level and pull back further. But the price has broken to the upside, which is great to see.
- Price has also broken out above the descending wedge, which we expected, but we thought we might see that price pull back first.
- The $65k to $66k has previously acted as a resistance zone for price, so this is a key level for Bitcoin to overcome here.
- To the downside, we'd expect the $63,400 level to act as a new local support for price.
- The RSI has broken above the Moving Average and is now heading higher, but not yet close to being overbought.
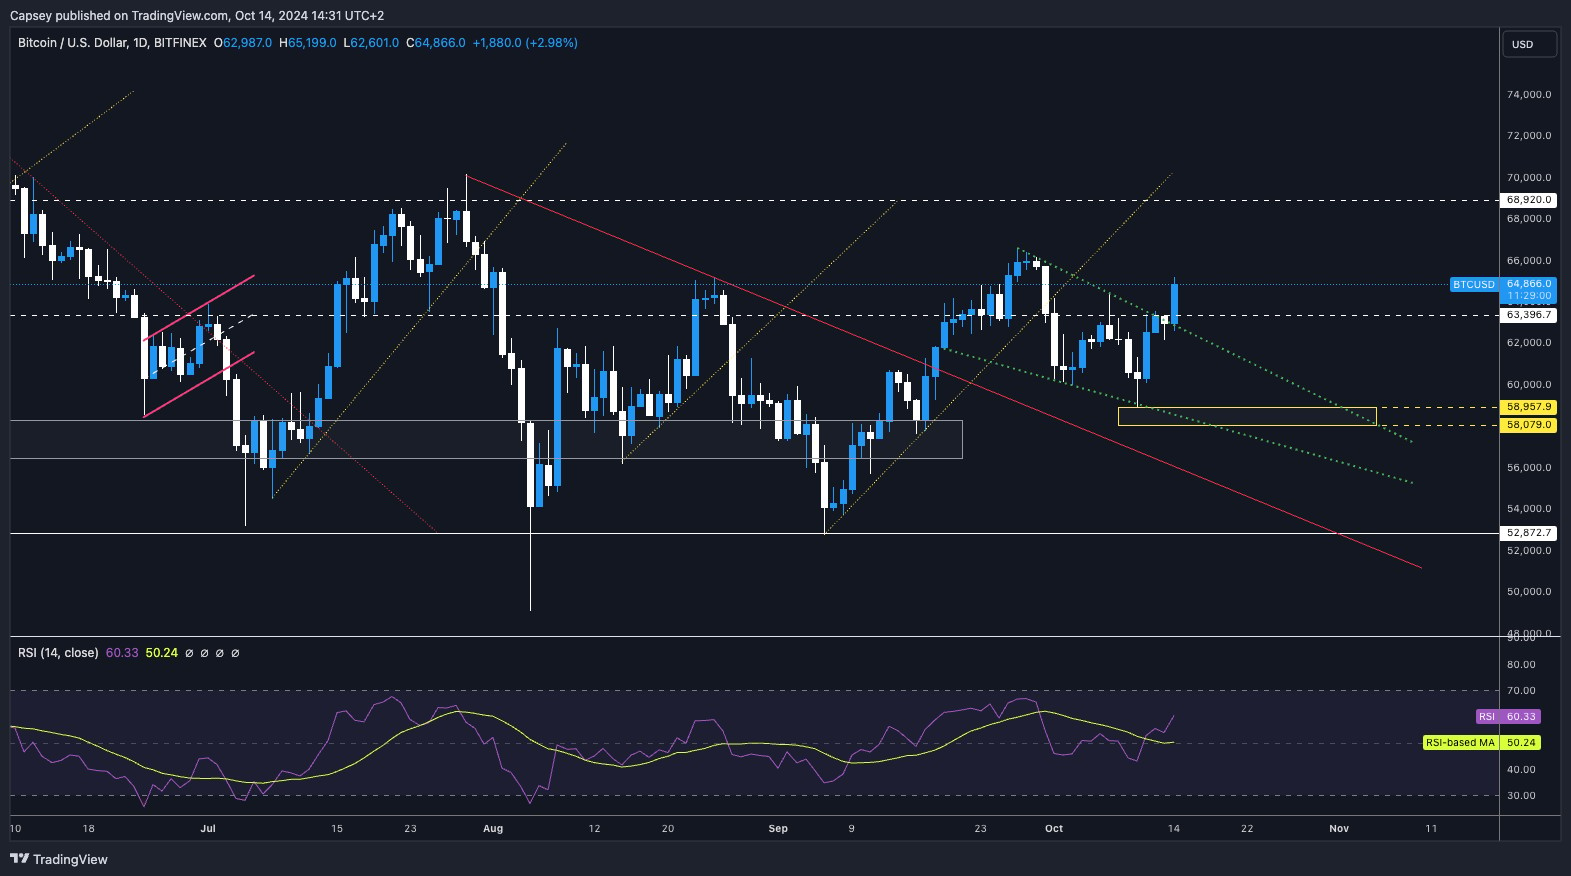
- Next Support: $63,400
- Next Resistance: $66,000
- Direction: Neutral
- Upside Target: $66,000
- Downside Target: $63,400
Cryptonary's take
A really positive move here from Bitcoin, which is perhaps playing some catchup (to MicroStrategy, which has been ripping higher). Now it's possible that full risk-on attitude isn't ready to come back in, just weeks before what looks like a close US Presidential Election. However, chart-wise, BTC looks good, so we're positioned well.In the short term, it's possible that BTC struggles here as we're at a horizontal resistance ($65k to $66k). Therefore, it's possible we will see a slight pullback to potentially $63,400 before we can test higher from there. Very hard to call in the immediate short-term here. A break above $66k would be seen as a huge sign of strength, and we would be at full risk of this.
BTC range-bound between $58,000 and $63,400 support
11 October 2024Bitcoin (BTC) is trading between key support at $58,000 and resistance at $63,400. With market uncertainty and funding rates fluctuating, will BTC break higher or remain range-bound? Let’s explore today’s price prediction and potential moves.
- BTC's Funding Rate has flip-flopped between slightly negative and slightly positive over the past few days, as traders have been shaken out of positions and are unsure of price direction in the near term.
- Overall, Open Interest remains high, indicating that there is still a lot of leverage.
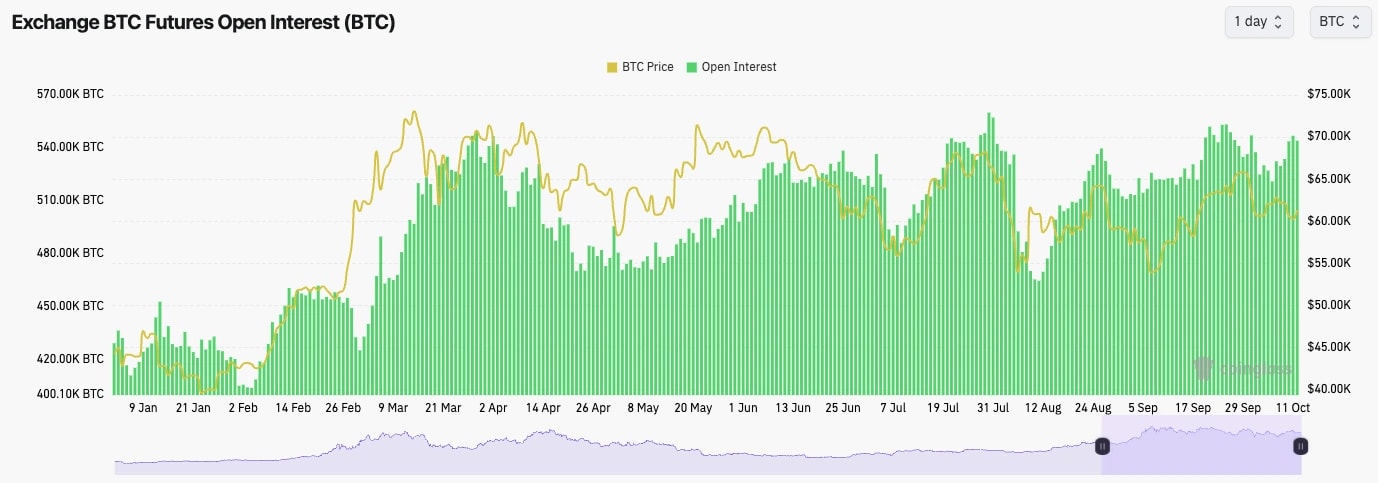
Technical analysis
- Following the bounce from the $60k area, BTC rejected into the horizontal resistance of $63,400.
- BTC then bounced off the top of the Yellow support box between $58,000 and $58,900. We expect this area to continue to hold as the main support.
- BTC is also in a descending wedge on the local timeframe, which is a bullish pattern.
- The RSI has reset and is in the middle territory, with no divergences in play at the current time.
- To the upside, the $63,400 remains the main horizontal resistance over the shorter timeframes.
- To the downside, we'd expect the $58,000 to $58,900 area (Yellow Box) to hold as support if the price were to retest this area again.
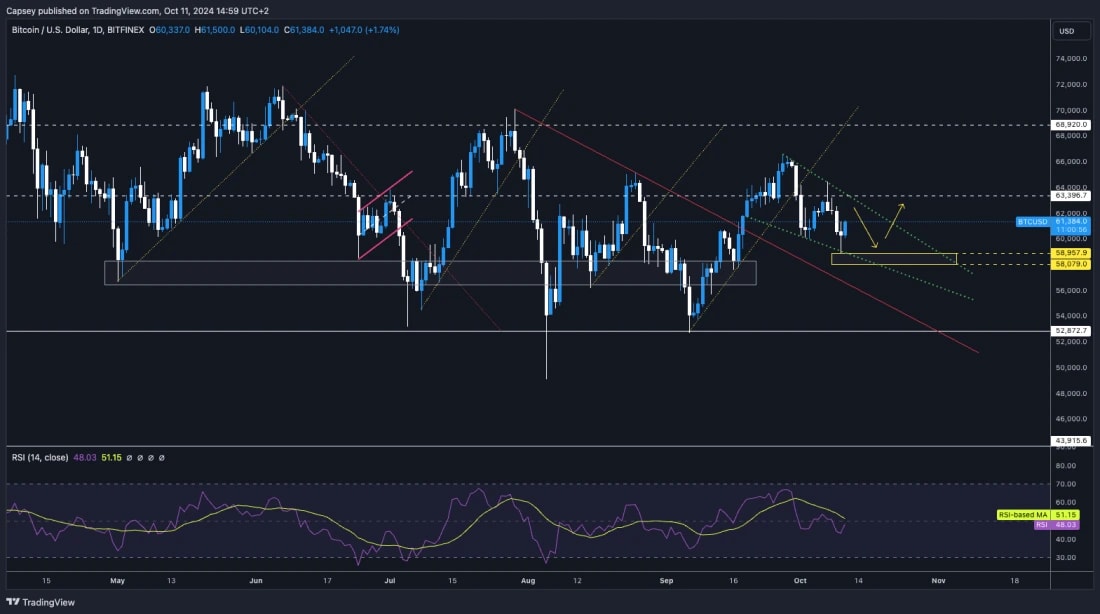
- Next Support: $58,000
- Next Resistance: $63,400
- Direction: Neutral
- Upside Target: $63,400
- Downside Target: $58,000
Cryptonary's take
With not much data out over the coming weeks, and with the US election just 4 weeks away, risk appetite in markets may be more subdued. For this reason, we expect there won't be any major breakouts until after the election.In the short term, we expect Bitcoin to trade between $58,000 and $63,400, and our expectation is for the price to break to the upside when a breakout does eventually occur. Over the coming days and fortnight, we expect the price to follow a path similar to the Yellow arrows. Range-bound action for now, but it is possible we will see a light upside over this weekend.
Jobs data and Fed’s role in BTC’s next breakout
8 October 2024After last week's jobs data blew past expectations, we've seen BTC, SOL, and meme coins like POPCAT make significant moves. The labour market's strength has reshaped interest rate forecasts, giving crypto assets a fresh push higher.
The market is bracing for more shifts with the FED speeches and inflation data looming. Let's dig into how these events are impacting key assets like Bitcoin and altcoins.
In this report:
- Last Week's Jobs Data & This Week's Data.
- Cryptonary's Take & $BTC.
Last week's jobs data
As inflation has fallen back to a more sufferable level over the last 12 months, the market has shifted focus to a potentially weakening jobs market. However, last Friday, we saw the opposite of a weak jobs print.Non-farm payrolls came in at 254k (big jobs growth), whilst the Unemployment Rate came in at 4.1%, ending what was a multi-month uptrend in the Unemployment Rate.
US unemployment rate:
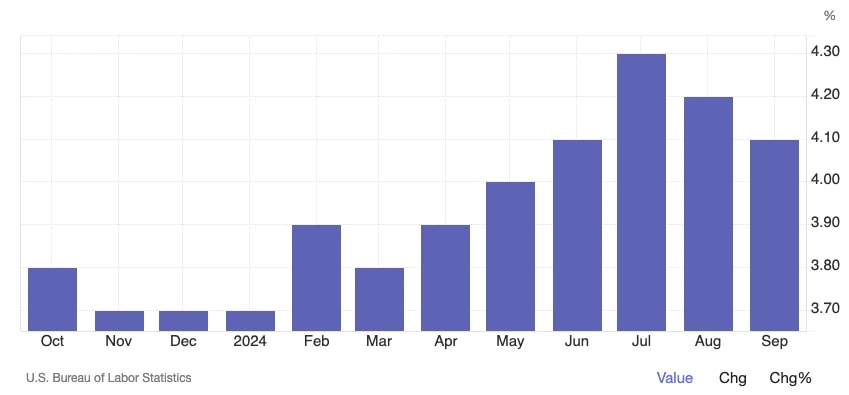
A far stronger than expected jobs print saw the market price out some of the future Interest Rate cuts that had been previously priced in. This is because a stronger than expected labour market, matched with positive GDP growth, means that less FED easing is needed.
The result of this was that Bonds sold off (Yields up), but risk assets were bid (due to the 'goldilocks' narrative) - hence Crypto and Meme's went up.
US 10Y bond yield:
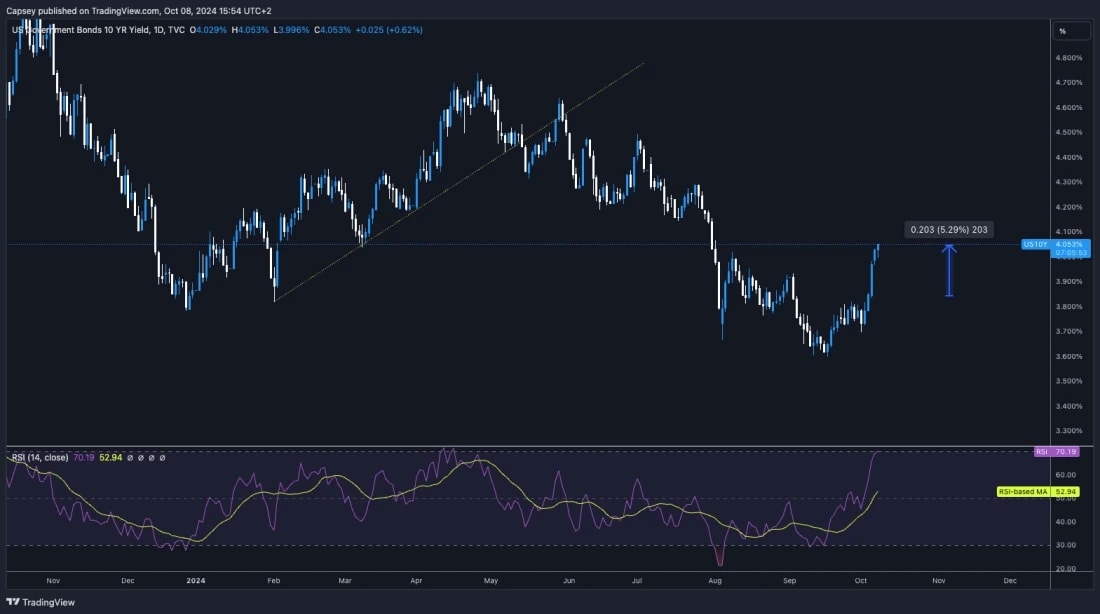
We mentioned that we expected Crypto to go up in our reaction post following the release of the data, and we were right. Although, the market took some time to make its mind up before we finally saw a bid come in and it moves higher.
How assets have performed since the release of Friday's jobs data:
- S&P: +0.24%
- 10Y Bond Yield: +5.29%
- BTC: +3.34%
- SOL: +5.68%
- WIF: +23.43%
- POPCAT: +30.44%
This week's data
This week's focus is on the FED speech and Thursday's Inflation data.There is a plethora of FEDs speaking every day this week. We expect that FED Members will be looking to still be somewhat noncommittal as there's more data between now and the next FED Meeting in early November.
However, we expect them to be more supportive of 25bps interest rate cuts at the upcoming meetings. It's possible that if the FED speak is slightly more hawkish than how we expect them to be, as explained above, then this might provide a small headwind for risk assets in the very near-term (this week/next week).
On Thursday, we have Inflation data. Now, generally speaking, Inflation data has taken more of a backseat in comparison to the labour market data recently, but the market will be looking for the data this Thursday to come out in line with the forecasts.
An upside surprise could be that risk assets sell off very slightly. An in-line print/downside surprise could help risk assets to continue their grind higher. Crypto would likely go higher under this outcome.
Cryptonary's take & $BTC
This week has the potential to be a slightly quieter week as the market might remain subdued until after the release of the Inflation data on Thursday. This is similar to last week, where the market made its more decisive move following the release of the economic (labour market) data on Friday.Beyond this week, we have a quieter few weeks ahead of us in terms of economic data until the last days of the month. We then expect fireworks in early November as important labour market data, a FED Meeting, and the US Presidential Elections roll in.
The executive summary for the next month, and maybe beyond, is this:
- 'Goldilocks' US economy (growth positive, labour market positive, and inflation positive).
- Bitcoin on-chain data metrics suggest we're in a pre-bull euphoria phase.
- Market mechanics have more healthily reset, meaning Bitcoin tourists/weak hands aren't here yet.
Market wise, Bitcoin has played out as we had expected it. This is the zoomed out chart we gave for Bitcoin on the Market Update we released on August 22nd (scroll back and check out at the time of print).
$BTC on 22nd August market update:
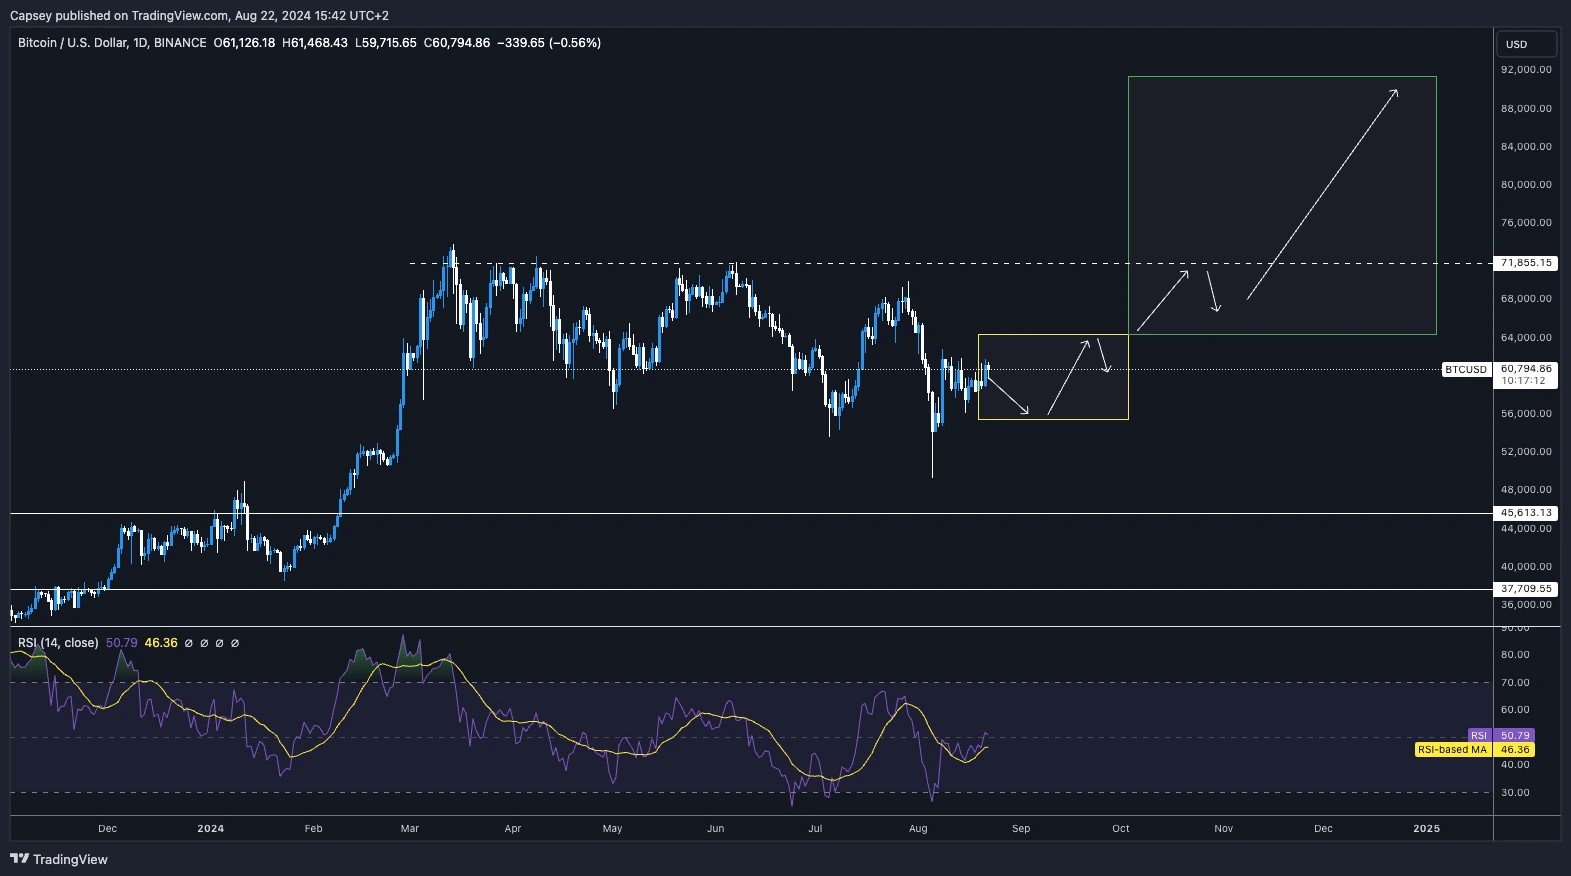
Note the arrows we drew that price may follow. This is the same above chart today with the price action since...
$BTC on 8th October market update:
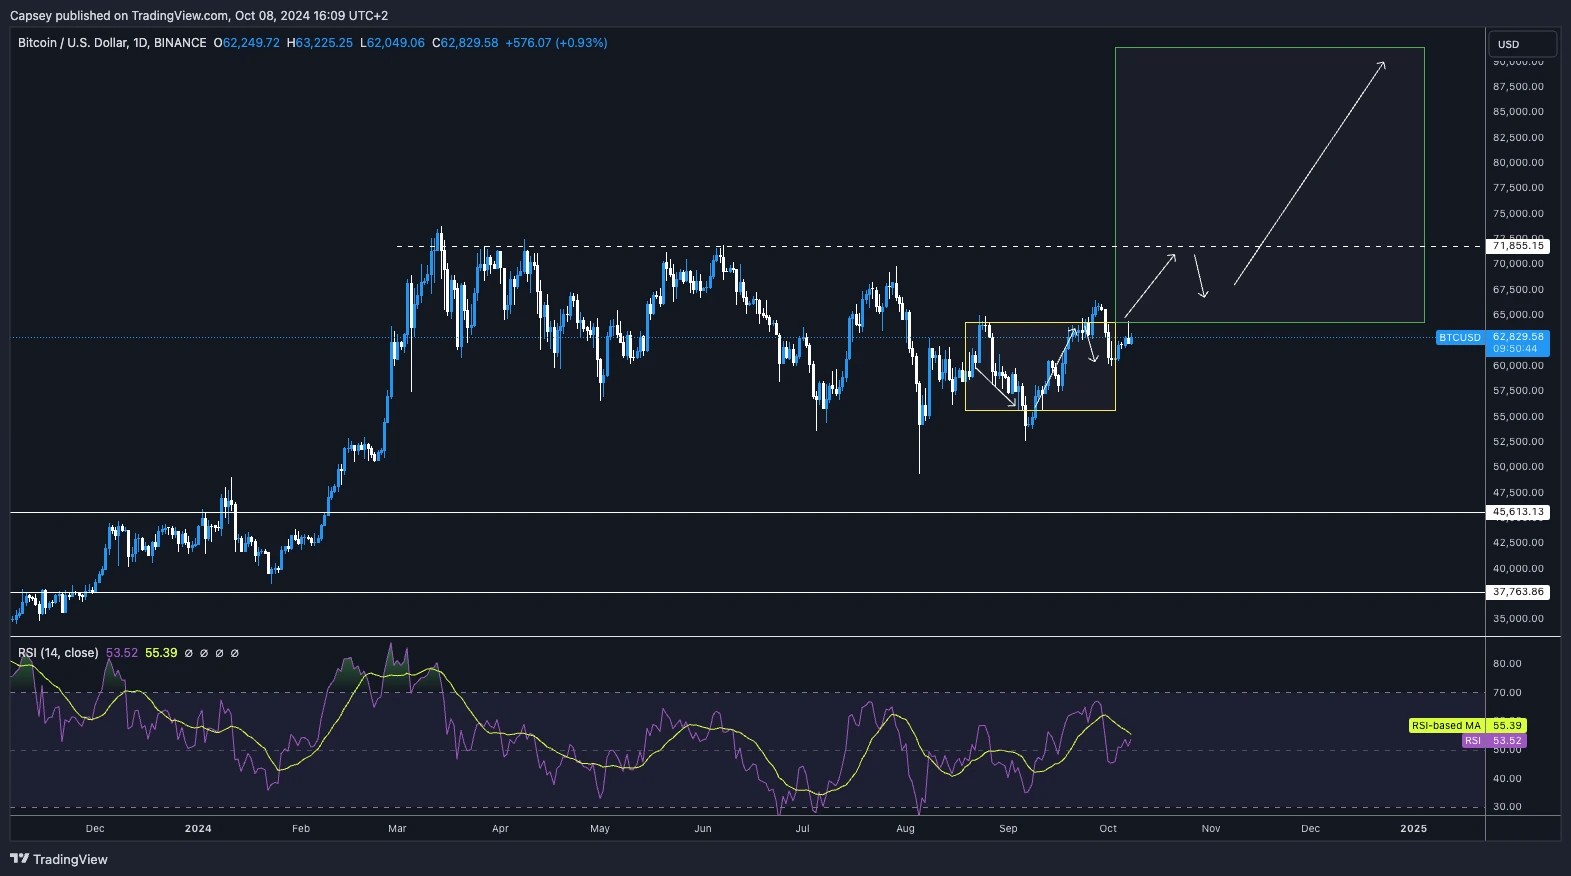
Price has followed the arrows we drew out almost perfectly... Spooky.
We have now served our time in the Yellow box, and the price is now close to climbing up into the Green box, where we might finally see lift-off.
Stick with us; we'll serve you right!
Can Bitcoin hold support and reach $66k?
7 October 2024Bitcoin's price consolidates between $62k and $64k as it faces resistance at $63,400. Positive inflation data could push BTC toward $66k in the coming days, while open interest suggests further upside potential.
Disclaimer: This is not financial or investment advice. You are responsible for any capital-related decisions you make, and only you are accountable for the results.
- Interestingly, Funding Rates have been positive, but they've fluctuated, as Traders have tried Shorting local tops, only to then be blown out of their Shorts just a few hours later, driven by a Spot bid.
- Open Interest is up over the last day but still not at levels that would suggest it's overheated to the upside.
- Overall, BTC isn't overheated here, and from a mechanic's perspective, it could continue to grind higher.
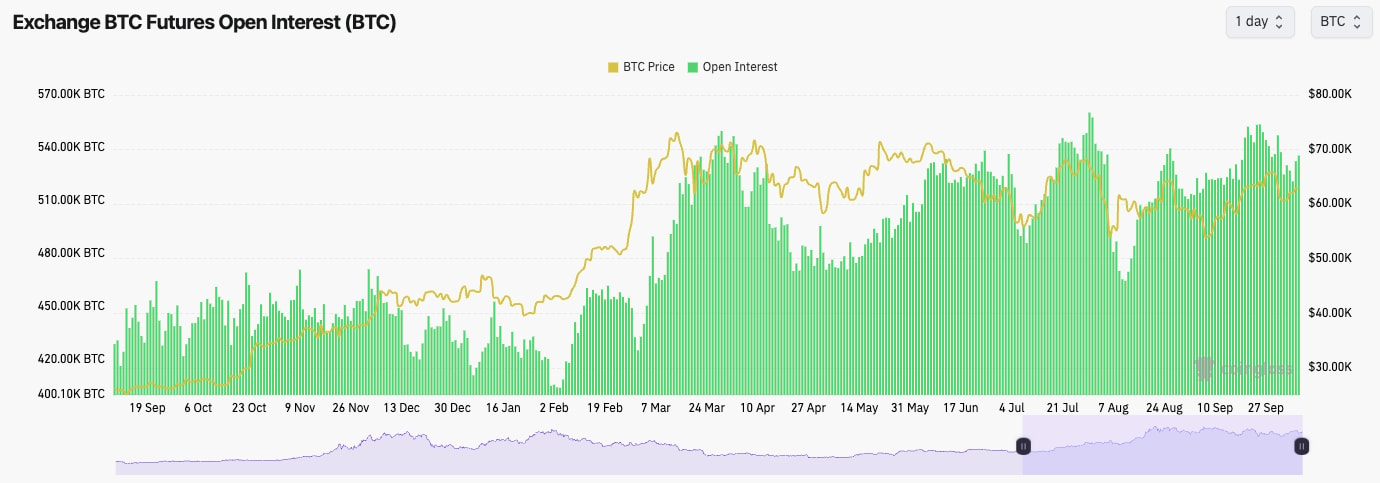
Technical analysis
- After BTC printed the higher high, it pulled back to close to our support area (the Yellow box).
- Price has since bounced from this support area and retested the horizontal resistance of $63,400, where price continues to struggle to climb back above.
- In terms of support, the area between $60k and $62k is likely strong support. We consider the bullish structure to be intact as long as the price remains above $57k.
- On the upside, $63,400 is the local horizontal resistance, with $68,900 being the major resistance beyond that.
- The RSI has reset but is beneath the Moving Average.
- Next few days prediction: Neutral ($62k to $64k range)
- Next 7 days prediction: Bullish
- Next 7 days price target: $66k

Cryptonary's take
Price may be subdued in the run-in to Thursday's inflation data. A positive print (lower inflation) will likely help Bitcoin, and risk assets generally break to the upside, while a negative print (higher inflation) will likely negatively impact Bitcoin. It's possible we will see a few days of chop between $62k and $64k until Thursday's inflation data. We're expecting the inflation data to come in line, and Bitcoin potentially reacts positively to this.Will BTC rebound after $59k support retest?
2 October 2024BTC's price pullback, driven by spot selling amid geopolitical tensions, sees open interest drop while testing key support levels with positive funding rates.
- BTC's Open Interest came down substantially over the past 24 hours, although Funding Rates remained positive.
- We can see that yesterday's price pullback was driven by Spot selling as Iran began bombing Israel.
- This wasn't a leverage flush out; it was more the case that investors de-risked on geopolitical fears.
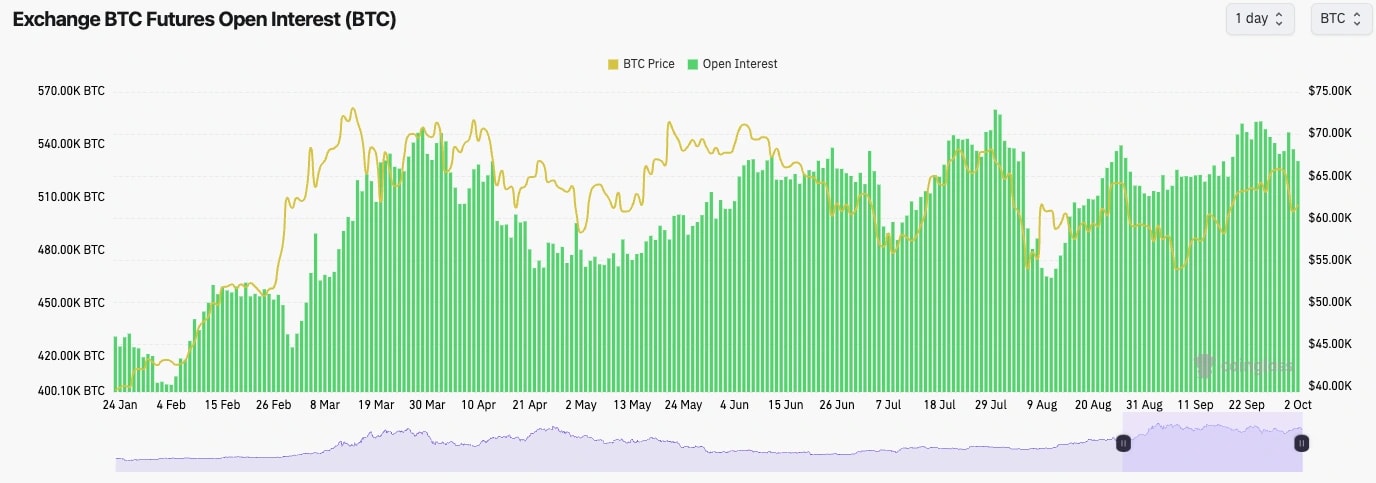
Technical analysis
- Having rallied throughout almost all of September, the price began to pull back during Monday's session.
- The price pulled back from $66k and came down to retest the local uptrend line and the horizontal level of $63,400. But, the price broke down and has pulled back to the local Yellow box we identified in Monday's Market Update.
- This pullback has seen the RSI drawdown more drastically, which is good to see, especially when you've had a clean uptrend.
- We now see the next major support area between $58k and $59k, and we would expect this area to be the more major support.
- On the upside, we see $63,400 as the new local resistance, which will require a price reclaim.
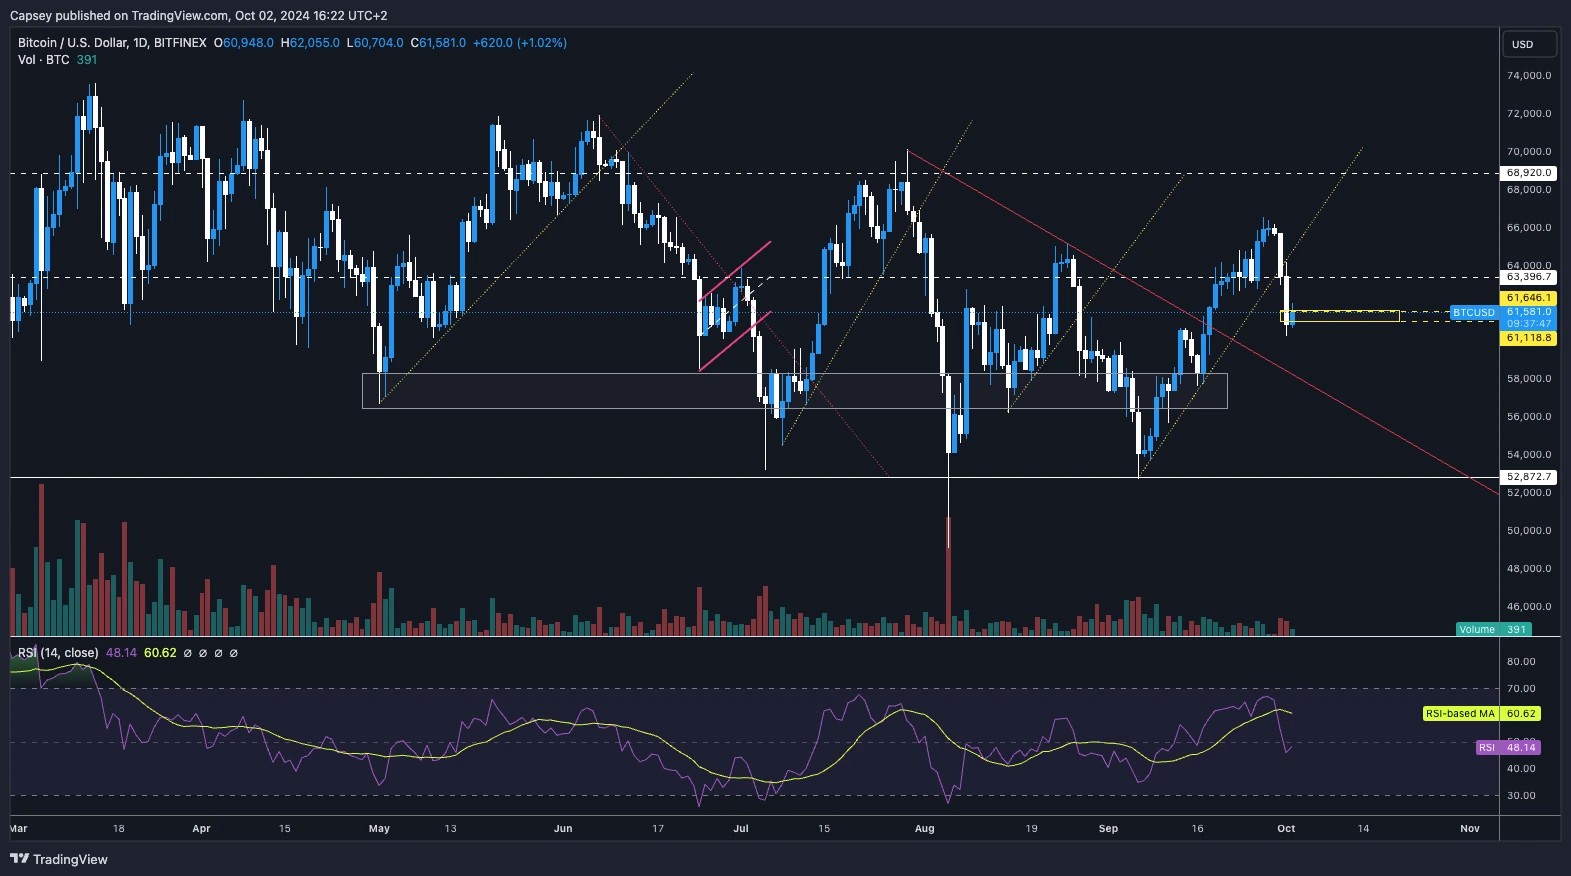
Cryptonary's take
Our thinking is that this pullback was necessary and needed. Price rallied throughout September, essentially in a clear uptrend. These can't go on forever, and you expect pullbacks to come, which we're now getting. Over the coming days, we see the price as likely to be range-bound between $59k and $63,400. We think it's possible that the price does dip into the $58k to $59k area, but even the current price seems attractive when you look at the macro setup we have going into the next 1-2 quarters.Over the coming days and a week or two, we're expecting the price to remain subdued, to potentially retest the $59k area, and then to bounce from there and retest $63,400.
BTC surges, cautious of pullback
01 October 2024BTC reclaimed $63.4K support after breaking the downtrend. With resistance at $68.9K, a potential pullback could be imminent.
- BTC's Open Interest is relatively unchanged over the last few days whilst Funding Rates have remained positive but at normal/healthy levels.
- BTC's price increase from $63K to $66 K was mostly driven by Spot buyers.
Disclaimer: This is not financial or investment advice. You are responsible for any capital-related decisions you make, and only you are accountable for the results.
BTC mechanics breakdown:
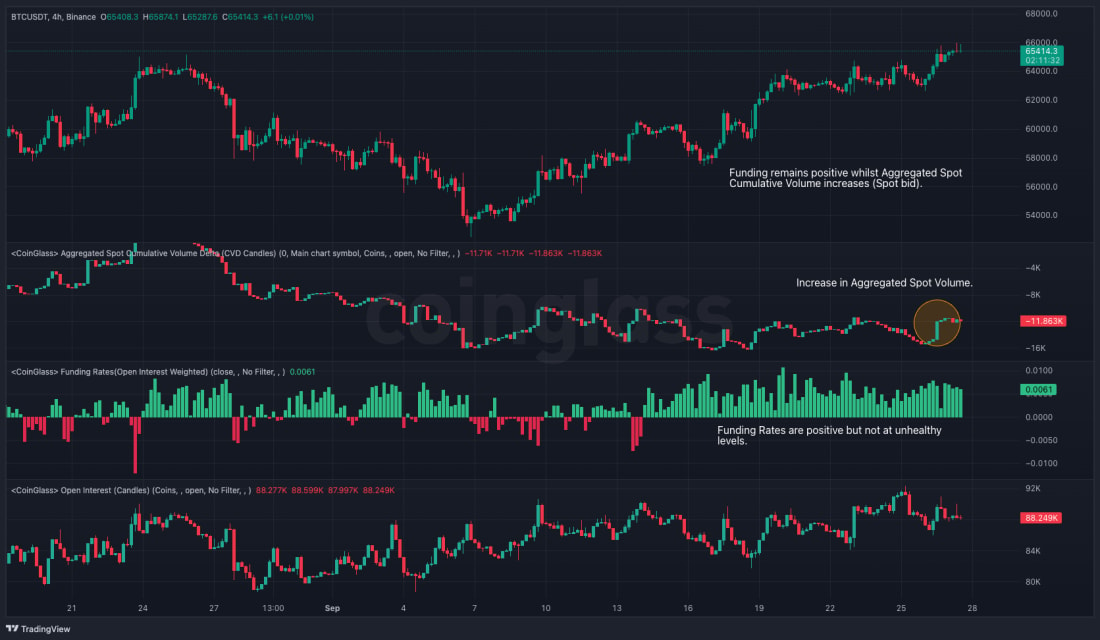
Technical analysis
- Following a breakout from the downtrend line (red line), the price was able to reclaim above the horizontal resistance of $63,400 while maintaining the local uptrend.
- If the price were to pull back from here, we would look to the horizontal level of $63,400 as new support.
- If $63,400 is lost, we would expect the $61k area to support price.
- To the upside, the major horizontal resistance is at $68,900. We don't expect this to be overcome in the immediate term.
- The RSI is approaching overbought conditions, currently at 66, so this might suggest that a higher resistance (ie, $68,900) may likely act as too strong of a resistance in the short-term, if price is even able to retest that level in the immediate term.
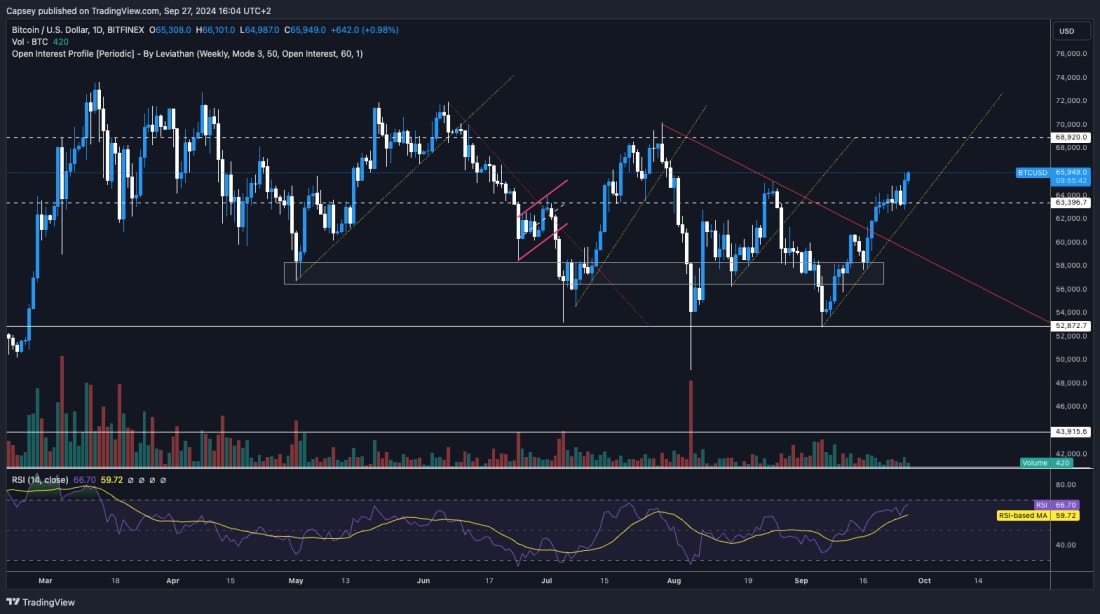
Cryptonary's take
In the immediate term, we're slightly cautious about BTC. It's possible that BTC can continue its move higher and retest $68,900, but we're not confident that it can get beyond that in the immediate term. Price is up 24% in 3 weeks, so it's possible we can see a slight pullback either now or at some point very soon. However, beyond the immediate term, we're very bullish.Therefore, we're looking to remain in Spot positions even though we think it's possible that we will see a slight pullback in the very near term. But, this isn't enough to entice us to sell; we'd prefer to just ride through any short-term volatility - assuming we're correct and we do actually see a slight pullback in the immediate term.
Is $68,900 next target?
27 September 2024- BTC's Open Interest is relatively unchanged over the last few days whilst Funding Rates have remained positive but at normal/healthy levels.
- BTC's price increase from $63K to $66 K was mostly driven by Spot buyers.
Disclaimer: This is not financial or investment advice. You are responsible for any capital-related decisions you make, and only you are accountable for the results.
BTC mechanics breakdown:
Technical analysis
- Following a breakout from the downtrend line (red line), the price was able to reclaim above the horizontal resistance of $63,400 while maintaining the local uptrend.
- If the price were to pull back from here, we would look to the horizontal level of $63,400 as new support.
- If $63,400 is lost, we would expect the $61k area to support price.
- To the upside, the major horizontal resistance is at $68,900. We don't expect this to be overcome in the immediate term.
- The RSI is approaching overbought conditions, currently at 66, so this might suggest that a higher resistance (ie, $68,900) may likely act as too strong of a resistance in the short-term, if price is even able to retest that level in the immediate term.
Cryptonary's take
In the immediate term, we're slightly cautious about BTC. It's possible that BTC can continue its move higher and retest $68,900, but we're not confident that it can get beyond that in the immediate term. Price is up 24% in 3 weeks, so it's possible we can see a slight pullback either now or at some point very soon. However, beyond the immediate term, we're very bullish.Therefore, we're looking to remain in Spot positions even though we think it's possible that we will see a slight pullback in the very near term. But, this isn't enough to entice us to sell; we'd prefer to just ride through any short-term volatility - assuming we're correct and we do actually see a slight pullback in the immediate term.
BTC dominance near 60%: Is a major altcoin rally coming soon?
26 September 2024Current state: BTC dominance continues to remain inside the rising wedge we've been tracking for several months. Price action has been squeezing within the wedge, with BTC dominance approaching the upper resistance zone near 60%. The market is reaching a critical moment where BTC dominance is likely to make a decisive move.
Key observations
- Resistance: BTC dominance is nearing the top of the wedge, with the 60% resistance zone serving as a major level. Once dominance reaches this point, we could see a sharp rejection, which would likely lead to a significant inflow of capital into altcoins.
- Potential scenario: While BTC dominance may spike one last time toward the upper resistance, the overall structure of the wedge suggests an impending breakdown. When this occurs, we expect altcoins, including SOL and ETH, to begin outperforming BTC as money rotates out of Bitcoin and into the altcoin market.
- Market dynamics: This final stretch of BTC dominance within the wedge signals that the market is on the verge of a shift. A breakdown in BTC dominance would likely coincide with the start of a broader altcoin rally, marking the next phase of the bull cycle.

Disclaimer: This is not financial or investment advice. You are responsible for any capital-related decisions you make, and only you are accountable for the results.
Conclusion
BTC dominance is at a critical point as it nears the apex of its rising wedge. A spike towards the 60% resistance level is likely, but a breakdown is expected to follow. This will likely mark the beginning of a capital rotation into altcoins, signalling the start of the next major altcoin rally.Will BTC stay above $63,000?
20 September 2024- Bitcoin's funding rate has mostly been positive but fluctuated, and the open interest rate has increased more noticeably.
- A rising OI, especially considering that it's mostly Longs, might mean the price is vulnerable to a small flush out to the downside, shaking out these late Longs.
- We wouldn't expect the flush out to be severe, potentially just a 2-3% price move lower before a rebound.
Disclaimer: This is not financial or investment advice. You are responsible for any capital-related decisions you make, and only you are accountable for the results.
Bitcoin Open Interest:
Note: Note the larger-than-usual increase in OI (far right-hand side of the chart) in the last few days as the price has moved higher.
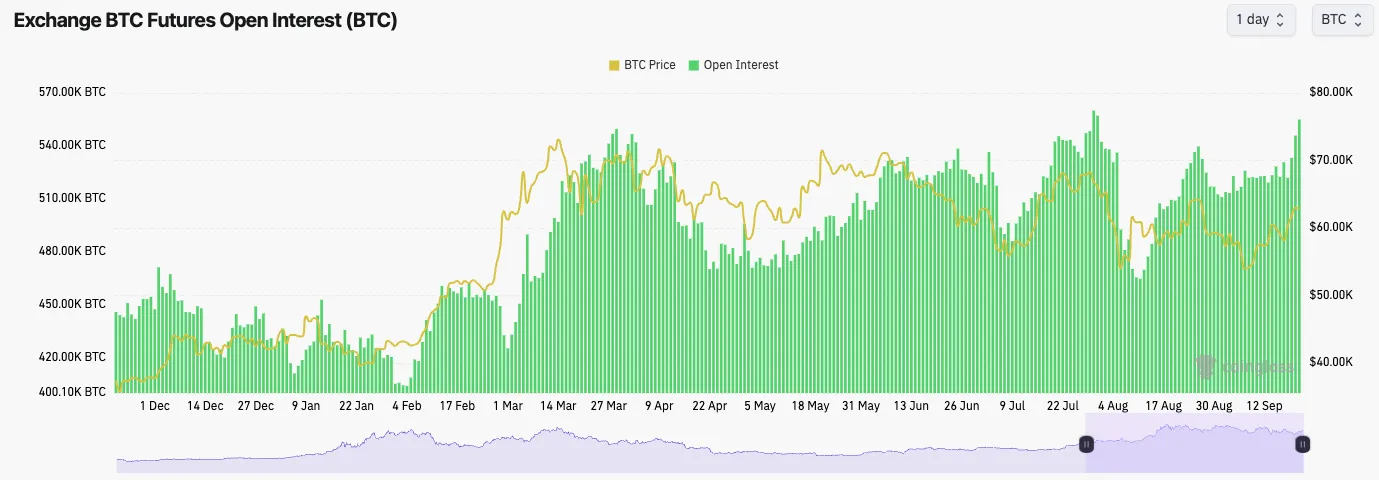
Technical analysis
- In the last Market Direction we released, we mentioned BTC pulling back from $60k, retesting $58k, and then pushing on to retest $63,400, which is exactly what's happened.
- Price is now testing the horizontal resistance at $63,400 but struggling to maintain above it.
- In the short term, $63,400 may act as enough of a resistance that the price rejects from that area.
- We would be looking at a slight pullback and retest of $60,200 to $61,800 as an area of support.
- If price does lose $60k, we'd expect $56k to $58k to act as support again.
- What we do like is that BTC is still in it's local uptrend whilst it has also broken out of the local red downtrend line.
- The RSI isn't yet close to being overbought so there is still the potential for more upside to be had here.
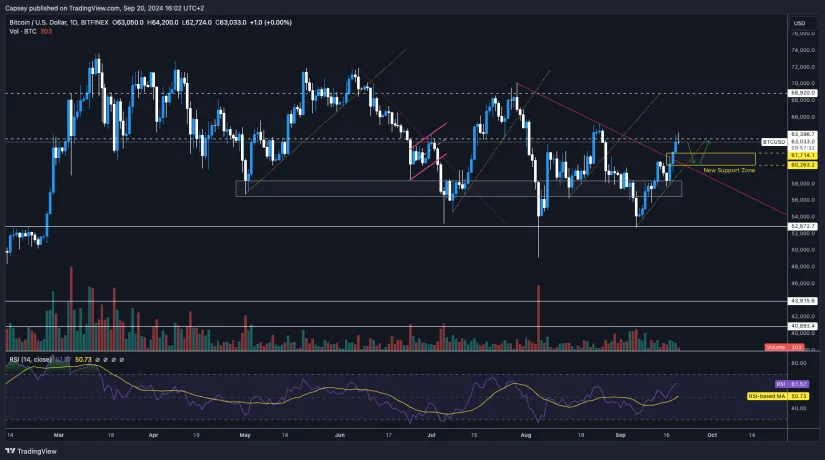
Cryptonary's take
In the short-term (next 2-4 days), we expect the price to pull back very slightly from $63,000 and potentially retest the Yellow box area (between $60,200 and $61,700). But, beyond that, we think there can still be another positive week or two before we move closer to the build-up of the election, where markets might get more jittery throughout October, and the level of risk-on might be more subdued during that period.Over the next 10-14 days, we're expecting the price to remain relatively range-bound between $60k and $64k, but it is more tricky to call here beyond a very shorter-term pullback, which we think is likely. Let's see what we get beyond that.
BTC rejects $61K, can it break $63K?
16 September 2024- Price has moved from the low $50k's to the local high of $60k, mostly driven by Spot buying and Shorts being squeezed.
- Funding Rates are close to flat/neutral here now.
- Open Interest has remained relatively flat and range-bound over the last few days.
Technical analysis:
- BTC bounced perfectly from the horizontal support at $52,800, and was driven up to $60k as over confident Shorts were squeezed.
- Price has now rejected just shy of $61k.
- Price is in a local uptrend and has now pulled back slightly to retest the potential support box between $56,500 and $58,200.
- Having moved higher, price was close to testing the downtrend line (red line). A breakout of the downtrend would likely see BTC retest $63,400.
- The next major horizontal resistance above price is at $63,400. We don't expect BTC to reclaim above this level in the short-term.
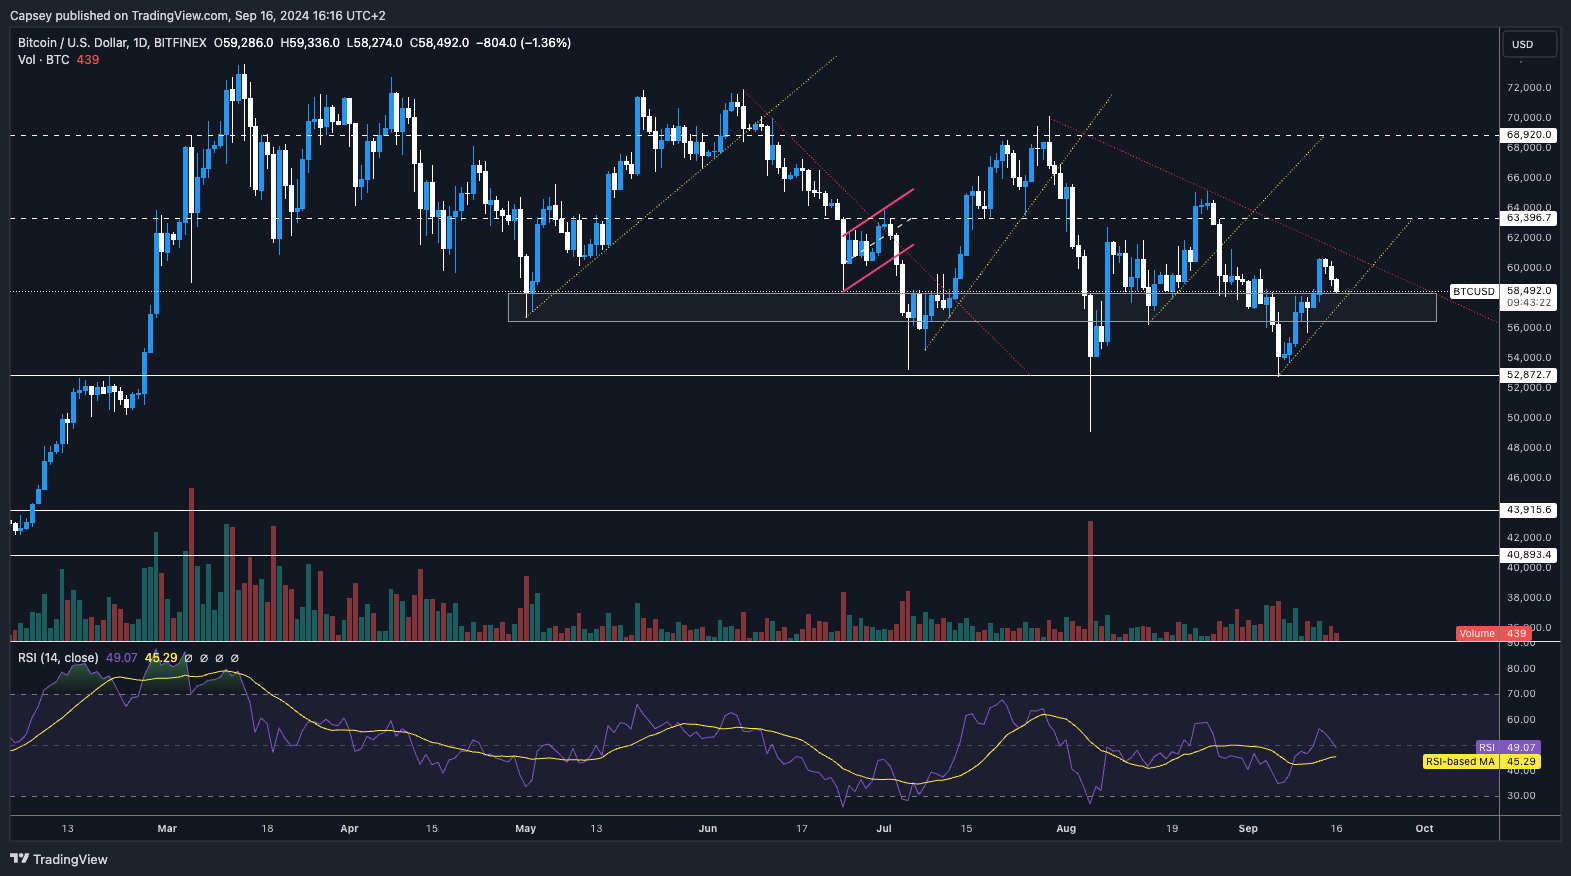
Cryptonary's take
Bitcoin has seen a nice relief rally over the past 10 days, however, price has put in lower highs and lower lows on a macro structure whilst volumes in the short-term have downtrended. The key event this week is the FED and the Press Conference. Currently, the market is just about pricing for the FED to do a 50bps Interest Rate cut, which we think the markets will actually like.Therefore, we think BTC can hold the grey box (between $56,500 and $58,200) between now and Wednesday's FED Decision and Press Conference. Then, following Powell's Press Conference, which we're expecting to be dovish, we think BTC and Crypto might then move higher and potentially break out of the downtrend and retest $63,400.
Will BTC break $58k or find support in the low $50k range?
10 September 2024- In BTC terms, open interest has increased slightly over the past few days, and the funding rate has turned substantially negative.
- Traders are now paying a premium to be Short here. This provides the setup for a slight furthering in the relief rally that we're seeing.
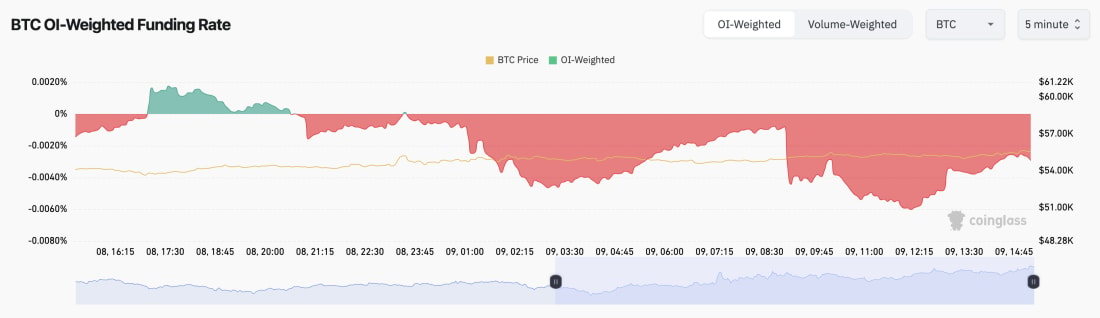
Technical analysis
- Prices across the board moved down meaningfully last week. For BTC, the price found support and bounced from the major horizontal support we have had outlined for many months at $52,800.
- Price is now below the grey support box ($56,500 to $58,000), which will now likely become the new resistance.
- Beyond the grey box, $60,300 will likely act as a resistance for price in the short term.
- BTC is currently squeezing into a local downtrend line. A breakout of this could see price get back up to and retest $58,000, although we're not confident that it will get back above this level in the short term.
- To the downside, we expect the $48k to $52k area to be a large area of support.
- BTC has put in a bullish divergence (lower low in price but higher low on the oscillator). This can help push BTC up to $58k.
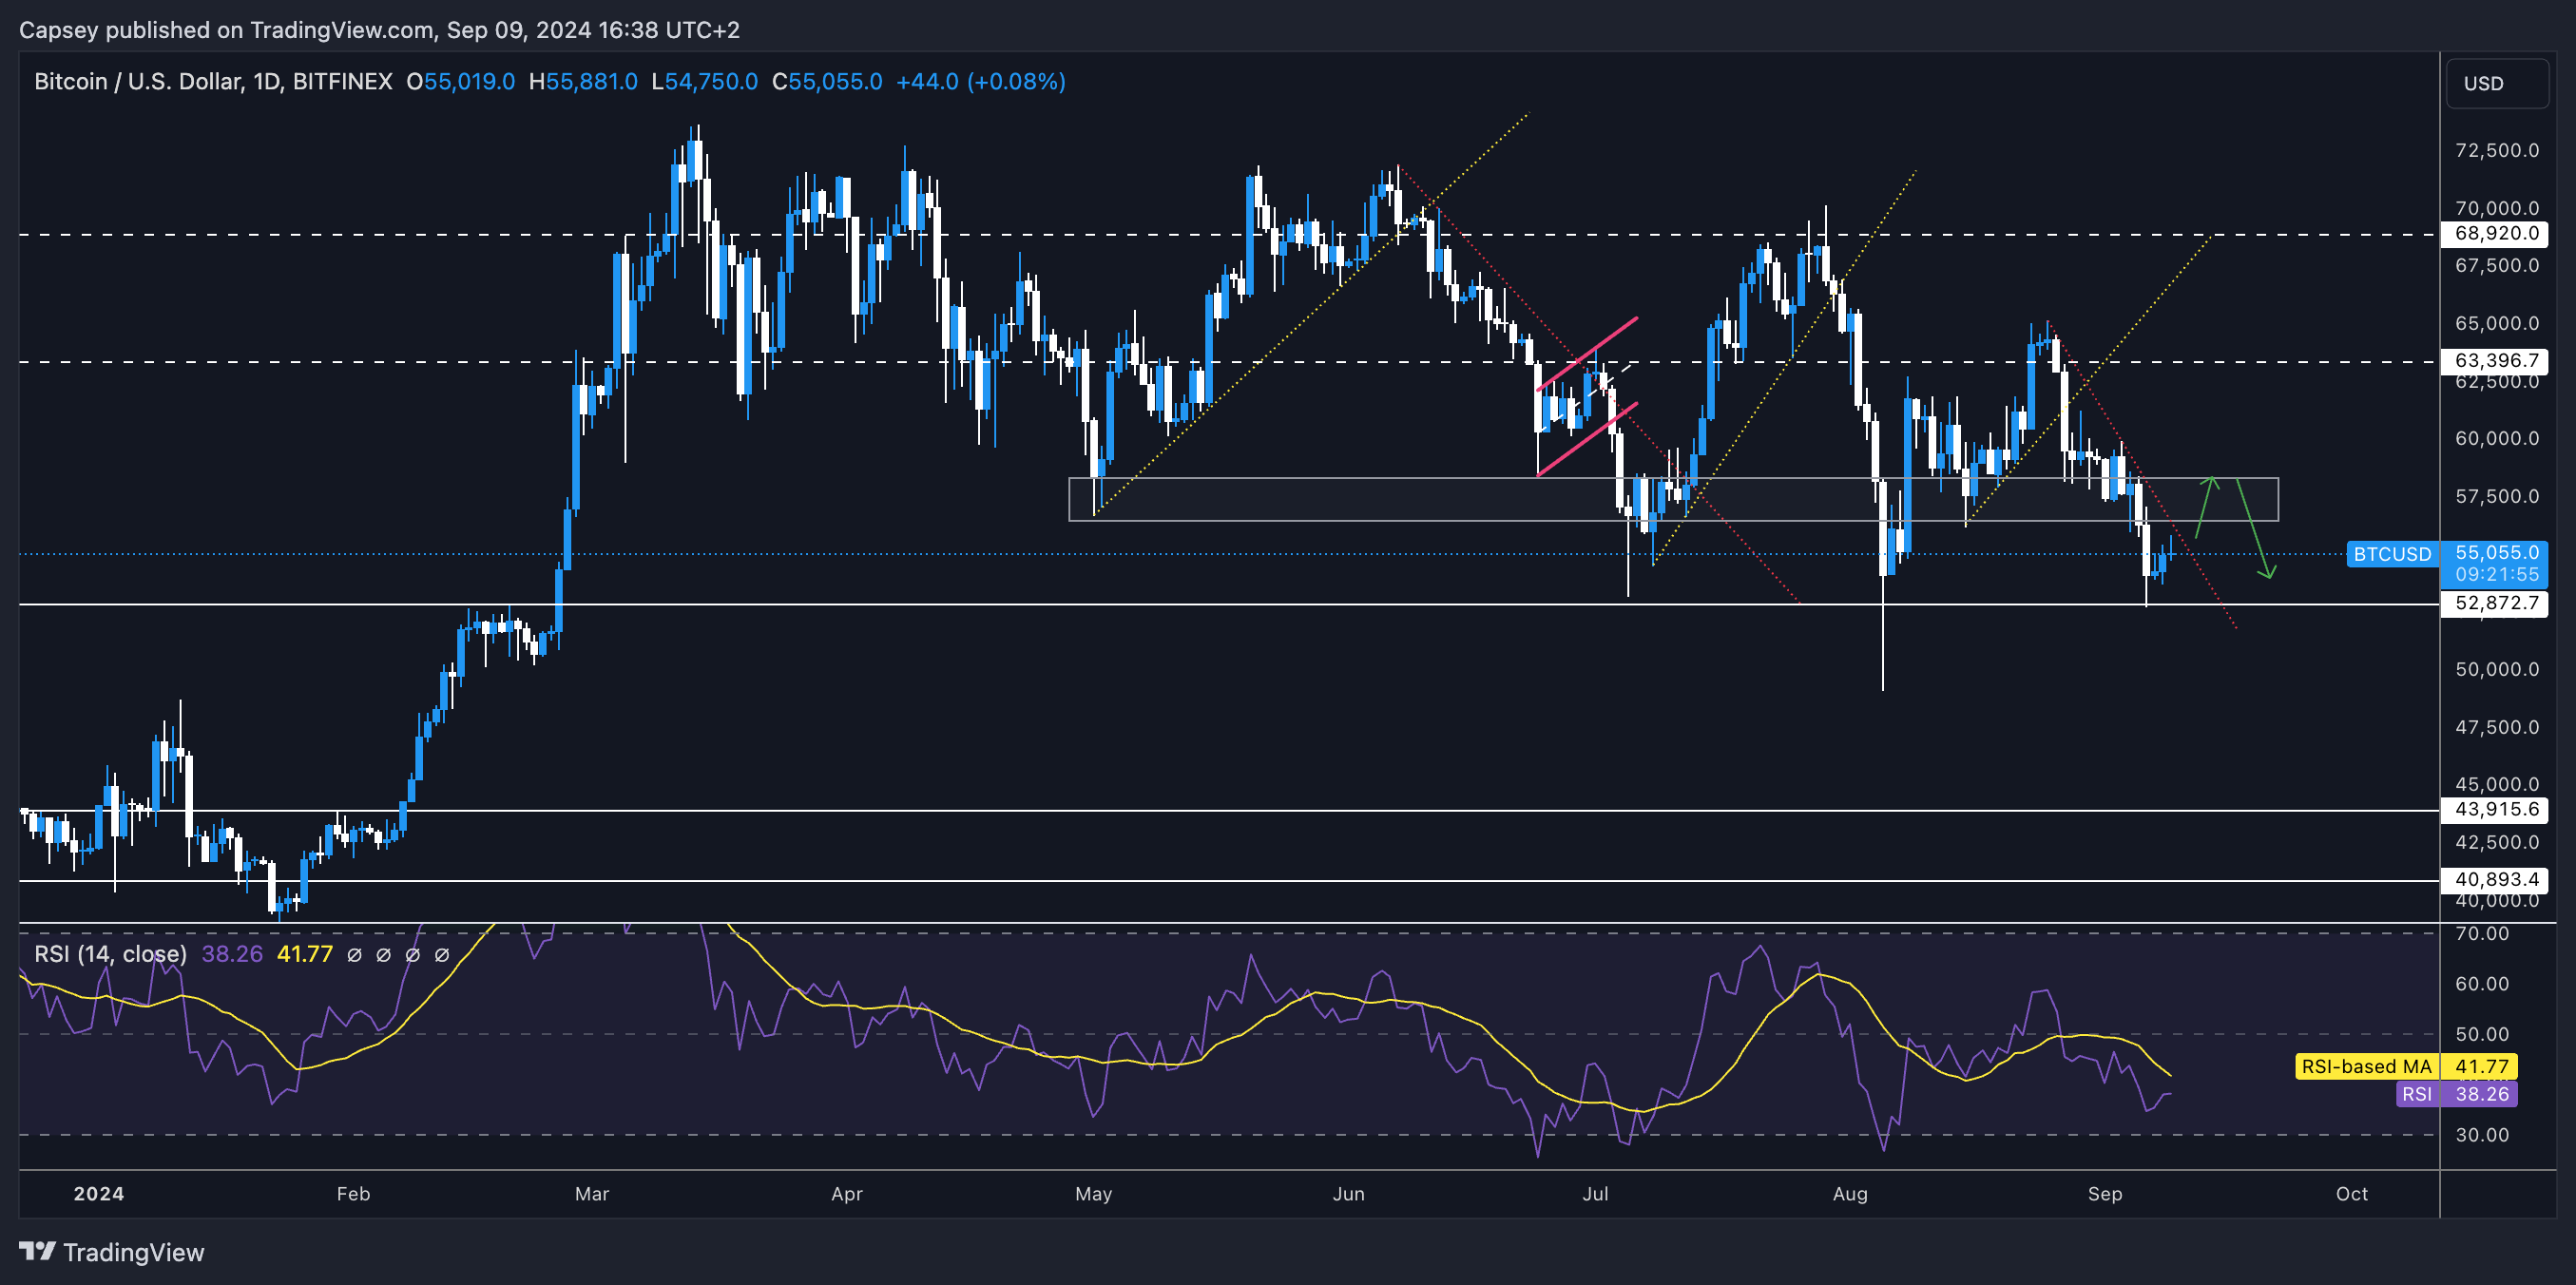
Cryptonary's take
Over the coming days, we expect risk assets (Bitcoin included) to have a continuation of the relief rally. However, we expect this to stall around or just shy of the $58k level. We expect a move back down to the low to mid $50k following that.The next few weeks will likely see substantial volatility, and we think we'll see BTC trade between $52k and $58k during this period. We're not necessarily on board with the view that Bitcoin will materially break down below $48k, as we see some calling for it on Twitter. If BTC were to re-visit the late $40k, we would be strong buyers in that zone.
Can BTC hit $58k, or is it a drop to $52k?
9 September 2024- In BTC terms, open interest has increased slightly over the past few days, and the funding rate has become substantially negative.
- Traders are now paying a premium to be Short here. This provides the setup for a slight furthering in the relief rally that we're seeing.
Technical analysis:
- Prices across the board moved down meaningfully last week. For BTC, the price found support and bounced from the major horizontal support we have had outlined for many months at $52,800.
- Price is now below the the grey support box ($56,500 to $58,000) which will now likely turn in to new resistance.
- Beyond the grey box, $60,300 will likely act as a resistance for price in the short-term.
- BTC is currently squeezing in to a local downtrend line, a breakout of this could see price get back up to and retest $58,000, although we're not confident in the short-term that price will get back above this level.
- To the downside, we expect the $48k to $52k area to be a large area of support.
- BTC has put in a bullish divergence (lower low in price but higher low on the oscillator). This can help push BTC up to $58k.
Cryptonary's take
Over the coming days, we expect risk assets (Bitcoin included) to have a continuation of the relief rally. However, we expect this to stall around or just shy of the $58k level. Following that, we expect a move back down to the low to mid $ 50k. The next few weeks will likely see substantial volatility, and we think we'll see BTC trade between $52k and $58k during this period.We're not necessarily on board with the view that Bitcoin will materially break down below $48k, as we see some calling for it on Twitter. If BTC were to re-visit the late $ 40k, we would be strong buyers in that zone.
Is a short squeeze on the horizon?
4 September 2024- BTC’s Funding Rate is currently negative, meaning that there is a bias among traders to be short.
- BTC’s Open Interest has increased as prices have gone lower, again indicating that the action is mostly from traders piling into fresh short positions here.
- The above is somewhat dangerous, and if we begin to see a significant spot bid, this could drive a short squeeze.
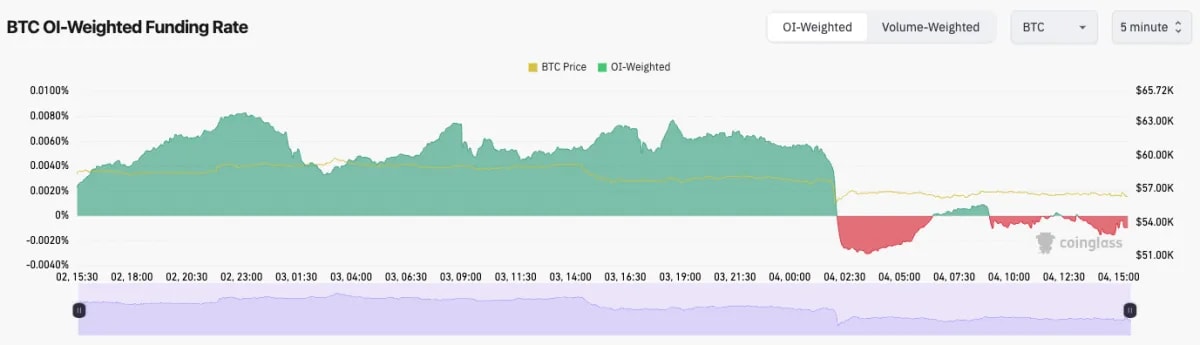
Technical analysis
- BTC broke below the local uptrend line and has now found support at a local level in the grey box between $56,400 and $58,300.
- Below the grey (support) box, the next major horizontal level of support is at $52,800.
- In order for BTC to get the bullish reversal, it would need a clean reclaim of $63,400, which currently seems a long way off. We’re also not expecting this anytime soon.
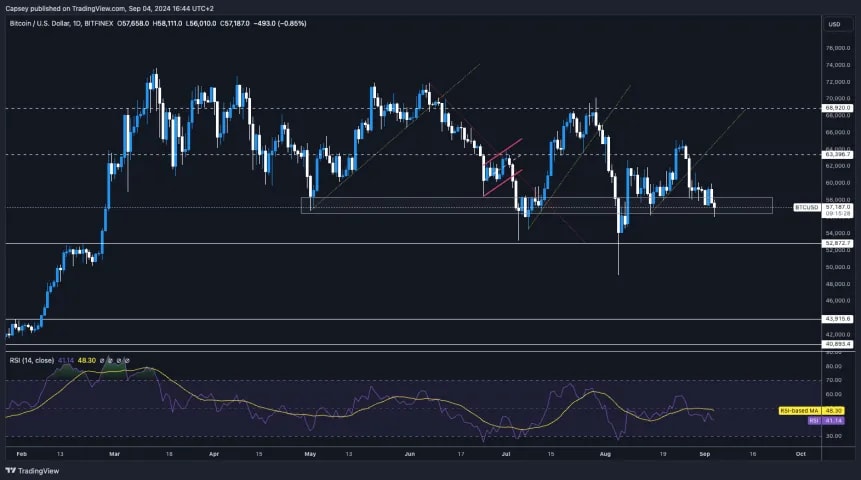
Cryptonary’s take
From a technical perspective, this looks like the area Bitcoin should bounce from, possibly forcing a move up to $61k. However, and this is just me (Tom) personally speaking, I don’t feel super confident about the market here, although I don’t feel confident about that call either. In these types of situations, it’s best to remain positioned, as our mid- and longer-term outlook remains bullish/favourable. But in the short term, we’re unsure how Bitcoin might move.Will Bitcoin surpass $63,400 resistance?
29 August 2024- In our last Market Direction, we commented that BTC's Open Interest had increased to relatively high levels, making it vulnerable to a flush-out. We got this on Tuesday.
- BTC's Funding is now flip-flopping between slightly positive and slightly negative, again indicating indecision.
- This is typical when the market is range-bound, and traders have become bored/somewhat stir-crazy by the price action.
- The Open Interest has been flushed back out again, and price from a mechanics perspective looks ok to grind higher from here.
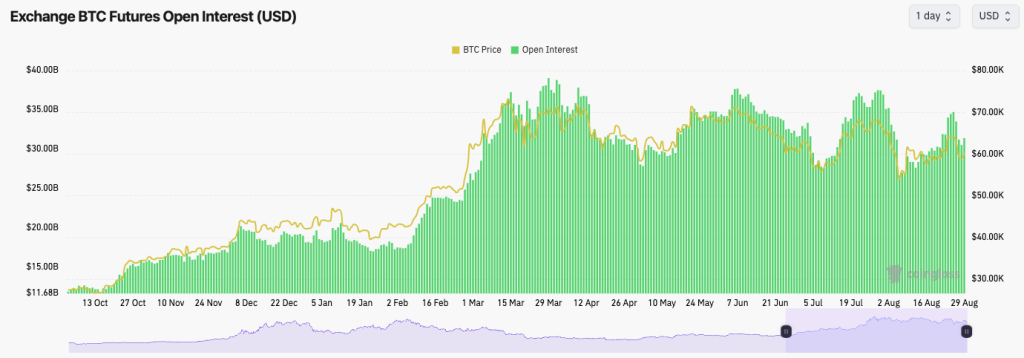
Technical analysis
- We weren't necessarily expecting BTC to have a substantial breakdown, but once the $63,400 level was lost, Longs were offside, and the leverage was flushed, causing a more significant drop in price.
- Price was then unable to find support in the $61k to $62k region.
- We have placed a grey box where we believe there is stronger support for price between $56,500 and $58,300. We expect that area to hold in the short term (we'll see how price develops beyond the short term).
- Ultimately, price is still in its major range between $53k and $69k, and actually now back in its tighter range between $56k and $64k.
- We're not expecting the market to see any fireworks until the range, particularly the tighter range, can be broken.
- In order for us to turn more bullish in the immediate term, we'd need to see price reclaim above $63,400.
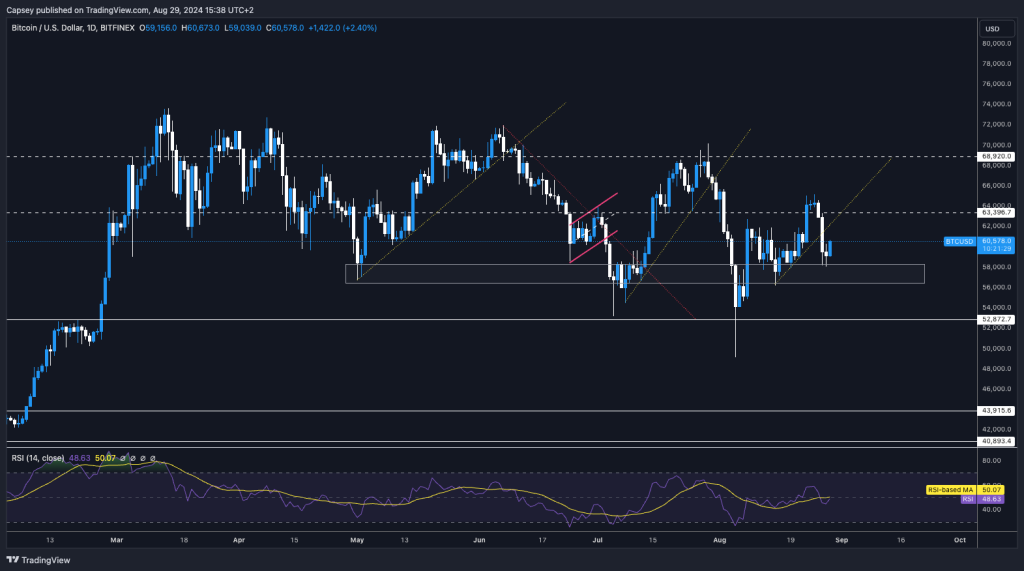
Disclaimer: This is not financial or investment advice. You are responsible for any capital-related decisions you make, and only you are accountable for the results.
Cryptonary's take
Looking back now, price has essentially done what we expected over the last few weeks-absolutely nothing and just been range-bound. We are expecting more of this. However, come next Friday (September 6th), if the US Payrolls (and Unemployment Rate) are positive, i.e., showing that the labour market is holding up still, we believe that could ignite the rally as we move to Interest Rates on September 18th.On another note for Bitcoin, if we refer to the zoomed-out chart and prediction we made for BTC's price action over the coming months, it's still right on track; in fact, the price rejected at the top of the Yellow box.
BTC 3D Timeframe: Zoomed-out perspective
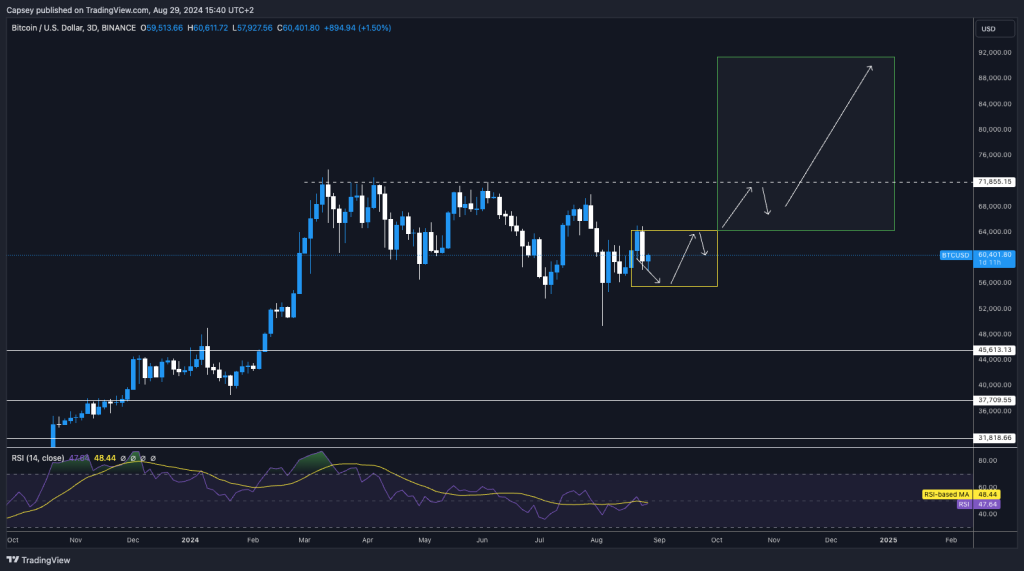
BTC dominance at 57%: Is a breakout to 60% next?
27 August 2024Current State
BTC dominance has continued to move within the long-standing rising wedge on the weekly timeframe, which has been developing for over two years. As BTC.D approaches the apex of this formation, the market remains at a critical juncture where a major move is imminent.Key Observations:
Resistance: The 57% region continues to serve as a significant resistance level. This level aligns with the apex of the rising wedge, marking a historically important area where BTC.D previously formed a lower high before spiking to 72% and then sharply declining to under 40% in 2021.Potential Scenario: While BTC.D could still rise towards the 60% level, this move is likely to represent the final leg before a potential breakdown from the wedge. Such a breakdown would likely result in a flow of capital from BTC into altcoins, potentially triggering the next altseason.
Market Dynamics: The prolonged consolidation within the wedge and the approaching apex suggest that BTC.D is nearing a decisive moment. The direction of the breakout or breakdown will have significant implications for the broader market, especially for altcoins.

Conclusion
BTC dominance remains at a critical point as it approaches the tip of a two-year rising wedge. The 57% resistance level is pivotal, and while a move to 60% is possible, a breakdown from this wedge could lead to a substantial shift in market dynamics, favouring altcoins over BTC.Will Bitcoin surge to $68,900?
26 August 2024BTC's Open Interest increased substantially over the weekend to $34.7b, a substantial increase from the $26.6b lows just three weeks ago.
BTC's Funding Rate remains relatively low, between 0.00% and 0.01%, indicating a bias to be Long, but it's not a substantial bias.
Traders are relatively balanced here between Longs and Shorts.
BTC Open Interest:
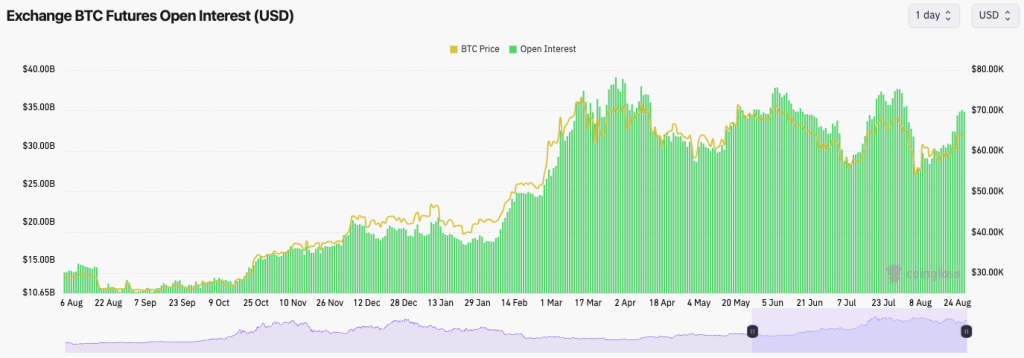
Technical analysis
- It was a really great weekend, with Bitcoin moving higher and reclaiming above the key horizontal level of $63,400.
- We'd like to see price use the $63,400 horizontal level as new support, which can help propel price higher from there.
- Above the current price, the major horizontal resistance is the $68,900 level.
- On the downside, if $63,400 is broken, we'd expect price to find support in the zone between $60,300 to $61,800.
- The RSI is at 57, so this indicator suggests there could be more upside momentum for price ahead.
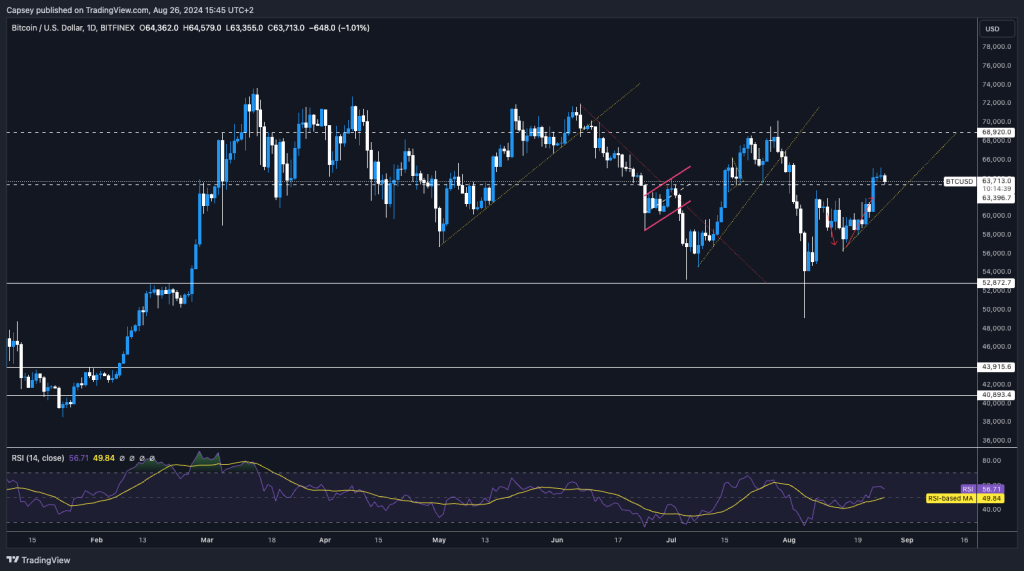
Cryptonary's take
The market has made a very positive move up over the last five days or so, reclaiming a key level of $63,400. We didn't expect price to move up as strongly as this last week.However, with positive comments from Powell at Jackson Hole, the market has responded to the upside. The market may now consolidate until Thursday and Friday's data and will likely move up or down more materially based on how that data comes in.
In the immediate term (next few days), we don't have a clear view of how price might move here. So, we'd look for price to retest the $63,400 horizontal support and bounce from that level. That would increase our confidence that Bitcoin can move up and retest its overhead resistance at $68,900.
Will $63K hold or break in Q4 2024?
20 August 2024From a mechanics perspective, Bitcoin's Funding Rate has continued to move back and forth between slightly positive and slightly negative over the past week. This shows indecision among traders.
In the last 24 hours, Bitcoin's Open Interest has kicked up slightly but remains well below the highs, suggesting that traders are unwilling to pile leverage back on following the flush out from a fortnight ago.
BTC Open Interest:
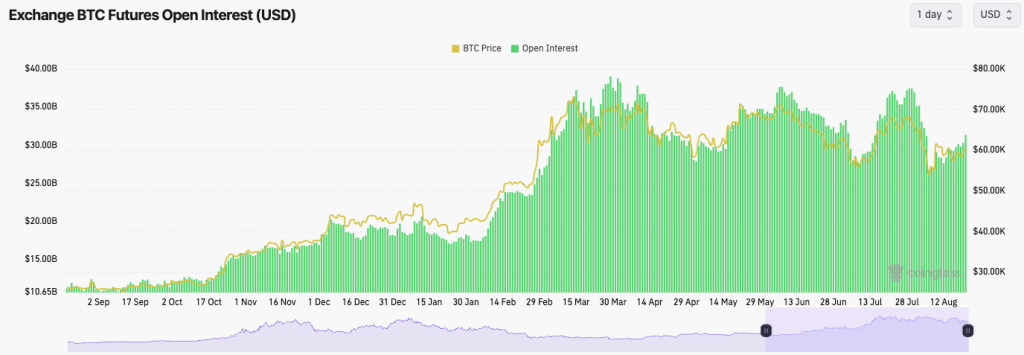
Technical analysis
- Price has perfectly followed the arrowed direction we placed ten days ago.
- Price is currently still beneath the horizontal resistance of $63,400, which is a key level for price to reclaim for price to then see a bullish reversal.
- Price is well above the main horizontal support of $52,800, and it has also recently bounced off of the local support of $56,000.
- The RSI is in middle territory here, so that's not providing a headwind for the price to move in either direction.
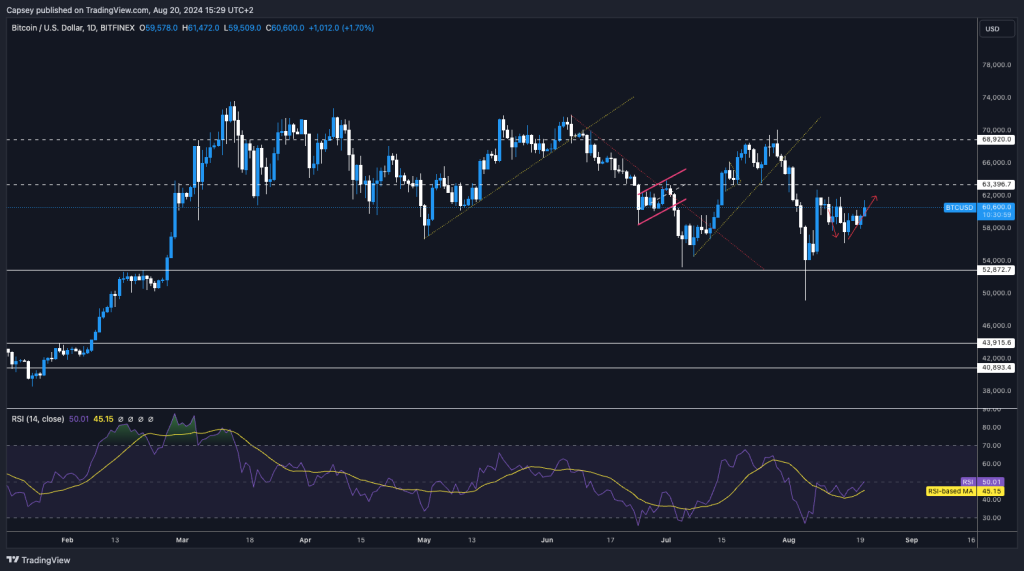
Cryptonary's take
What could be described as boring price action, we could argue we called perfectly last week. Of course, we want to call for crazy price targets, but our job is to do our best to predict/estimate what's going to happen, and over the last week, we've done that.August is always a quieter month, with lighter volumes; therefore, big volatility bouts are possible. However, in the immediate term (between now and Powell speaking on Friday), we're expecting price to remain between $56k and $63k. We're not expecting any fireworks in the immediate term.
But over the medium term, we are becoming increasingly bullish. We see the last six months of range-bound price action as hugely positive for Bitcoin once it decides to break out, which we believe we will see in the coming months. Q4 2024, we're expecting fireworks, with 2025 to be even better. Patience for now and that's reflected in our conservative and more subdued price targets for the immediate term.
Will it drop below $56k soon?
16 August 2024Bitcoin's Funding Rate has been negative over the last 24hours meaning there is a bias amongst traders to be Short (hence Shorts are paying Longs the premium).
- Open Interest had meaningfully reset following the flush out 10 days ago, when Bitcoin's price collapsed. OI has increased slightly since, but not to any meaningful degree.
- We have had a resetting in leverage which is usually a positive. We've now also seen Shorts start to pile up, again, usually a positive following a leverage flush out, that tends now to create more meaningful lows for price.
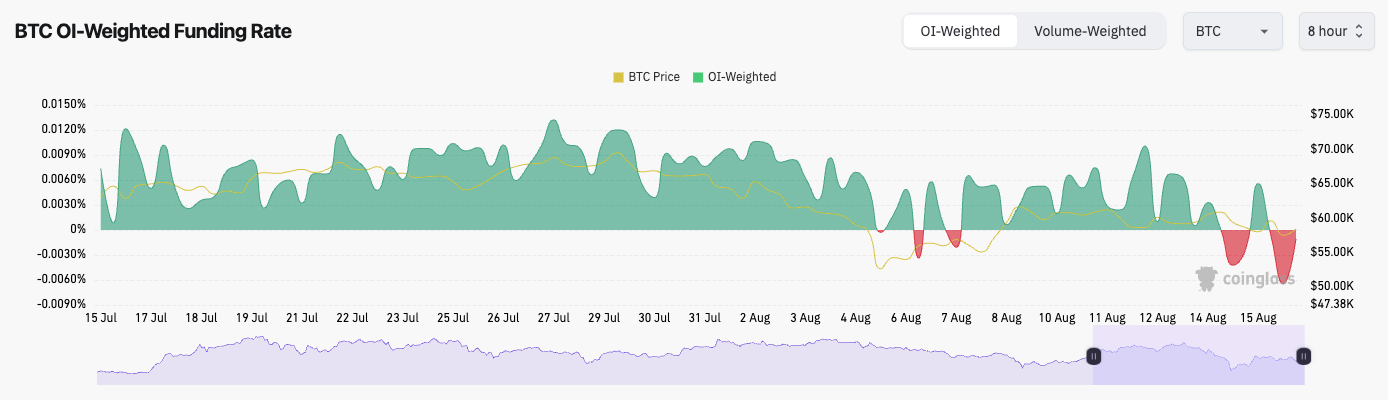
Technical analysis
- - In the last Market Direction (posted on Monday), we mentioned that we expect BTC's price to pull back slightly, which is exactly what we've seen.
- - In terms of general structure here, there aren't many price formations that stand out to us currently.
- - Essentially, Bitcoin is just still range bound between $52,800 and $63,400 in a wider range, and a tighter range of $56,200 to $61,800.
- - August is usually a not so great month for Crypto, and this is likely due to the fact that volumes are low as big traders are on holidays.
- - The RSI is clean here at a middle territory of 44.
Cryptonary's take
So far, price has followed our plan from last Monday, slightly retracing the move up and consolidating in the high $50k's. Over the weekend and in to early next week, we expect more of the same ie, price to be range bound in this tighter range between $56,200 and $61,800. However, we're not ruling out a move in to the $54k area, but we would expect it to be bought up relatively quickly, if it happens.Next week, we have Jackson Hole where FED Chair Powell will speak on policy going forward. He won't deliver any Interest Rate cuts, but he'll likely forward guide them to September's Meeting. We expect Bitcoin to be range-bound until then. We'll then reassess again then following the event.
Whilst we still expect the next 2-6 weeks to be tricky, we don't see Bitcoin hitting sub $50k again, and we do just expect price to be range bound in the large price range we identified in the TA section above. No panic or stresses here, further patience is needed.

BTC dominance at 57%: Will it break out or break down?
14 August 2024Current state: BTC dominance has been moving within a rising wedge on the weekly timeframe for over two years, and it is now approaching the tip of this formation. This is a critical juncture where BTC.D could either break out or break down, significantly influencing the broader market.
Key observations
- Resistance: The wedge's apex coincides with the 57% region, a historically significant level.
- Potential scenario: While BTC.D might rise to the 60% level in the coming days, this level could mark the peak before a breakdown from the wedge. A breakdown would likely result in a flow of capital from BTC into altcoins, initiating a potential alt season.

Conclusion
BTC dominance is at a pivotal point as it nears the apex of a two-year rising wedge. The 57% region is a key resistance to watch, with the possibility of a rise to 60% before an eventual breakdown. If BTC.D does break down, it could trigger a significant shift in capital flows towards altcoins, leading to a strong altcoin rally.$58k support—Is 60k the next move?
13 August 2024Will it rally to 60k or drop? Discover potential outcomes and key areas to watch next.
Bitcoin (BTC)
- Current state: BTC has seen a decent reaction from the 55k region, where we've previously identified strong support. The market zoomed up to 62k, facing rejection precisely at the 50% Fibonacci retracement level of the bullflag. This rejection highlights the significance of the bullflag pattern, and it signals that some exciting upswings could be on the horizon in the coming weeks or months.
- Key observations:
- Base formation: BTC has held onto the 58k region well, forming a solid base here. This could potentially be a local bottom, as the market consolidates around this level.
- Potential scenarios:
- Bullish continuation: If the market moves higher from here, BTC could swing up to 60k, potentially forming a lower high before attempting to retest higher levels.
- Bearish scenario: Should the market face further downside pressure in the coming weeks, we might see BTC retesting the blue box region, which represents the lower end of the bullflag. This area holds particular importance due to the confluence of the 200 EMA on the daily chart, which begins just around here. The 58k level, reinforced by the 200 EMA, is currently providing decent support to BTC.
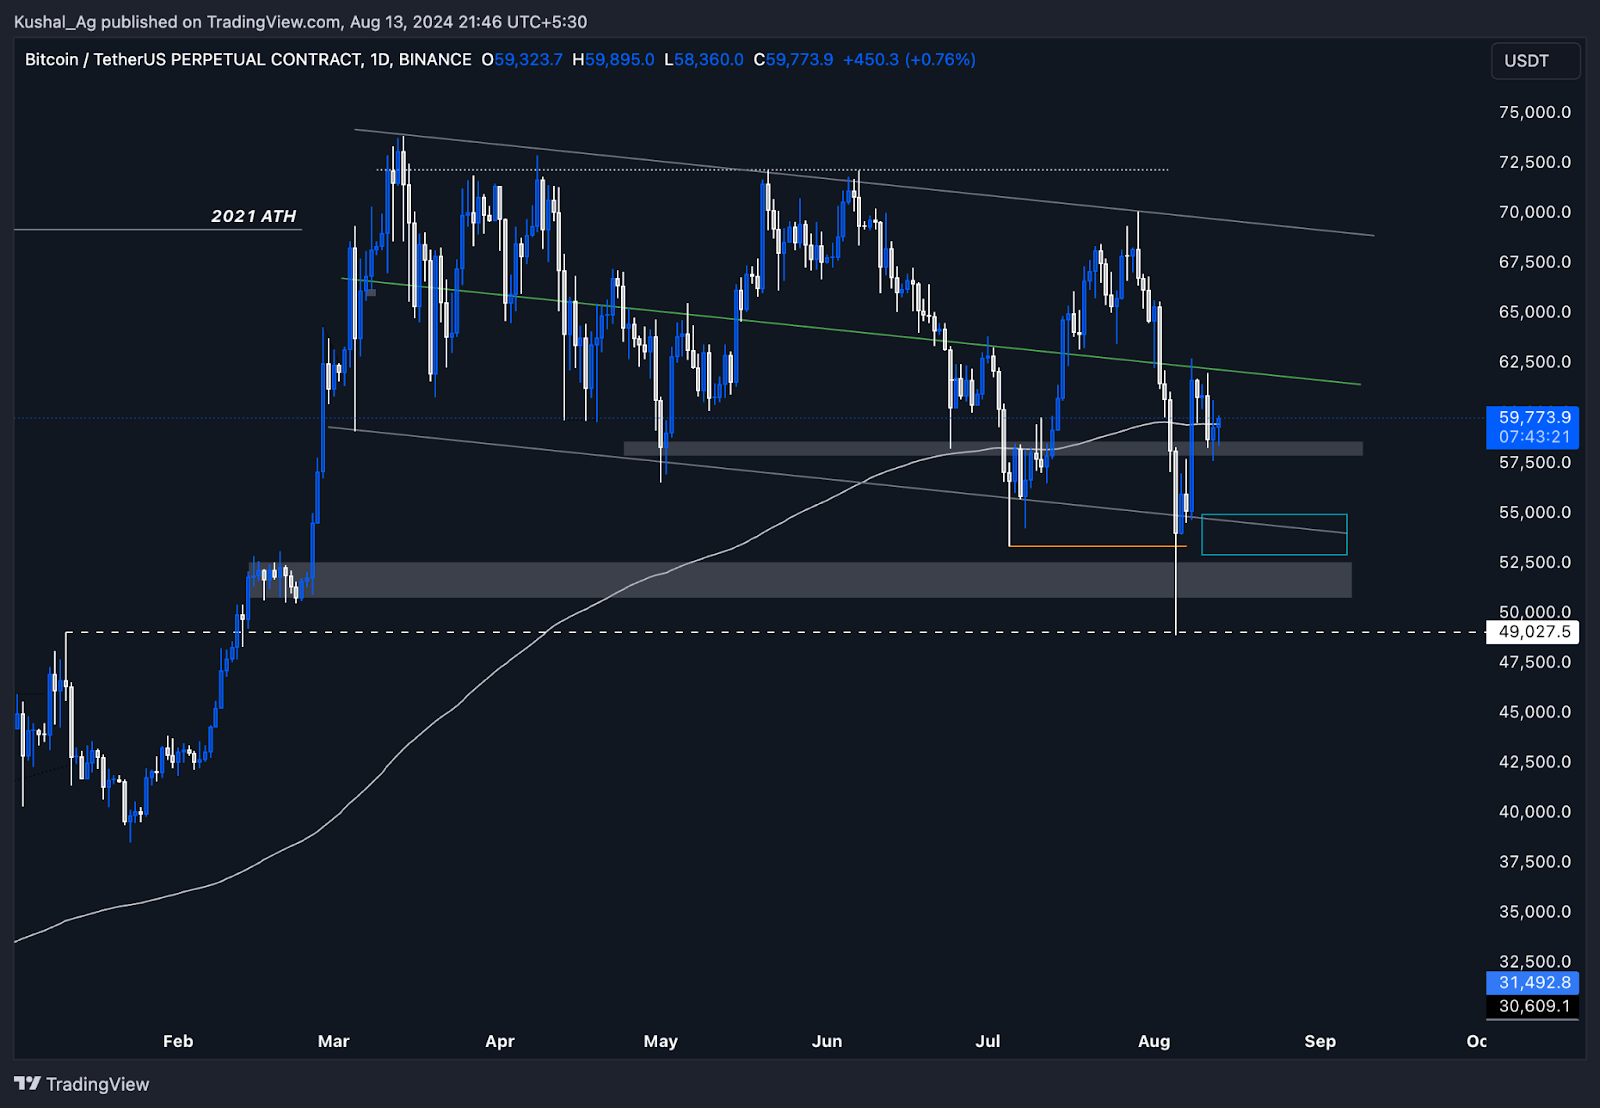
Will it break $60,000?
12 August 2024Our analysis of Bitcoin began with a focus on the weekly chart to understand its broader market context.
Please note: The video above is set to start at the 1 Second mark, featuring an in-depth technical analysis of Bitcoin (BTC).
Bitcoin (BTC)
Our analysis of Bitcoin began with a focus on the weekly chart to understand its broader market context. Over the past 150 days, Bitcoin has been consolidating within a range between $57,000 and $72,000, indicating a lack of momentum to break out decisively in either direction. The recent pullback from $60,000 represents a 17% decline, which is relatively minor within this broader context. We noted that the market's inability to push higher could be due to profit-taking and indecision among traders, especially after a significant pre-cycle expansion.We identified key support levels at $53,600 and $50,906 as potential areas where buying interest might re-emerge. These levels could provide strong buy zones if Bitcoin continues to dip lower or consolidate further. While the short-term outlook appears cautious, we believe that these periods of consolidation are necessary for the market to build the strength needed for a more decisive upward move. Traders should watch for a sustained break above the $60,000 level, which would signal a more bullish continuation.
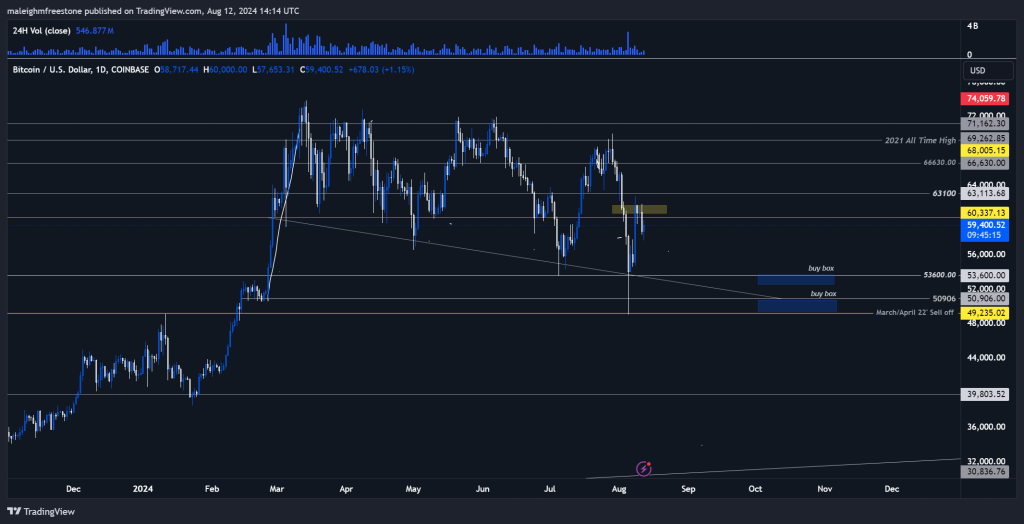
Will it break out of the $58k-$62k range?
12 August 2024Bitcoin's Funding Rate has been choppy over the last few days, moving back and forth from slightly positive to slightly negative.
These are not meaningful swings, but they do reflect the heightened indecision among traders as they flip-flop between Longing and Shorting.
Open Interest is up, just shy of 10% in the last day, but it remains well below the recent highs, indicating that a large amount of the excess leverage has been flushed out.
BTC Open Interest:
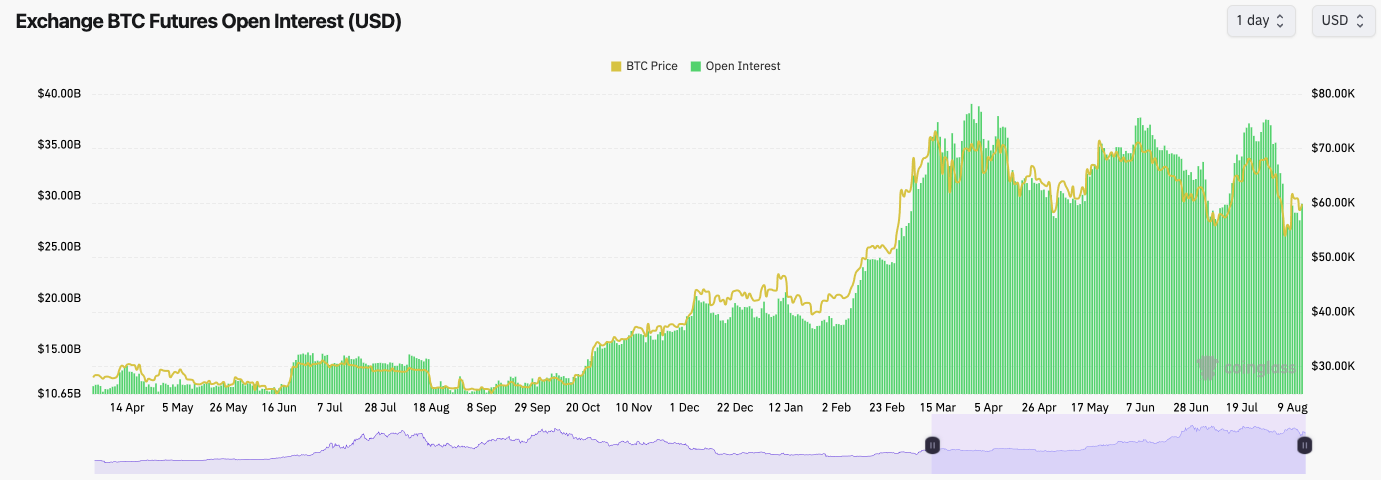
Technical analysis
- Following last week's really strong bounce in price, we did conclude that we expected Bitcoin to have a small retracement to follow it.
- We expected the retracement to reach $56k. However, BTC has bounced (for now) from the local low of $57,700, perfectly following the red arrows we drew out on the chart at the back end of last week.
- The RSI remain in middle territory so this shouldn't be a headwind for price moving in either direction.
- To the upside, the $63,400 level remains the horizontal resistance.
- To the downside, there is a local support at $58k which price bounced from this time. Beyond that the main support is at $52,800.
Cryptonary's take
Bitcoin has bounced well from the $52k support, but price is still suppressed beneath $63,400.With August usually a quiet month, we have seen heightened volatility. However, our expectation is that price remains range-bound over the coming days, maybe even over the next week. We expect price to remain between $58k and $62k. However, it's also possible that the price dips into the $56k to $57k area. If so, we would be buyers of specific altcoins or memes if they hit their price targets on another retest lower.
Ultimately, whilst many of the big traders are on their holidays, we don't expect the markets to do much here unless there's a unique event such as the Iran/Israel bombing. So, remain patient and don't let this market cut you up.
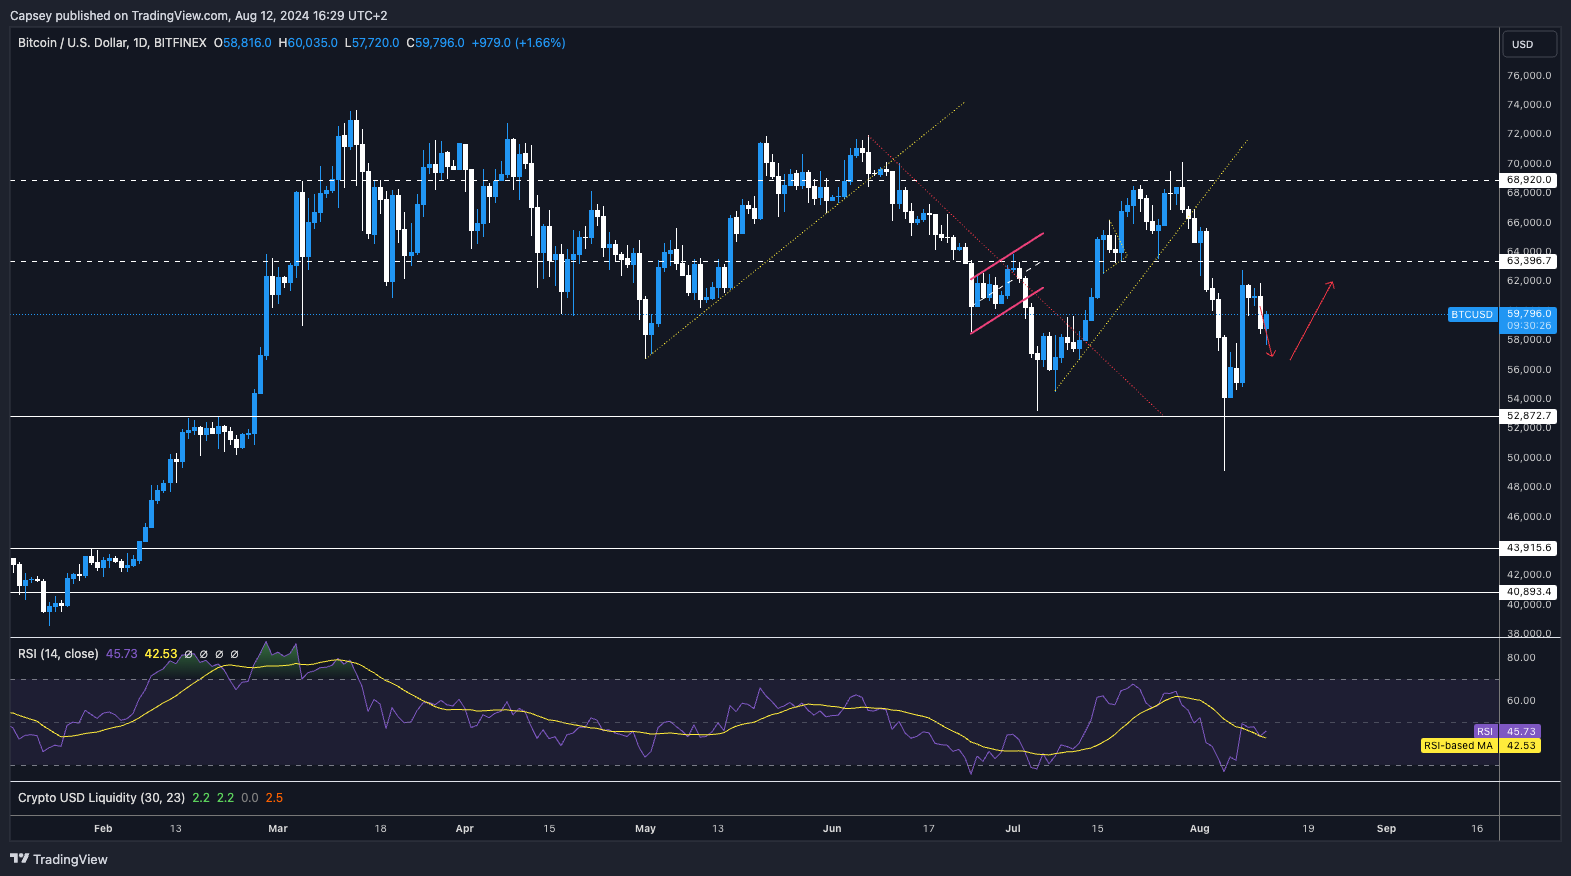
Is $56,500 the buy zone?
09 August 2024In this analysis, we explore Bitcoin's recent movement towards a key liquidation zone and the potential implications for its future price trajectory.
Please note: The video above is set to start at the 00:34 mark, featuring an in-depth technical analysis of Bitcoin (BTC)
Disclaimer: This is not financial or investment advice. You are responsible for any capital-related decisions you make, and only you are accountable for the results.
At the start of the week, we identified a key liquidation zone on Bitcoin's heatmap, suggesting that the market might be drawn towards that price level due to the concentration of liquidation levels.
As anticipated, Bitcoin did approach and tap into this area, which led to the expected price movement. However, we need to emphasise that while such moves are likely, they are never guaranteed. This highlights the importance of using tools like liquidation heatmaps to forecast potential price movements but also underscores the necessity of a cautious and adaptive approach.
From our analysis, the next step for Bitcoin appears to be a gradual downward grind.
We have identified support zones around $56,500 and $50,906 as potential buy boxes, suggesting these levels could provide good entry points if the market continues its downward trajectory. The channel trendlines we've drawn indicate that Bitcoin could potentially revisit its April-March 2022 lows.
However, if Bitcoin can reclaim the $60,000 level and sustain trading above it for several weeks, our bearish outlook may need to be reassessed. For now, we recommend a patient approach, waiting for either a confirmed breakdown or a sustained recovery above key resistance levels before making significant moves.
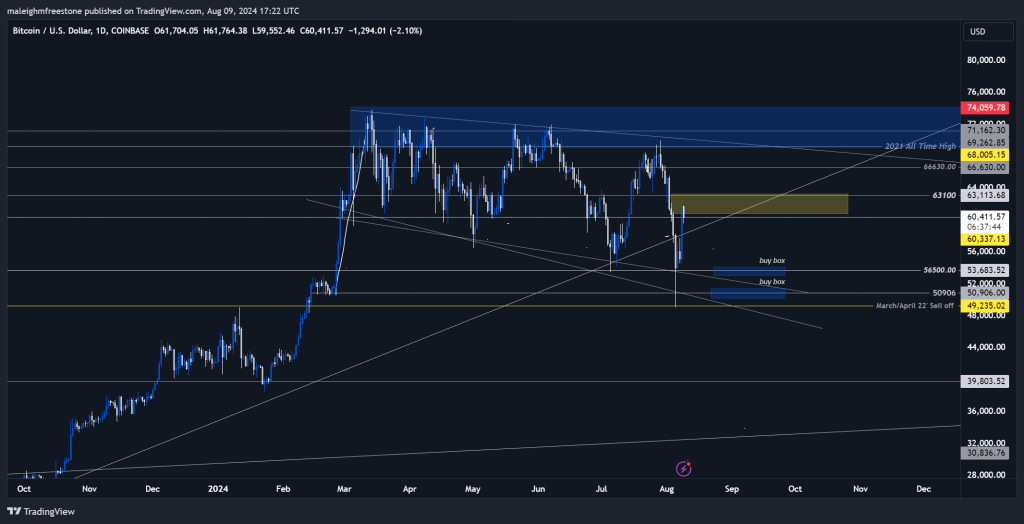
Next move after $59k surge?
09 August 2024- Bitcoin's Funding Rate is now flat between 0.00% and 0.01%, indicating there is a relatively even balance between Longs and Shorts.
- Open Interest has now reset to healthier levels. The recent flush-out was needed. OI has reset from $37.5b to $28.3b.
- Yesterday, Funding Rates went negative, meaning Shorts piled in as price moved up to $59k. This led to a Short-squeeze which then propelled price from $59k to $62k relatively swiftly.
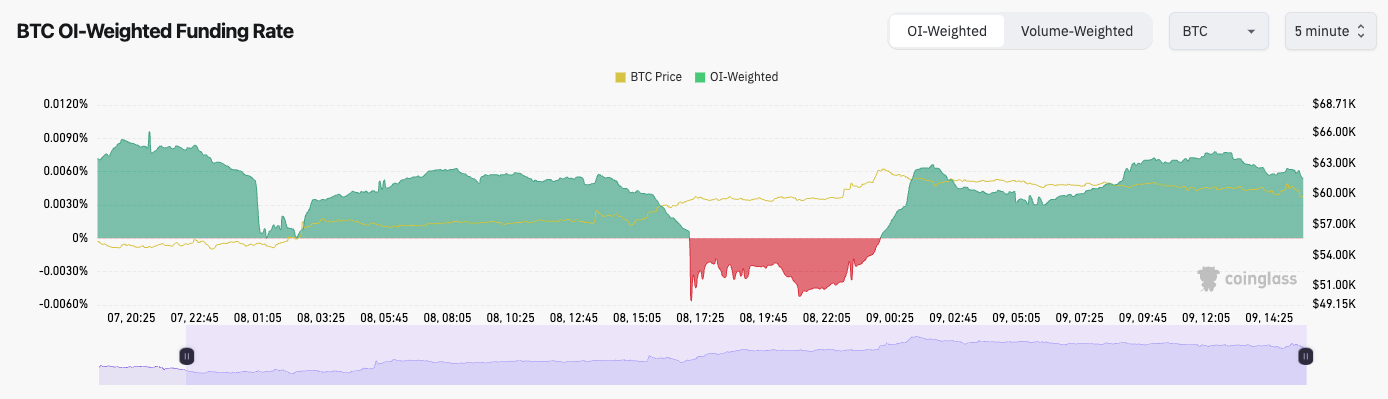
Technical analysis
- Bitcoin bounced superbly from the horizontal support of $52k, although price had wicked substantially lower.
- Our first thought was that Bitcoin might begin to form a bear flag, however, this hasn't been the case, and we've seen somewhat of a V-shape recovery so far.
- We also expected the $58k to $60k level to become new resistance, however, the Short-squeeze pushed price beyond this price zone.
- For now, the prior horizontal support of $63,400 is likely act as the next major horizontal resistance.
- To the downside, we believe $56k can be a support area, even if price does dip slightly below this area.
- The RSI has reset back to neutral territory having been in oversold territory on Monday.
Disclaimer: This is not financial or investment advice. You are responsible for any capital-related decisions you make, and only you are accountable for the results.
Cryptonary's take
Whilst we're impressed by how much Bitcoin has recovered so far, we do expect a slight pullback here, and for price to potentially retest the $54k to $56k area over the coming 2-4 days. We believe Bitcoin can be more range bound and we're not expecting any explosive moves past say $63,400 in the near-term, at least not until Powell speaks at Jackson Hole in a few weeks time (Aug 22nd - 24th).
Is 15% bounce to $58k real?
08 August 2024In this article, we provide a comprehensive technical analysis of the current Bitcoin market trends.
Please note: The video above is set to start at the 00:10 minute mark, featuring an in-depth technical analysis of Bitcoin (BTC).
In our latest technical analysis, we observed a relief bounce in the Bitcoin market, but we remain cautious about overly optimistic outlooks. The market has experienced a substantial downside move, reflecting the prevalent bearish sentiment. While this bounce, approximately 15%, offers a promising recovery, it's essential to contextualise it within the larger market framework.
Disclaimer: This is not financial or investment advice. You are responsible for any capital-related decisions you make, and only you are accountable for the results.
Bitcoin has shown some resilience on the four-hour timeframe, but we need to be wary of potential short-term corrections. The significant liquidation levels around $58,000 suggest increased shorting activity, which may influence upcoming price movements. As we approach key resistance levels, monitoring these areas for potential rejection or consolidation is crucial.
Educational insight: Open interest and liquidation levels are critical to assessing market sentiment and potential price movements. High open interest often correlates with increased market optimism, while significant liquidation levels can trigger sharp corrections. We can better anticipate market behaviour and make informed trading decisions by understanding these dynamics. In the current context, patience and strategic positioning are essential as we navigate this volatile environment.
Will It bounce back 20%?
7 August 2024In the past few weeks, Bitcoin's Open Interest has significantly increased but saw a sharp decline after a recent price drop, indicating a substantial de-leveraging of 26% over six days, potentially resetting the leverage market to a healthier state.
- In the last few weeks, Open Interest (the amount of leverage put on by traders) has ramped up significantly. However, yesterday’s price drop caused this Open Interest to drop significantly.
- In the last 6 days alone, OI has decreased by 26%. This is a substantial de-leveraging.
- This flushing out may be enough. Positioning has been more meaningfully reset, resulting in a healthier leverage market.
- The Funding Rate is 0.004%, which is flat, suggesting that positioning (between Longs and Shorts) is relatively even here.
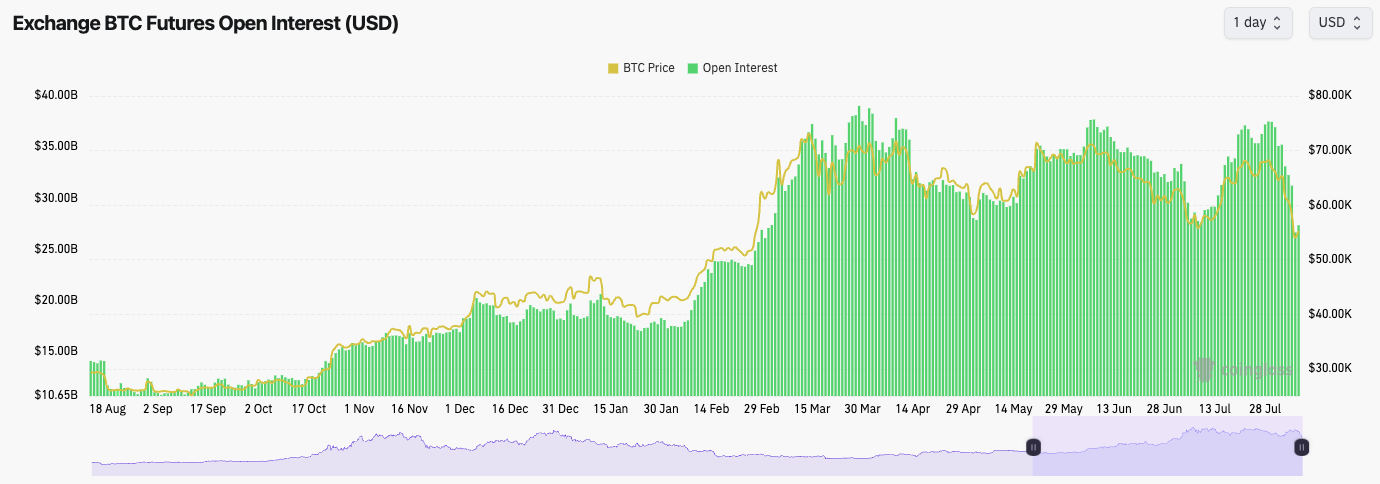
Technical analysis
- Once again, the main horizontal resistance at $68,900 proved too strong of a resistance, and price broke down from that level.
- Price then broke below the local uptrend line, but tried to bounce from the horizontal support of $63,400. Once that level was lost, price capitulated.
- Price then fell below the $52,800 horizontal support, driven by a cascade of selling and liquidations. However, it was able to close back above $52k.
- Price is very oversold here, so this might help price to get a bit more of a bid and potentially move slightly higher.
- In the short term, while confidence is lower, we’re expecting a potential bear flag pattern to form, similar to the one that formed in late June (purple channels). We do need more days of data to confirm this, though.
- $60k is likely to now act as a new psychological resistance in the short and maybe even medium term.
Cryptonary’s take
There are some positives and negatives here. The positives are that Bitcoin is very oversold, and positioning and leverage have been majorly reset. It is important to have these cleansing events in markets, and overall, it’s good.The negatives are that this move and the macro outlook (does the Yen carry trade continue to unwind?) in the short term will likely reduce risk appetite, which may mean that it takes more time for Bitcoin to rally substantially higher.
Ultimately, we expect the market to be more range-bound in the coming weeks but in this new, lower range between $52k and $58k. It’s then possible that if the bear flag formation does form, BTC breaks down and retests $48k to $50k, which puts in a bullish divergence on the RSI and we begin a more substantial move up from there. This may take a few weeks to play out.
We would consider the $48k to $50k area a very good long-term buying opportunity for Bitcoin.

Bitcoin bull run and price predictions: New highs coming next month?
29 July 2024Bitcoin is knocking on the door of history with a tantalizing dance around all-time highs. But here's the kicker - we're seeing record-breaking open interest without the usual funding rate spike. What does this unusual setup mean for BTC's trajectory?
Market mechanics
Open Interest has spiked up to a new all-time high, just shy of $40.0b. This indicates that traders have piled on a lot of leverage in the last few weeks.The Funding Rate is relatively steady at the even rate of 0.01%. This suggests that the majority of traders are Long, but there is also some Short interest from traders.
Typically, when we've seen Open Interest spike higher, we also see the Funding Rate spike higher (a Long bias), but now we don't have that. This is a slightly healthier setup.
Disclaimer: This is not financial or investment advice. You are responsible for any capital-related decisions you make, and only you are accountable for the results. "One Glance" by Cryptonary sometimes uses the RR trading tool to help you quickly understand our analysis. These are not signals, and they are not financial advice.
BTC Open Interest:
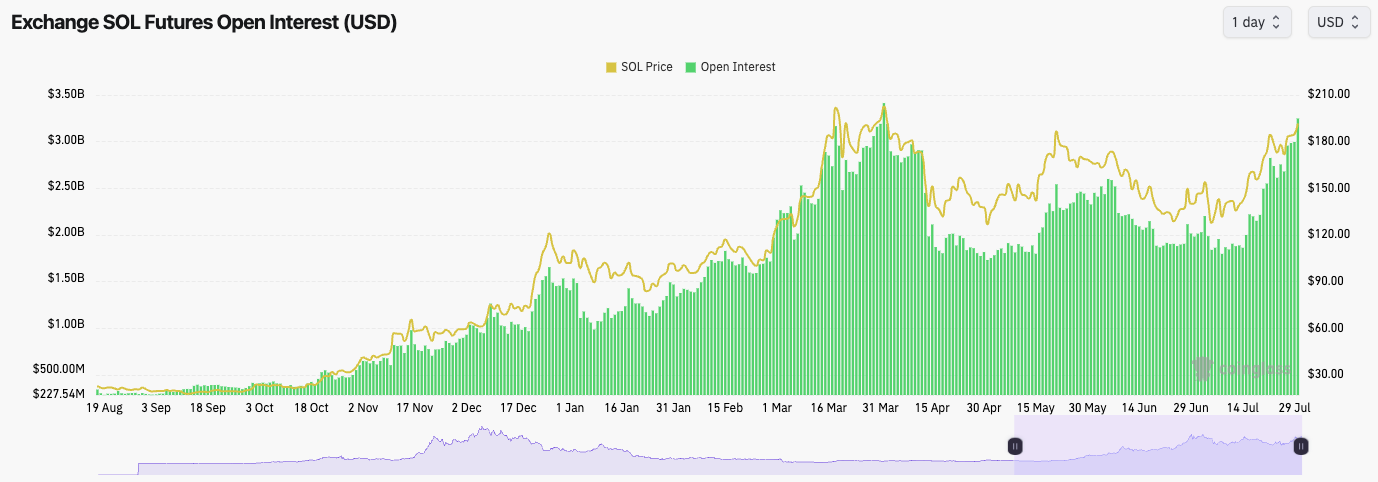
Technical analysis
- Bitcoin continues in its local uptrend, having bounced off of the local support of $63,400 several times now.
- Bitcoin has then progressed higher, and we expect some short-term stalling out of the move at the major resistance of $68,900. However, the price seems to have cleared above this level. Today's candle closure will be important.
- If Bitcoin can move higher, the main level for the price to clear above is $71,700.
- To the downside, we'd expect $63,400 to hold as support, although we wouldn't be surprised to see this level not revisited.
- On the Daily timeframe, the price is moving into overbought territory, so it is possible we will see a slowdown soon.
Cryptonary's take
This week, we have big macro data: labour market data, the Fed Meeting, and corporate Earnings. This can create volatility in markets, and with Bitcoin's Open Interest (amount of leverage) as high as it is, we could see volatility further exaggerated. This may open the door to downside flushes in price.However, we believe that once you sieve through the noise (of this week), we expect prices to continue grinding higher.
We wouldn't be surprised to see new Bitcoin price all-time highs in August, and we believe this might be catalysed by a dovish J Powell (Fed Chairman), who forward guides the market on Wednesday that the Fed is looking to begin cutting Interest Rates in September.
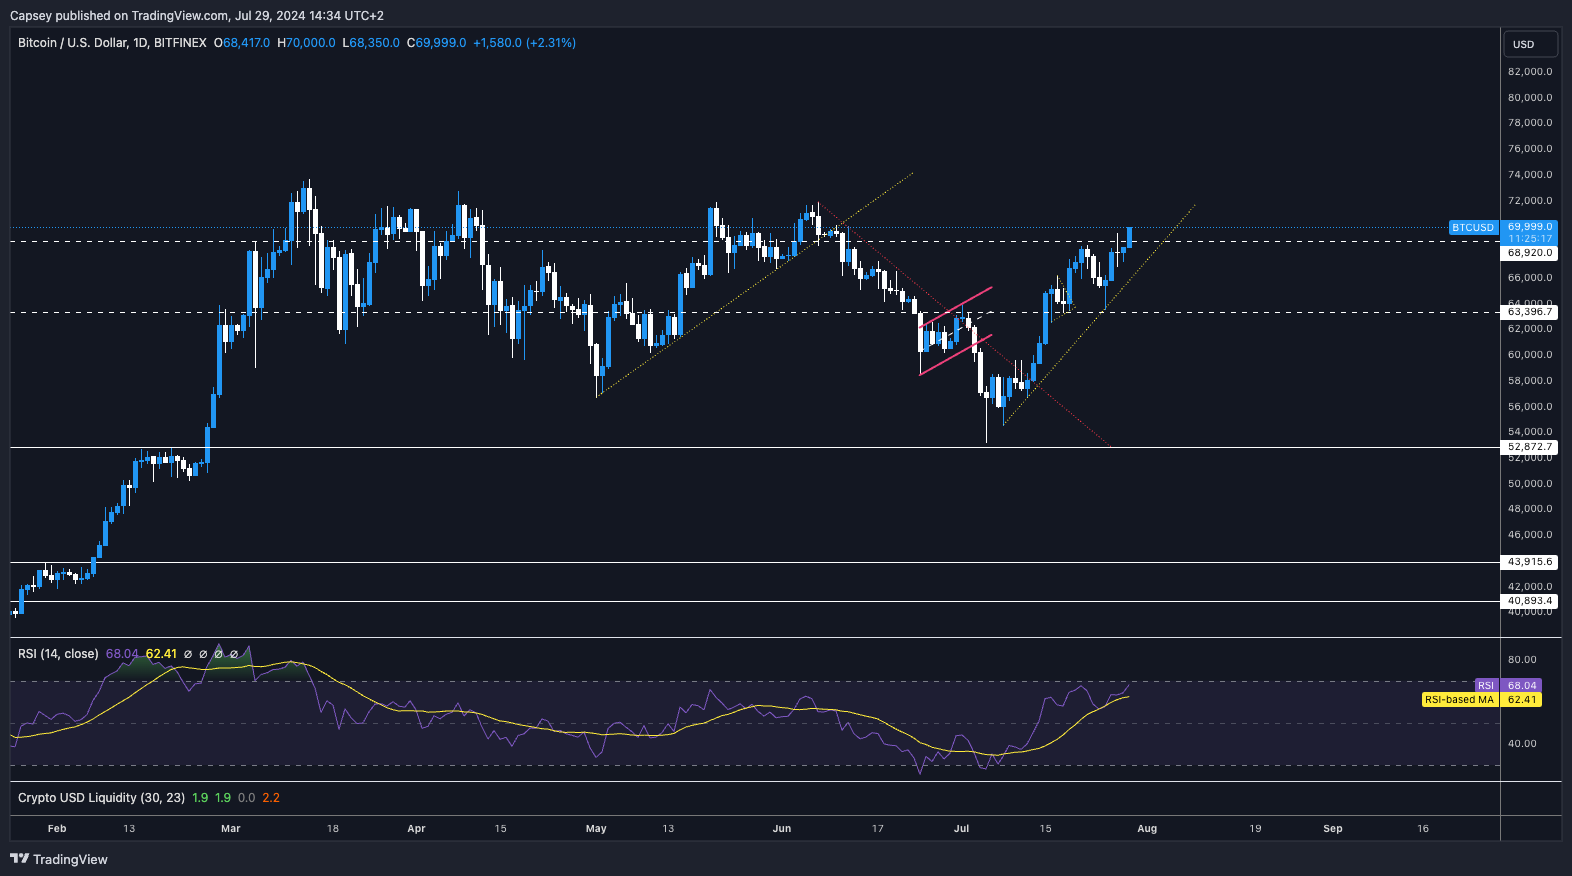
BTC open interest near highs: Can Bitcoin hold above $63.4k support level
24 July 2024Market mechanics
In the last few days, Bitcoin's Open Interest (amount of leverage) has returned to the highs we saw in early June and late March. On each of these occasions, the excess leverage was flushed out due to a sharp move down in price. Longs being liquidated.However, this time, the Funding Rate is positive, but it's close to flat. This means that in this leverage build-up, a substantial number of Shorts are built up. This opens the door to a further Short Squeeze, although now less likely due to the price being down 3% from its local highs.
Over the coming days (1-7 days), we should expect a more volatile move that will likely wipe out the Open Interest.
BTC Open Interest:
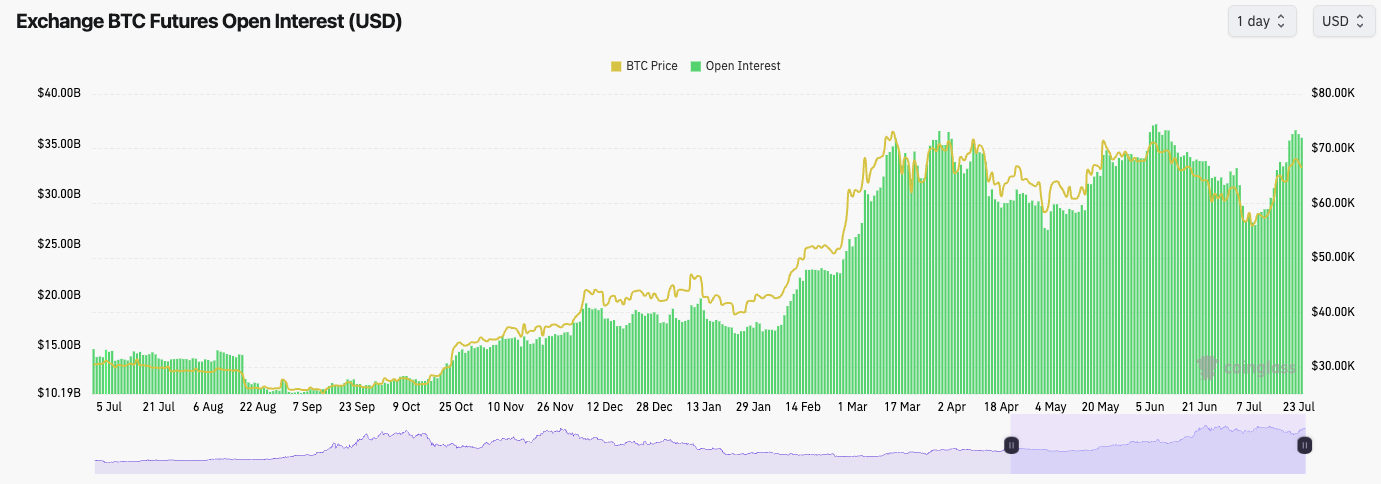
Technical analysis
- Price has found some resistance at the horizontal level of $68,900, having risen tremendously following the breakout of the downtrend line.
- The key levels to the upside for the price to break out from are $68,900 and $71,500.
- If the price were to break down in the short term, we would expect the $63,400 horizontal level to hold as support. Local support is also at $65,000.
- As BTC approached the late $68,000s, the RSI approached very close to overbought territory.
- If the price dropped to $63,400 and bounced, that would begin the formation of a Head-and-Shoulders pattern (a bearish pattern). We will need to keep a close eye on this.
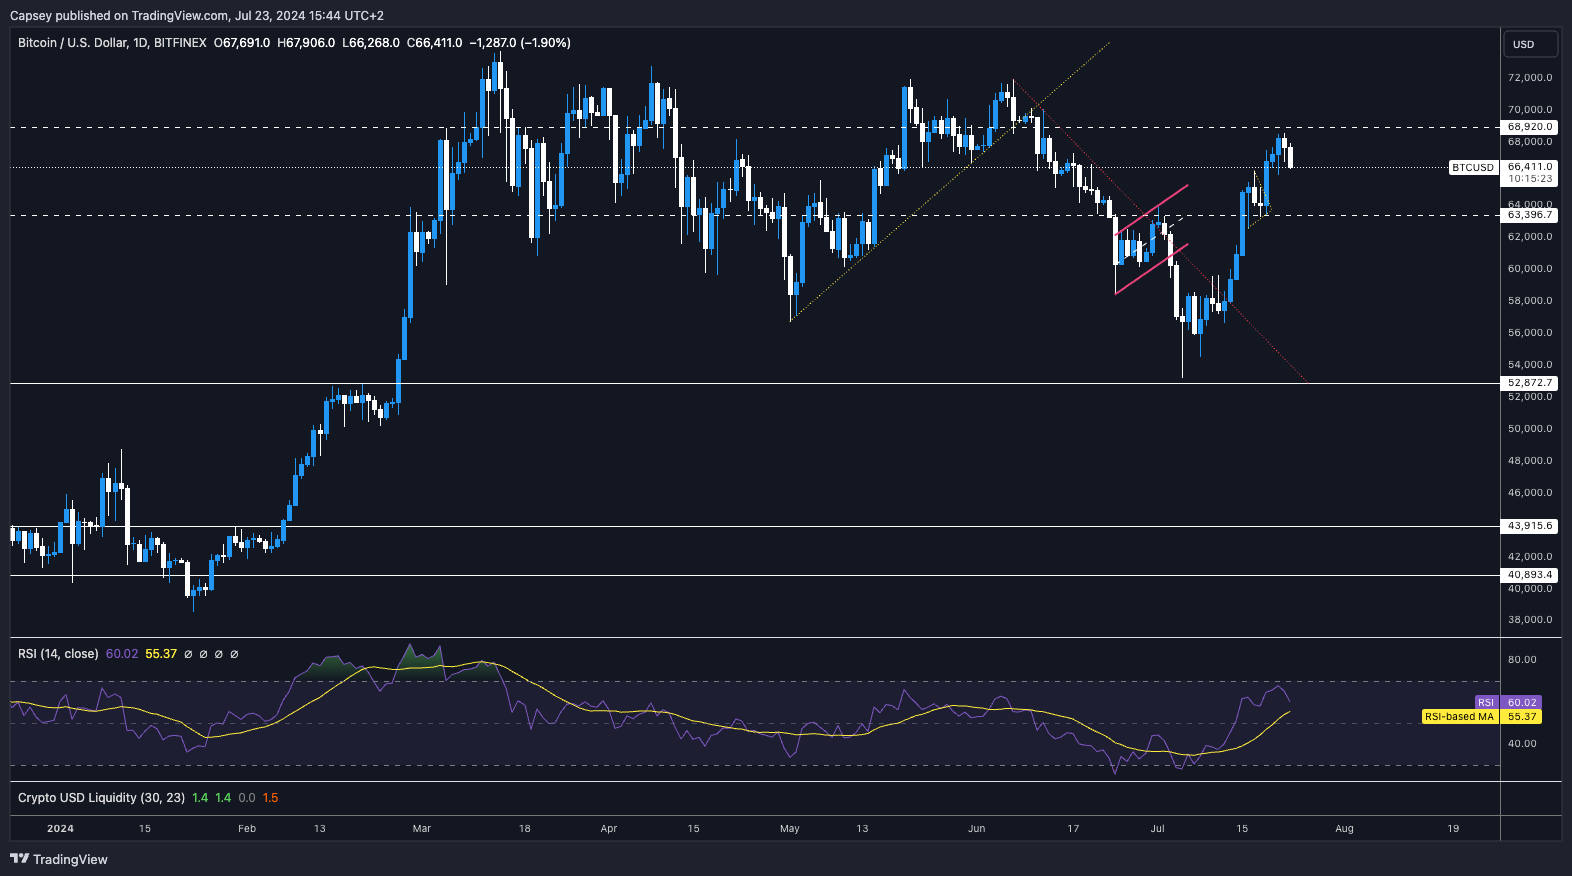
Cryptonary's take
The amount of leverage that has built up is now at the higher levels we've seen over the last few months, resulting in a price pullback.Now, the setup this time is different because not all the added leverage (Open Interest) is Longs, but the chances are that we get a slight flush out, which likely see the price come down a tad.
If $65,000 can be held, fantastic, but we'd be open to this next move, potentially pulling back to the horizontal support of $63,400. If $63,400 is broken to the downside, then essentially, we'd have seen a lower high put-in, and Bitcoin would no longer hold a bullish structure. This could then lead to a move back to $60,000. However, this would still be within Bitcoin's macro range.
Ultimately, we believe $63,400 is enough of a support, that if it is retested, BTC can hold above this level and then grind on higher from there.
So, we expect a slight pullback in the coming days, and then we believe that Bitcoin can recover from the weekend. Let's see.
On BTC, for now, we wait
12 Jan 2024Want to BTC post-ETF? Let's get into it.
From a mechanics perspective, there are few major liquidation levels to watch out for, which is usually a good sign - see chart below.
Strong yellow/green colours indicate large liquidation levels.
However, alongside this, Open Interest is up massively after yesterday's new highs. Fortunately, the Funding Rate has stayed relatively flat, meaning there is a lot of leverage, but not in any particular direction.
Technical analysis
- Price finally broke out of the $40,900 to $44,000 range it had been in for the past month.
- There is a local resistance at $47,100.
- Price will need to hold the horizontal support of $44k if it wants further upside. If not, $40,900 is probably the first downside target.
- The RSI on the 12hr and 1D have reset relatively well. However, the 3D and the Weekly remain overbought. Likely, a further reset is needed. However, this can be through a consolidation period rather than a major pullback. Keep that in mind.
Cryptonary's take
The trading activity from today and early next week will be crucial for BTC – we'll get a greater idea of what the ETF flows actually are.At a minimum, price will need to remain range-bound between $44k and $47k.
We’d expect price to grind higher over the next week for continued bullish momentum and to show underlying buying of the ETFs.
If price doesn't move higher, then we'd expect a more significant downside, particularly as some of the on-chain metrics are now beginning to turn, suggesting this may be a local top for the price.
Let's wait and see what the next few days bring!
It is hard to call where BTC goes from here
15 December 2023Following the FOMC (FED Press Conference) on Wednesday, risk assets have ripped, and this has helped BTC move higher from the low $41ks that we were at earlier in the day on Wednesday.
The mechanics for BTC have reset slightly regarding the Open Interest, which is good.
Less leverage swashing around is always more positive.
We are beginning to see the Funding Rate ramp up slightly today, although it is not at high levels - currently at 0.015%. There are more Longs than Shorts, but there is no current imbalance. So, it's all good from a mechanics perspective.
Technical analysis
- The bearish pennant didn't see a continuation of the pattern; in fact, price broke to the upside, helped by Powell's dovish pivot, sending risk assets higher.
- The main horizontal resistance above price is $44,000.
- Beneath price, the horizontal support sits at $40,900, which also converges with the uptrend line's support. If these converging supports are lost, this may open the door for further downside for BTC to potentially $38k.
- The RSI has reset on the 12hr and the Daily timeframes. It remains overbought on the 3D and the Weekly, although it is coming down. In the coming months, we will likely see more consolidation for these metrics to reset more.
Cryptonary's take
Hard to call here for BTC, and even though we're constructive and positive on the market as a whole, we do see BTC pulling back and consolidating for some time. It's possible that in the short term, we will see a move up to $44k. If $44k is broken, the local high will be higher and can pop to $46k.But ultimately, we think BTC's local high of $44k is within 5% of its local high before we see further price pullbacks and periods of consolidation in Q1 of next year.
Remember, there are 4-5 months until the next halving; it won't be up only from here, particularly with the meme season we're currently in.
We likely see another week or so of meme season. We would be more cautious here rather than looking to add to positions aggressively.
We believe the time will come to add considerably to current positions, but we see that being in Q1 of 2024.
TC lost steam at $44K: What next?
07 December 2023BTC has pulled back from $44k; the next local support is $42,300.
OI remains high at $19.80b, down from $20.22b, but Funding is increasing – Longs are increasing against Shorts.
There is potential for a bounce before more downside.
TLDR
- Bitcoin has pulled back after failing to break $45k resistance.
- Key support is at $42.3k; losing this could trigger a deeper correction.
- Leverage remains high, which poses a downside risk.
- There is upside potential if the bull flag pattern plays out with a break above $45.6k.
Disclaimer: Not financial or investment advice. You are responsible for any capital-related decisions you make, and only you are accountable for the results. “One Glance” by Cryptonary sometimes uses the RR trading tool to help you quickly understand our analysis. They are not signals, and they are not financial advice.
Macro analysis
• ADP Employment Change came out at 103k, still positive but slightly below the 130k consensus. The main labour market data is out tomorrow (Friday).• The DXY continues to push beyond $104, while the S&P looks increasingly top-heavy.
Technical analysis
• BTC has retraced from its local high of $44k, but it’s now potentially forming a bull flag.•The local support is $42,300, with the most major horizontal resistance at $45,600.
• A breakout of the bull flag would likely send price to $45,600.
• The RSI is overbought on all major timeframes, particularly the 3D and the Weekly.
• We see BTC’s move up as needing some form of more significant pullback. However, the current structure is bullish.
• We wouldn’t look to add BTC here or sell/short it.
Market mechanics
• The Open Interest has moved down slightly from its yearly high of $20.22 billion to $19.80 billion now.• The OI-Weighted Funding Rate has reset over the past few days back closer to 0.01% levels. However, this morning, it began to increase to 0.013%. This isn’t something that should concern us. However, if it continues to ramp up, this would concern us.
Cryptonary’s take
Bitcoin still maintains higher price levels and forms a bullish structure with a bull flag.The local support of $42,300 will need to hold to maintain the bullish structure. If not, we will likely see a deeper pullback over the coming week or so to the mid $38Ks.
The mechanics show that there is still a fair amount of leverage in the system, but Longs and Shorts are in a more even balance now.
We’re not looking to add BTC at these higher levels. However, we would begin to lightly DCA into BTC at $38k. If we see sub $38k, that’s where our DCA buys will become more aggressive.
BTC stuck between $35k and $38k - Which way will it break out?
21 November 2023Bitcoin stands at a precipice, knocking at the door of the $38,000 resistance level. After multiple rejections from this level recently, both bulls and bears hold their breath to see whether support will finally break and which way BTC's volatile price will go next.
TLDR
- BTC stuck between $35K and $38K support and resistance.
- Technicals show Bitcoin keeps rejecting from the $38K level.
- Market mechanics are now healthier - longs and shorts are more balanced.
- The overall direction is difficult to predict until a clear break-up or down.
Disclaimer: Not financial or investment advice. You are responsible for any capital-related decisions you make, and only you are accountable for the results. “One Glance” by Cryptonary sometimes uses the RR trading tool to help you quickly understand our analysis. They are not signals, and they are not financial advice.
Macro analysis
- The Dollar Index continues its decline, now down 2.2% over the past six trading days. A declining Dollar is supportive of risk assets. However, the DXY is approaching oversold levels; therefore, a relief rally may be on the near-term horizon.
- Yesterday’s U.S. 20Y bond auction was positive. There was strong demand from investors, which saw the yield at 4.78%, below the when-issued yield of 4.79%. Additionally, primary dealers (who buy up the remaining supply) only had to buy 9.5% of the supply, far less than prior auctions.
- Later today, we have the release of the FOMC Minutes. The market doesn’t expect much from this. However, financial conditions have loosened significantly since this meeting, so if there is talk about policy needing to be tighter, the markets may react negatively if financial conditions ease. We see this as unlikely and expect the FOMC Minutes today to be a non-event.
Technical analysis
After another retest of the $37,700 to $38,000 zone yesterday and rejecting, can $BTC finally break the resistance level and move higher?- Bitcoin tested the $37,700 to $38,000 range yesterday and today and hasn’t been able to close in or above the zone.
- Bitcoin maintains its local uptrend, which should support higher prices until that trend is broken.
- Price remains in the range between $35,600 to $38,000.
- The RSI on the 12hr and 1D timeframes are both well out of overbought territory, having reset substantially. This gives Bitcoin the room to potentially go higher in the short term as it is no longer exhausted to the upside on the smaller timeframes.
- The 3D and weekly timeframes remain in overbought territory, with the 3D timeframe putting a bearish divergence on yesterday’s candle closure. Usually, it is not positive for higher prices. This makes us more wary of whether Bitcoin can gain enough momentum to break the $38,000 horizontal resistance.
Market mechanics
The mechanics are relatively positive here:- The OI-weighted funding rate is still positive but has reset substantially to now 0.0086%. This indicates that longs and shorts are now in a more even balance, with a slight bias to Long.
- The long/short Ratio is at 0.9712, indicating that over the past 24 hours, more participants have shorted rather than longed.
- The open interest still remains high.
Cryptonary’s take
The technicals for Bitcoin suggest that price is knocking on the door of potentially breaking above $38,000. However, we have had several rejections on the smaller timeframes from the resistance zone.The mechanics are now presenting a far healthier setup compared to prior weeks. Despite Open interest still being high, we’re seeing longs and shorts be in closer balance, meaning neither side is the crowded trade.
It’s likely that if price moves meaningfully in one direction, then the move may spiral quickly in that chosen direction. This may wipe out a significant portion of the open interest upon this move. We expect a volatile move if the range breaks ($35,600 or $38,000).
Bitcoin is difficult to call here. If we had to choose, we’d suggest that there may be a lower break than a higher break of $38,000. But again, this is very difficult to call, so we will wait for a break of the support ($35,600) or resistance ($38,000).
For now, the risk/reward of a short-term trade isn’t good. We, therefore, remain sat on the sides and will look to DCA into Bitcoin if there is a move to $34,000. If there is a move to sub $33,300, we’ll become aggressive DCA buyers down to $31,000.
BTC retakes $36k as markets bet on soft landing for U.S. economy
15 November 2023The mood has shifted dramatically for bitcoin bulls.
Yesterday's better-than-expected inflation print sparked a rally across risk assets as markets. The nascent reflation trade has lit a fire under Bitcoin, which is primed for a retest of $38k resistance after leveraged longs were flushed out.
With technicals and mechanics aligning, BTC is set to resume its upside breakout. So, where’s the crypto market headed? Let’s find out.
TLDR
- Inflation data beat expectations, boosting hopes of less aggressive Fed rate hikes.
- Markets are now betting on the soft landing scenario and earlier rate cuts.
- BTC leveraged longs flushed out, allowing room for an upside move.
- Technicals and mechanics align for a retest of $38k resistance.
Disclaimer: Not financial or investment advice. You are responsible for any capital-related decisions you make, and only you are accountable for the results. “One Glance” by Cryptonary sometimes uses the RR trading tool to help you quickly understand our analysis. They are not signals, and they are not financial advice.
Macro analysis
Yesterday, the inflation data came in below expectations. In response, the markets rallied to celebrate the Fed rate hike cycle being over. The market is also happy that inflation is proving less sticky than initially imagined.Following this, rate cuts were priced in earlier than originally. This is the market calling for a soft/no landing scenario for the U.S. economy. Hence, we saw assets higher yesterday. If you include today's pre-market price action, the S&P and the Nasdaq were up 2%, with the Dollar Index down a whopping 1.44%.
Overall, this is a risk-on environment, and although crypto pulled back yesterday - as we flushed out a lot of the excess leverage - the market looks good here.
Let’s now dive into the technicals for BTC.
Technical analysis
As expected, yesterday brought us that leverage flush out that saw prices pull back. Despite prices flushing out into the $35,000 level, price was able to move higher, reclaim the local support of $35,600, and close above that level. The upside resistance remains at $38,000.When looking at the RSI, the 3D and the weekly timeframes remain overbought, suggesting there could be a further pullback. However, we have also seen, in the past, that the major timeframes can stay overbought for long periods, particularly in bull markets. Nonetheless, the daily timeframe has pulled back and reset somewhat, now at 65.
All the above is positive and suggests price can have another move higher and potentially test $38,000.
Let’s assess the technicals first to see if they support this.
Market mechanics
This is exactly what we were looking for when looking at the mechanics. The funding rate has come down meaningfully and now sits at 0.0087%. There’s still a long bias, but longs and shorts are now more balanced.The open interest dropped from $16.5B yesterday to $15.7B today. This is a small decrease, likely due to some longs having been flushed out on yesterday’s move lower.
If we then look at the long/short ratio, it’s 0.932 over the past 24 hours. This suggests that more participants have piled into shorts in the past 24 hours. This is another factor that has brought the funding rate down.
SOL had a similar setup yesterday, and we’ve seen that drive 15% or so higher since. So, it's possible that the mechanics here are actually favourable towards longs, and we could see prices push higher for BTC here, potentially retesting the early $37,000s.
Cryptonary’s take
The technicals and the mechanics suggest BTC could move higher here and potentially retest the $37,000s and even try for another retest of the $38,000 horizontal resistance.In terms of DCA’ing, we will continue to wait to see how price reacts here, if it can retest $38,000, and then how price reacts if it gets to that level before we consider taking further action.
BTC pulls back from $38K resistance – What’s next?
14 November 2023After rocketing up over the past week to test the major resistance zone around $38,000, Bitcoin has stalled and pulled back slightly, trading between support at $35,600 and resistance at $38,000. Today's inflation data poses a risk for BTC if it comes in hotter than the consensus forecast of 3.3% year-over-year. But when will Bitcoin garner enough momentum for a breakout above $38,000?
TLDR
- Bitcoin pulled back after testing the $38K resistance level.
- Inflation data today poses a risk if it comes in hotter than the 3.3% forecast.
- BTC is now trading rangebound between $35.6K support and $38K resistance.
- The rangebound action will likely continue until we get the ETF approval.
Disclaimer: Not financial or investment advice. You are responsible for any capital-related decisions you make, and only you are accountable for the results. “One Glance” by Cryptonary sometimes uses the RR trading tool to help you quickly understand our analysis. They are not signals, and they are not financial advice.
Macro analysis
The focus of today is the inflation data. There is a strong consensus among traders that Inflation is expected to come in at 3.3% YoY. The market has priced it in and fully expects a soft inflation print. Therefore, the risk here is if the data comes in hotter, this would be a downside risk to risk assets that could result in a more meaningful pullback.However, the consensus is that we do get a soft print.
Let’s now dive into the technicals for BTC.
Technical analysis
The strong resistance of $38,000 we outlined has acted as a rejection level for BTC price. We’ve now seen a slight pullback, which, to be honest, we’ve needed, considering how strong the overall move-up has been.In the short term, we feel price will play in the tight range price between the horizontal resistance of $38,000 and the local support of $35,600.
Looking at the RSI, this small move lower for price has brought the RSI down slightly, which again is likely needed considering the move higher. However, we remain in overbought territory on all major timeframes. Therefore, it’s possible we could see more downside in the short term as some of these key indicators need to reset.
Market mechanics
For the mechanics, we’re seeing some slight improvements. Despite the high OI-Weighted funding rate (at 0.0155%), it has come down from 0.0323% over the last 24 hours, so there isn’t this excess of longs like there was a day ago.If we then turn to the open interest, that has also decreased slightly. It remains very high but has come down over the past 24 hours.
What this picture suggests as a whole is that there’s still a lot of leverage, but there isn’t this huge bias to be long. In the last 24 hours, we’ve seen that shorts have built up, and this morning’s slight move higher potentially shook out some late shorts. Still, essentially, the derivatives market is in a healthier spot here despite the fact we feel the level of open interest needs to come down slightly more to flush out some of that remaining excess (in terms of leveraged positions).
Cryptonary’s take
The risk for risk assets today is that inflation comes in slightly hotter, and risk assets (which Bitcoin is) turn lower on this. However, expectations are for a headline print of 3.3%.The derivatives market has cooled off slightly but remains relatively overheated despite longs and shorts coming more into balance.
From assessing all the above, price may continue lower and test the $35,600 level. To get a break above $38,000, we’ll likely need the SEC to approve the ETF applications, but we believe this doesn’t come this week. Bitcoin will likely remain in this tight range between $35,600 and $38,000. Let’s reassess once Bitcoin comes into one of these levels.
We will remain strong DCA buyers of BTC sub $34,000, and we will be aggressive buyers of BTC sub $32,000
Boring BTC, is a breakout imminent?
01 November 2023Bitcoin bulls and bears are currently in a standoff.
The charts have shown a relatively stable pattern, giving off an air of predictability. It's almost as if BTC has become "boring" for some observers. However, beneath this quiet calm lies the potential for a major breakout, and the question on everyone's mind is, "Is a breakout imminent?"
Let’s unpack the tension in the market.
TLDR
- Bitcoin remains within a bull pennant, with a bias for an upside breakout.
- RSI is in overbought territory but showing signs of resetting.
- Positive funding rates and high Open Interest suggest a Long bias.
- The technical structure supports another upward move, potentially targeting $37,700.
Disclaimer: Not financial or investment advice. You are responsible for any capital-related decisions you make, and only you are accountable for the results. “One Glance” by Cryptonary sometimes uses the RR trading tool to help you quickly understand our analysis. They are not signals, and they are not financial advice.
Technical analysis
For several days now, there have not been too many changes in terms of technical setups. We remain in the bull pennant (with a bias to break to the upside) while battling at the horizontal resistance of $34,500.Recently, BTC has traded without much correlation to risk assets (the S&P). However, we saw in the past few days that BTC has been somewhat more guided and correlated to the S&P. It is important to continue watching and assessing this to see if the correlation increases. If it does, BTC may return to trading as a risk asset rather than a safe haven asset. This is key going forward.
RSI and funding rates
The RSI is still in overbought territory. But while BTC continues in this tight range, we’re seeing the RSI reset somewhat. This reset is despite the fact it’s still high and in overbought territory.The funding rates remain positive while open interest is still high. So, there is somewhat of a decent amount of leverage being taken out here, and the bias is to be Long. For now, this is not something that should concern us. However, if both increase further, this should make us more cautious about further upside moves.
Cryptonary’s take
The technical structure for BTC is still bullish here, and price continues in the formation. The structure suggests another break higher for BTC to get into the $37,700 area. If this area is reached, we may begin to see some profit-taking with investors then likely to re-add BTC in the low $30k’s again - somewhere between $31,000 to $33,000.Action
-
- We think BTC still has another leg higher here before a more meaningful retest lower in the coming weeks/months (before year-end). However, we must be wary of a possible Spot BTC ETF being approved. Yes, this is somewhat priced in, but we suggest being positioned in BTC before this news. However, you should also be ready for short-term profit taking, post-ETF approval - whenever that comes.
- If you’re underexposed to BTC, we suggest increasing exposure on meaningful pullbacks and not taking profit at higher levels. Place the focus on increasing exposure.
BTC sparks excitement at $34,500; Is the next stop at $37,700?
31 October 2023Bitcoin remains in its bullish trend and is poised for a significant move. Traders and investors are keenly observing, hoping for a potential climb to $37,700.
However, before you make any decisions, there are indications suggesting caution in the immediate future. This is even as the probabilities of both a drop and a surge are equally imminent.
TLDR
- Bitcoin is in a bullish pennant pattern and could soon reach $37,700.
- RSI is overbought, but a pullback might happen from a higher price point.
- High funding rates suggest a bias towards going long on BTC.
- Liquidation levels indicate the potential for quick price movements.
Disclaimer: Not financial or investment advice. You are responsible for any capital-related decisions you make, and only you are accountable for the results. “One Glance” by Cryptonary sometimes uses the RR trading tool to help you quickly understand our analysis. They are not signals, and they are not financial advice.
Technical analysis
BTC continues in the bullish pennant pattern with a bias to break to the upside. However, BTC remains fighting at the $34,500 horizontal resistance level. We try to keep things relatively simple here from a technical analysis point of view. The consolidation at this price level is strong, and we feel that price will break to the upside in the near term and test the $37,700 area.RSI and funding rates
The RSI remains overbought but is coming down very slightly, but there is no change here.We still believe a pullback will happen, but we feel it’ll come later, from a higher price point, say from $37,700 potentially.
The funding rate remains very positive, and open interest is now relatively high - it's at its highest in well over a year. This suggests there is a clear bias to be long BTC here, and this potentially aids the idea that a leverage flush out is due, but again, something that may come later rather than imminently.
What we also note is the liquidation levels. We can see now that there are a lot of levels that could drive squeezes in price, simply because of how stacked the liquidation levels are.
Note the brighter the green/yellow, the larger the amount of USD that would be liquidated if price reached those levels. We believe that if price does move higher or lower into one of these liquidation areas, it will drive through that range relatively quickly as offside positions are liquidated.
Cryptonary’s take
We feel the next move for BTC is a break to the upside to test the $37,700 level. However, we note that leverage is higher than usual, and there are large liquidation levels on both sides of the range. Therefore, if price does break down or breaks out, we feel offside positions will be quickly liquidated, and price will make a large move.Again, we feel that BTC goes higher here to test that $37,700 level.
Action
-
- We are not taking action here and waiting to see what BTC does.
- We believe that the move will be higher and that if we do reach $37,700, that may be a local top. However, we did initially feel that $35,000 would be the local top, but because price has consolidated as well as it has, we have altered our opinion to adjust for another move higher for BTC.
What’s keeping BTC strong at $34K?
27 October 2023Bitcoin is doing extremely well by holding up at current prices. The S&P may be due for a bounce following positive earnings from Amazon, highlighting that consumers are still spending money. Additionally, U.S. GDP came in yesterday at 4.9%, well above the 4.0% estimates.
TLDR
- Bitcoin holds strong amidst economic surprises and positive Amazon earnings.
- BTC's technical analysis shows resilience below $34,500, defying sell-offs.
- On the 4-hour chart, BTC clings to the low $34,000s, with the potential for a pullback.
- Market signals are mixed, making directional predictions challenging; expect a pullback after a potential push to $36k.
Disclaimer: Not financial or investment advice. You are responsible for any capital-related decisions you make, and only you are accountable for the results. “One Glance” by Cryptonary sometimes uses the RR trading tool to help you quickly understand our analysis. They are not signals, and they are not financial advice.
Technical analysis
BTC is still holding up really nicely despite being beneath the horizontal resistance of $34,500 and having also rejected twice at the $35,000 level.Recently, we’ve seen a big sell-off in risk assets like the S&P, but BTC has avoided the sell-off. With the price action we’ve seen in recent days, you have to respect the strength. Yes, some indicators still suggest the market is overheated here, but again, you have to respect the recent price action.
The 4-hour chart shows that the low $34,000 is currently holding well. To see a more significant move higher, price would need to get back above $34,500 and likely close several 4-hour candles convincingly above this level.
Because BTC is so overbought here, it is more likely that a pullback is on the cards. However, if one were to come, we’d expect the $32,600 level to be a local support.
RSI and funding rates
The daily timeframe for BTC looks really toppy. We think it’s possible price gets another move higher into the $36/$37k area, but we would be surprised to see this and not get a pullback first.The RSI still remains phenomenally overbought at 83 on the daily. In bull markets, the RSIs are regularly in overbought territory, but in our opinion, this looks overheated.
The funding rates remain positive, and price is being driven by Perps, not the Spot market. Perps-driven volume doesn’t support price going meaningfully higher in the near term. Yes, again, we could see a small move to $36k, but for price to go to $40k, big Spot volume/buyers would need to come in. Currently, this doesn’t look to be the case.
Cryptonary’s take
The positive price action of the past few days, where BTC has been able to hold in and around the $34k area, should be respected. Despite many trading indicators suggesting BTC is heavily overbought here, it can have a slight push higher to $36k.It’s important that when new data is given (positive price action over the past few days), we should be nimble with our opinions. But, the market is still very overheated; therefore, we feel there are many contrasting signals here, and we struggle to pick a direction.
The market should pullback, but positive price action could give us a slight move higher first to $36k before getting a deeper pullback.
Action
- We are steering clear of BTC here but will look to add to our long-term bags if price gets back to the $31k/$32k area.
Bitcoin’s balancing act: Can BTC sustain its lofty heights?
25 October 2023Bitcoin continues defying gravity near $34k. The question remains: will BTC move higher, or is it time for a pullback?
Let's dive in and see which way the charts point.
TLDR
- BTC remains heavily overbought historically, suggesting potential for a pullback.
- Bullish pennant forming on the 4-hour, but several rejections at $34.5k resistance.
- Funding rates are very positive, indicating bias for longs rather than shorts.
- The uptrend line remains support, but expect consolidation/retracement soon.
Disclaimer: Not financial or investment advice. You are responsible for any capital-related decisions you make, and only you are accountable for the results. “One Glance” by Cryptonary sometimes uses the RR trading tool to help you quickly understand our analysis. They are not signals, and they are not financial advice.
Technical analysis
So far, the move has been really positive and remains relatively healthy. As price has had a larger move higher, we can see that the horizontal resistance of $34,500 has acted as the main resistance for now, with BTC testing this level several times.BTC is now well back inside its main uptrend line (thick yellow line), which should be positive for price.
On the 4-hour timeframe, BTC is forming a bullish pennant, which usually has a bias to break to the upside. However, we have to note how overbought BTC is here, along with the fact it’s below the horizontal resistance of $34,500, having rejected there several times.
RSI and funding rates
On most timeframes, but particularly the daily timeframe, Bitcoin is very overbought, currently at 87 on the RSI – this is massive. The last time Bitcoin was this overbought on the RSI was January 2023, but before that, it was January 2021. So, this should contextualise just how overbought Bitcoin is here.The funding rates are very positive and are positive across the board. This indicates that shorts have steered clear of this move higher, which somewhat aids the case for a price pullback for Bitcoin.
Cryptonary’s take
Bitcoin remains very overbought and overbought at historical levels. This should suggest some caution here, and unless further positive ETF news comes, we feel it’s likely that BTC should have a price pullback in the short term.The level of interest for a price pullback could be the $31,300 horizontal level that may now act as new support.
Action
- If price does pullback to $31,300, this may be a good area to begin buying BTC if you’re currently under-allocated.
- We would remain cautious about opening fresh longs at the current price of $34,200, as we do expect a pullback in price in the short term.
BTC heads towards $35k: Is the bull back?
24 October 2023What a move for Bitcoin!
Fundamentals and market mechanics are thrown out of the window when there is majorly positive news like yesterday’s. We saw TradeFi begin buying up BTC in anticipation of ETF approvals, which led to a ripping short-squeeze.
TLDR
- BTC exploded above $32k and $34.5k resistances after ETF approvals.
- BTC is now battling at $35k resistance but overbought on daily RSI.
- A pullback to $29k-$31k possible despite the bullish long-term outlook.
- Watch out for buying opportunities on dips before 2024 Bitcoin halving.
Disclaimer: Not financial or investment advice. You are responsible for any capital-related decisions you make, and only you are accountable for the results. “One Glance” by Cryptonary sometimes uses the RR trading tool to help you quickly understand our analysis. They are not signals, and they are not financial advice.
Technical analysis
BTC began moving higher in yesterday’s session and squeezing into the horizontal resistance at $31,300. Of course, from there, the next resistance was at $32,000 before a relatively clear path to $34,500 would be possible.In anticipation of Bitcoin ETFs being approved, we saw a large amount of buying come in yesterday. This aided BTC to go higher and break above its $32,000 horizontal resistance, fuelling a short-squeeze, which took the price to the $35,000 area.
Bitcoin now finds itself battling at a main horizontal resistance at $34,500. This is the next level to close above, which could then help BTC move higher.
It’s important to note here that when prices go straight up, they usually come straight back down. Prices need to stabilise at certain levels and build those levels as future supports that could then help prices go higher from them. Straight-up moves usually aren’t sustainable, despite the fact it’s off of really positive news this time.
RSI and funding rates
When we look at the RSI, it's at 88. This is the most overbought Bitcoin has been since January 2023. The last time that it was this overbought was in December 2021. BTC is phenomenally overbought while pushing into a main horizontal resistance at $34,500.The funding rates are very positive again. However, open interest isn’t ridiculously high, particularly after yesterday’s large price increase saw many of the shorts’ open interest wiped out - liquidated. However, this is the most-positive the funding rates have been in months.
Conclusion on trading BTC
Bitcoin is very overbought here, but it has achieved these significantly higher prices due to the ETF news. It’s possible the buying pressure can be sustained, but with BTC this overbought, it becomes increasingly less attractive to buy at today’s prices. If we have a slight retest of a lower level, that’s where large buyers may step back in. This level may be in the $29,000 to $31,000 area.In the long run, today’s current BTC price is still low compared to what it may be in the upcoming bull run, which we believe peaks at some point in 2025 and a price point of $100,000 to $150,000.
We’re still very cautious about the macro in the coming months. Still, with time running out between now and the next Bitcoin halving (April 2024), increasing our exposure and using major price pullbacks as buying opportunities in the coming months is important.
Action
- If you’re a long-term investor, BTC is still a good buy at these prices and can achieve a 3-5x multiple between now and the bull-run peak.
- However, with BTC currently so overbought, it's very possible a pullback in price is needed. This area may be the $29,000 to $31,000 area.
BTC heads towards $31k: What’s next for the king?
23 October 2023The bulls are back in business as BTC steamrolls towards $31k. But while Bitcoin booms, ETH is still struggling to catch up. BTC’s uptrend is surprising because it is happening against the backdrop of macro and the many headwinds we believe are on the horizon.
So, what’s next for Bitcoin? Let’s take a look at what the charts are saying.
TLDR
- BTC has surged, driving up altcoin prices, but it faces a major resistance at $31k/$32k.
- Technical analysis shows BTC aiming for prior highs, with $31,300 as a significant resistance level.
- RSI indicates overbought conditions, urging caution, while funding rates suggest a healthy market.
- Despite the strong move, caution is advised due to overbought conditions and looming macroeconomic uncertainties.
Disclaimer: Not financial or investment advice. You are responsible for any capital-related decisions you make, and only you are accountable for the results. “One Glance” by Cryptonary sometimes uses the RR trading tool to help you quickly understand our analysis. They are not signals, and they are not financial advice. Any capital-related decision you make is your responsibility and yours only.
BTC | Bitcoin
A phenomenal move from BTC that has led to even bigger moves in altcoins. The move in alts has taken us by surprise, but the key note here is that BTC is moving higher but is at the last prior major resistance at $31k/$32k. This is the key resistance zone.Technical analysis
BTC has had a really good, strong move higher, now eyeing the prior highs of $31k/$32k, with the main resistance at the $31,300 level. BTC closed well above the $28,300 horizontal level and flipped it into support by building a base above it, which helped fuel BTC to go higher. We’re now seeing price test the $31k level while battling against the underside of the main uptrend line that may act as resistance.RSI and funding rates
The RSI is well into overbought territory now, at 77 on the daily, 82 on the 12hr and 70 on the 3-day chart. This would immediately suggest us to be somewhat cautious here. But there are no divergences here yet, so could the price increase to create a bearish divergence? Sure, this is possible. Ultimately, here, though, price is very overheated.Funding rates are very positive again, yet open interest isn’t ridiculously high, so this is somewhat of a healthy market in terms of funding and open interest.
Conclusion on trading BTC
Despite the strong move from BTC, we’re well into overbought territory and haven’t broken above the main resistance zone (between $31,300 and $32,000). The overall strength of the move here has certainly caught us by surprise. However, we wouldn’t be fomo’ing in here and would remain cautious at these levels.We’re still very cautious about the macro and the many headwinds we believe are on the horizon. We feel risk assets, in general, will come down in the coming months, and Crypto won’t be immune to this.
Action
- BTC has moved up well. However, we’re not fomo’ing in, but we’re exercising caution here.
- We remain on the sides to watch this play out until the major $31,300 to $32,000 resistance can be broken.
BTC Dominance reaching a key resistance zone
03 September 2023BTC.D has seen significant gains in the past 10 days, with current dominance being 72.60%. The latest gains confirm 2019 is all about Bitcoin.
On August, BTC.D broke the 72% psychological level and the whole TOTAL2 market went down as a result of it. The altcoin market hasn't stopped bleeding as more and more institutional investors are moving towards the “BTC safe haven”.
Even though BTC Dominance stays strong, a key resistance is just around the corner. The 74.08-77.22 area needs to be monitored. Bakkt futures will play a key role, expectations can either push dominance above 2017 levels or create a pullback. If there is no slowdown in the current trend, the altcoin apocalypse will continue.
The last time BTC.D reached this level was between March and July 2017. Dominance fell sharply after that, reaching the 50 mark (-32%). Interestingly, from July onwards, the Alcoin market spiked over 400%. From July 17 to Sep 17 TOTAL2 went from $10Bn USD to $82Bn USD.
Recommended from Cryptonary


