Save 23% ($351) & Get a Free 1-1 Call with our Team ⏰ : 0d 2h 59m 44s
Ethereum (ETH) Price Prediction
Ethereum ($ETH) has been a game-changer in the crypto space, surging from just a few dollars to an all-time high of $4,878. Its volatility presents both opportunities and challenges, making price predictions crucial for investors.

We at Cryptonary provide you with the most accurate price prediction for all sorts of coins, including Ethereum. You can also request an on-demand ETH price prediction by joining our Discord Community.
Our Price Prediction Model
Unlike others, we don’t rely on automated methods because there’s a higher chance of getting a wrong prediction. There are many factors to consider when accurately predicting a cryptocurrency’s price.That’s why our team of Cryptonary analysts carefully research each cryptocurrency and give you a detailed price prediction using technical analysis to help you make the most profit. This prediction is based on a technical analysis of the coin rather than just general sentiment. We also offer various things like:
- Market Updates: Done a few times per week based on macro indicators.
- Market Directions: Provides details on current market conditions and patterns.
- On-Demand Analysis: Offer analysis of a coin according to your request.
With that said, here’s our Ethereum price prediction.
ETH stuck between $2,420–$2,720
16 June 2025Ethereum remains range-bound after a Middle East-driven selloff. Support held at $2,420, but with BTC leading sentiment, ETH’s next move may depend on broader momentum.
Disclaimer: This is not financial or investment advice. You are responsible for any capital-related decisions you make, and only you are accountable for the results.
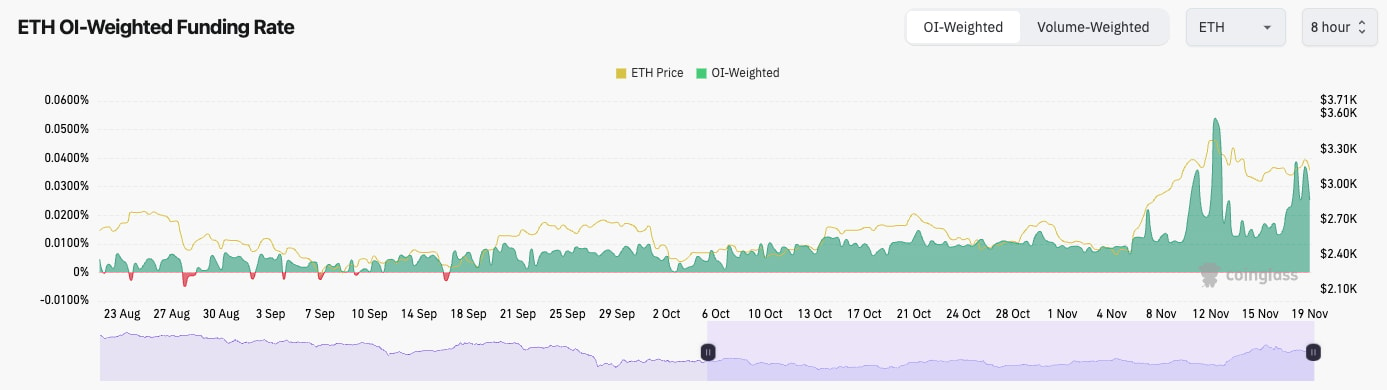
- ETH's Open Interest remains very elevated despite seeing a small flush out over the weekend on escalating tensions in the Middle East.
- ETH's Funding Rate remains positive and stable at 0.01%, indicating there is a healthy bias to be Long amongst traders.

Technical analysis
- War escalations in the Middle East resulted in ETH falling below its key horizontal level of $2,720, and the price returned to its old range of $2,420 to $2,720.
- Price has found support at $2,420, and it's now bounced back to the middle of the range.
- $2,420 is the main horizontal support, with $2,160 the major level below that. To the upside, the key horizontal level is $2,720.
- The RSI has meaningfully reset, and it has retested its downtrend line breakout as new support. However, it is below its moving average for now.

- Next Support: $2,420
- Next Resistance: $2,720
- Direction: Neutral
- Upside Target: $2,720
- Downside Target: $2,420
Cryptonary's take
ETH is essentially back into its range between $2,420 and $2,720, and to be honest, it's neither too bullish nor bearish here. A move higher (and a breakout) is likely now going to be led by other Majors (BTC or SOL), rather than being ETH-led like it was last week. For now, our expectation is that ETH will remain range-bound over the coming days/week, but the price may push into the resistance at $2,720. From there, we'll have to watch to see if price action is strong enough to break out.Ethereum caught in tight range with risks
06 June 2025ETH continues to consolidate between two major levels. While structure remains intact, traders are watching closely for a decisive breakout—or breakdown—driven by broader market stability.
Disclaimer: This is not financial or investment advice. You are responsible for any capital-related decisions you make, and only you are accountable for the results.
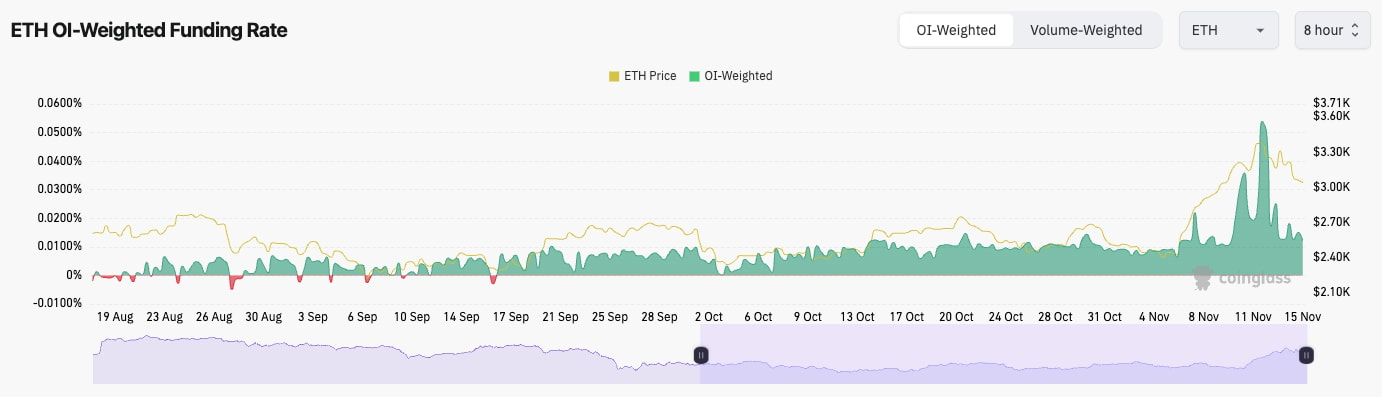
- ETH's Open Interest remains at phenomenally high levels whilst Funding Rates remain flat (0.00%).
- This suggests that there is a relatively even balance between Longs and Shorts.

Technical analysis
- ETH has initially rejected into the local resistance at $2,720, although price has found support at the main horizontal support of $2,420.
- ETH remains range bound between $2,420 and $2,720.
- If price breaks below $2,420, the next major horizontal support sits at $2,160.
- If price can move back towards the highs and breakout of $2,720, the next upside resistance level is $3,050.
- As price has consolidated between $2,420 and $2,720, this has given time for the RSI to reset and pullback to middle territory, being neither overbought nor oversold. This is healthy to see.

- Next Support: $2,420
- Next Resistance: $2,720
- Direction: Neutral/Bullish
- Upside Target: $2,720
- Downside Target: $2,160
Cryptonary's take
ETH's chart looks drastically better than the other Majors, as ETH has managed to hold its structure with the $2,420 horizontal support remaining intact. It's important that the $2,420 level continues to hold, and if the rest of the market can hold up at current levels, even for just a few days to a week, then ETH can potentially run back to $2,720 in this time. In terms of breaking out beyond that, we'd likely have to see the general market hold current levels.For now, we're not looking to trade ETH, although we may look to pick up longer-term Spot bags should ETH break down and retest the main horizontal support at $2,160.
ETH stability tested at $2,420 floor
02 June 2025ETH remains range-bound between $2,420 and $2,720 with high Open Interest. While BTC and SOL falter, ETH’s structure looks healthier—if $2,420 holds, bulls may get another shot.
Disclaimer: This is not financial or investment advice. You are responsible for any capital-related decisions you make, and only you are accountable for the results.
- ETH's Open Interest still remains incredibly high, and it's increased as price has remained range-bound.
- ETH's Funding Rate has pulled back from 0.01%, but it's still positive, which suggests that there is a relatively even balance between Longs and Shorts.
Technical analysis
- Price has broken into the upper bound of the range at the $2,720 horizontal resistance.
- Price has been range-bound over the last few weeks between the horizontal support at $2,420 and the horizontal resistance at $2,720.
- Price is now at the horizontal support (of $2,420) with the RSI having meaningfully reset back to neutral territory, which is healthy to see.
- If $2,720 can be broken to the upside, then $3,050 is the next major horizontal resistance.
- If $2,420 (the horizontal support) is lost, then $2,160 is the next level on the cards.

- Next Support: $2,420
- Next Resistance: $2,720
- Direction: Neutral
- Upside Target: $2,720
- Downside Target: $2,160
Cryptonary's take
We've had a monster rally across the board on all assets, so it wouldn't be bad to see a slight pullback or a period of consolidation, which is what we expect to see over the coming 1-2 weeks.BTC and SOL have both broken below their main uptrend lines, and they're balancing on key supports. ETH, on the other hand, is holding a key range, and granted it is at its main support of $2,420, but from a charting perspective, it does look better than the other Majors - if you're going to bet on upside. But as we said, we are expecting 1-2 weeks of pullback or chop, and therefore it might be hard for ETH to rally strongly in that environment. For now, we're watching the key level of $2,420 for ETH. We may consider longer-term Spot positions for ETH should it revisit $2,160.
Ethereum prepares for breakout as RSI resets
27 May 2025ETH has consolidated above a key support zone with increasing long interest and a resetting RSI, setting the stage for a possible breakout toward higher resistance levels.
Disclaimer: This is not financial or investment advice. You are responsible for any capital-related decisions you make, and only you are accountable for the results.
- ETH's Open Interest has increased to new highs whilst the Funding Rate is meaningfully positive. This suggests that most of the build-up in new OI is Longs.

Technical analysis
- Following its breakout, ETH has remained range-bound between $2,420 (the horizontal support) and $2,720 (the local resistance).
- ETH's RSI has reset during this period of consolidation above a key horizontal support ($2,420), and it now looks ready to breach back above $2,720 and target $3,050.
- If ETH can break out of $2,720, then $3,050 is the next horizontal resistance.
- To the downside, if ETH were to lose $2,420, then the next major horizontal support is $2,160.

- Next Support: $2,420
- Next Resistance: $2,720
- Direction: Bullish
- Upside Target: $3,050
- Downside Target: $2,160
Cryptonary's take
ETH has held and consolidated above a key technical level - the $2,420 horizontal support. During this period of consolidation, the RSI has also reset slightly, although it does remain below its moving average.Our expectation is that ETH's next major move will be a breakout to the upside, with a breakout of $2,720, seeing ETH potentially push onto $3,050. Our view would be invalidated with a breakdown below $2,420.
Ethereum faces pressure near $2,420 support
23 May 2025Ethereum’s sharp rally has stalled at $2,720 as momentum cools and RSI rolls over. Open interest remains elevated, hinting at heavy leverage. A drop to $2,160 remains possible if $2,420 breaks.
Disclaimer: This is not financial or investment advice. You are responsible for any capital-related decisions you make, and only you are accountable for the results.
- ETH's Funding Rate is positive but more muted than BTC and SOL's.
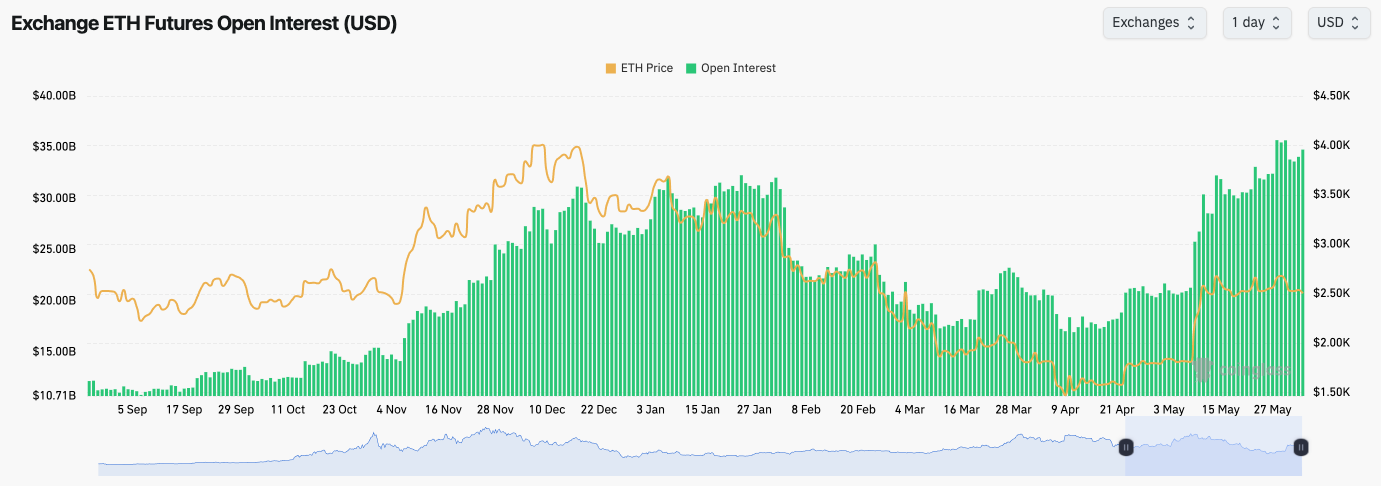
- ETH's Open Interest remains at very elevated levels, meaning that there is a large leverage buildup, although from Funding, we can tell that the positioning is relatively even.
Technical analysis
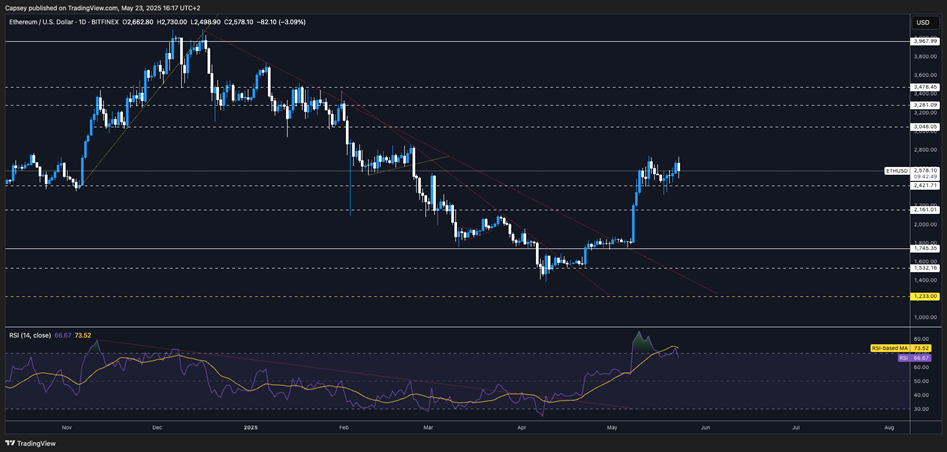
- ETH's price has fluctuated between the local horizontal resistance at $2,720 and the major horizontal support at $2,420.
- If price loses the $2,420 level, then the next major support is at $2,160.
- To the upside, if $2,720 can be overcome, then $3,050 is the next major horizontal resistance.
- The RSI was in overbought territory, although it has now pulled back slightly. However, the moving average is in overbought territory, and it is now beginning to roll over.
Cryptonary's take
ETH has had a big and quick move up; however, momentum now looks as if it's stalling with the RSI rolling over and price being unable to break out above $2,720. If the price loses$2,420, then we'd expect a revisit of $2,160. If price revisits $2,160, we'll assess at the time if we add to ETH at those levels. It'll likely depend on how deep of a pullback BTC goes through in this same scenario. For now, though, we're remaining patient, and we're not looking to accumulate any ETH here as we're expecting the price to pull here over the coming 1-2 weeks.
- Next Support: $2,520
- Next Resistance: $2,720
- Direction: Neutral/Bearish
- Upside Target: $2,720
- Downside Target: $2160
ETH's bounce looks fake — $2.16K target?
19 May 2025- ETH's Funding Rate remains positive, but at a healthy level,
- ETH's Open Interest has increased dramatically on this price rebound. This is likely large players scaling into Shorts.
Technical analysis
- The positive development was ETH reclaiming back above $2,420, and the price began to use that level as horizontal support.
- However, price has since retested below that level, and it's now battling to maintain above it.
- To the downside, the two key horizontal levels are $2,420 (current level) and then $2,160.
- To the upside, the key horizontal level is $2,700.
- ETH's RSI moving average has moved well into overbought territory. It's possible we see a small move up of the RSI, and a rejection of its moving average. This likely results in the price moving into $2,160 over the coming weeks.

- Next Support: $2,420
- Next Resistance: $2,700
- Direction: Bearish
- Upside Target: $2,700
- Downside Target: $2,160
Cryptonary's take
This move higher in ETH was mostly due to Shorts being squeezed, hence it was such a violent move. However, we do see the most likely path for ETH over the coming weeks being a pullback to $2,160. At that level, we may begin DCA'ing into ETH, however, we will reassess at that price level (assuming we get it), and it's very possible that our DCA levels are lower than $2,160. For now, we're remaining patient and we're not looking to accumulate ETH, and probably not anytime soon.ETH pullback expected after rapid gains
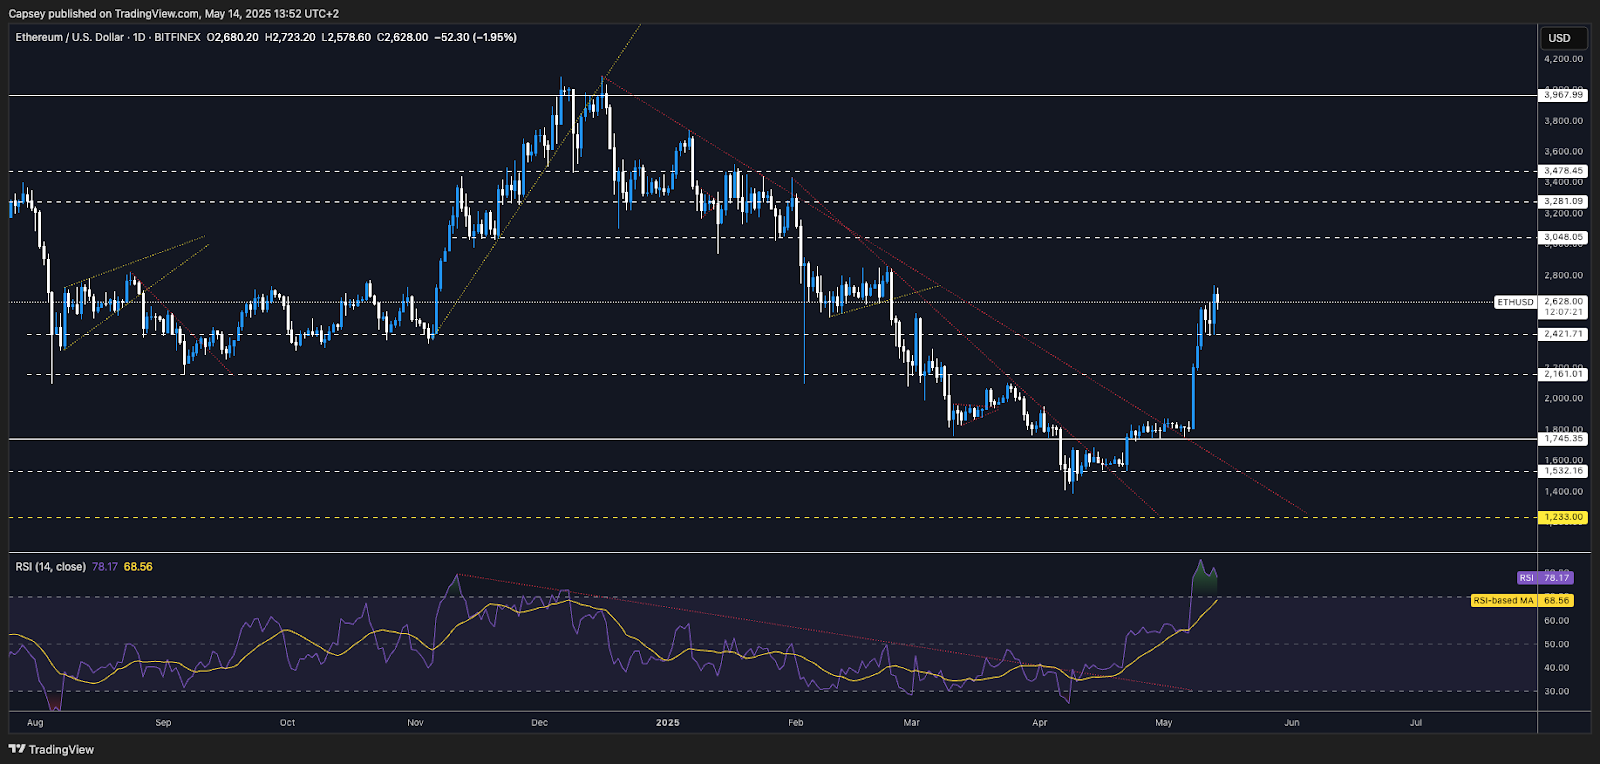
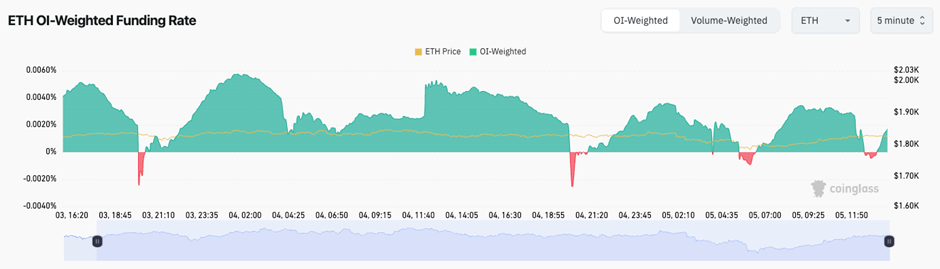
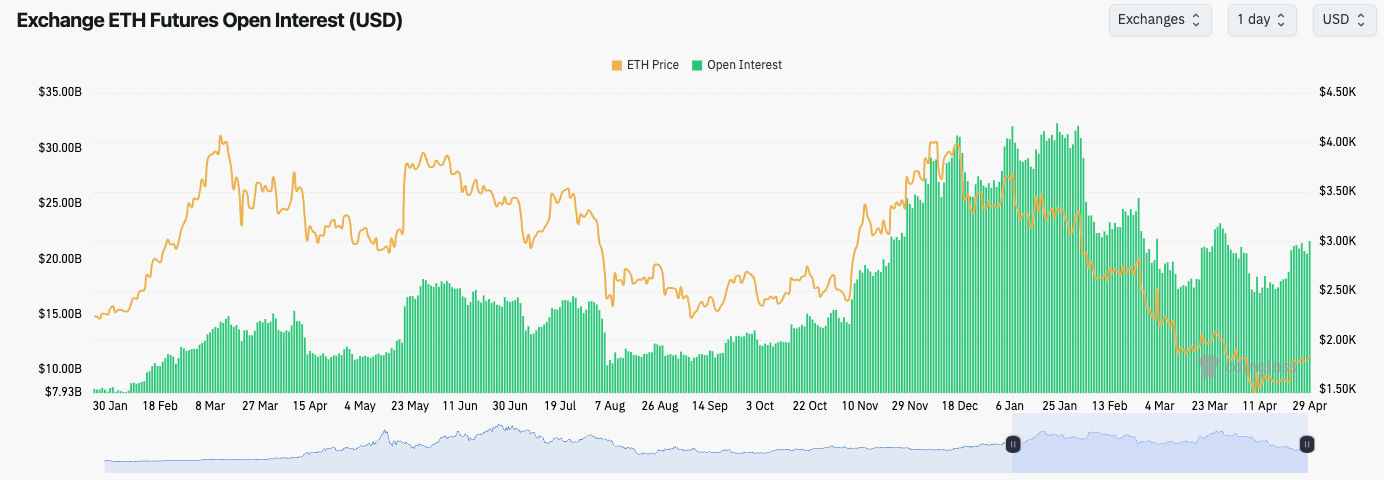
14 May 2025- ETH's Open Interest on a USD and number of coins basis has jumped up massively, whilst the Funding Rate is neutral (0.00%). This suggests that a large amount of leverage has now been applied, with it being relatively even between Longs and Shorts.

Technical analysis
- ETH broke up and recovered the $1,745 horizontal level. Price built support on top of it, and it has since exploded higher recovering some key levels.
- ETH broke above $2,160, and then also $2,420, these are the two key levels.
- ETH has since formed support on top of the $2,420 horizontal support. Ideally, it would be good to see this level hold, however, we expect $2,160 to $2,420 to be the key zone of support.
- To the upside, $2,730 is the local resistance, and $3,050 is the major horizontal resistance.
- The RSI is currently very overextended to the upside, with the moving average now at its highest level since March 2024.
- We also note on the RSI that a bearish divergence has been put in overbought territory
- Next Support: $2,420
- Next Resistance: $2,830
- Direction: Neutral
- Upside Target: $3,050
- Downside Target: $2,140
Cryptonary's take
This is a huge move up for ETH, where we've seen a significant driver of the move being the unwind of Shorts. The question here is, can this rally continue? Our expectation is that we're due for a pullback in the immediate term, which we expect can retest the $2,160 to $2,420 area. Although we prefer other plays (such as SOL and HYPE), we'd consider building Spot positions in ETH between $2,160 and $2,420, with a view to holding it for 6-12 months.ETH’s range tightens ahead of breakout
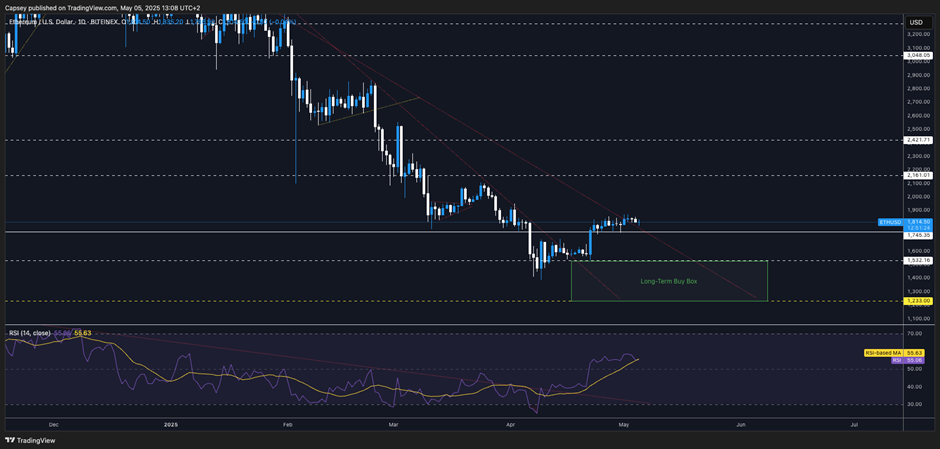
05 May 2025ETH maintains its breakout above $1,745, with bullish structure intact, though high Open Interest from cash-and-carry trades skews signals. A move to $2,160 is possible—if support holds.
Disclaimer: This is not financial or investment advice. You are responsible for any capital-related decisions you make, and only you are accountable for the results.
- ETH's Funding Rate has fluctuated, but it has mostly remained positive, whilst its Open Interest (by number of coins) remains very high. This suggests that there's a big demand for the 'cash-and-carry' trade. This distorts the data, meaning OI and Funding become less of a signal for ETH.
Technical analysis
- ETH has broken out of its main downtrend line, and it's holding above its horizontal level of $1,745. If price loses this level, then we'd expect a move back to $1,600.
- To the upside, the key horizontal resistances are at $2,000 and $2,160.
- The RSI is in middle territory, and it's now sitting on top of its moving average; this is a support level for ETH.
- Price has remained in a tight range between $1,745 and $1,850. We are expecting a breakout, and likely to the upside, assuming the general market doesn't dramatically sell off.
- Next Support: $1,745
- Next Resistance: $2,000
- Direction: Neutral/Bullish
- Upside Target: $2,160
- Downside Target: $1,530
Cryptonary's take
Overall, we're relatively sceptical on the market now as we are expecting a pullback over the coming days/weeks. However, ETH is the setup that looks best for a move higher, if that's directionally how you want to bet. If the market can hold up, then ETH can break out and move higher, potentially to $2,000. However, due to our bearish stance on the market currently, we're not looking to play ETH here.If ETH were to pull back to $1,530 to $1,600, it may be worth beginning to accumulate a very small bag for the long run, even if we do believe more in SOL and HYPE as outperformers over the coming 6-12 months.
ETH eyes $2,160 amid downtrend resistance
29 April 2025ETH's price is testing crucial support at $1,745, with bullish targets at $2,000 and $2,160. A break below $1,745 could send ETH towards $1,530. Market conditions remain pivotal for further gains.
- ETH's Open Interest has ticked up slightly, but the Funding Rate has also come down somewhat; however, they still remain slightly positive. This suggests that some Shorts have begun stepping in.
Technical analysis
- ETH has found support above the key horizontal level of $1,745, whilst price grinds along into the main downtrend line.
- If ETH can break out of its main downtrend line, the upside targets would be $2,000 and then $2,160.
- To the downside, the key level for ETH will be maintaining above the $1,745 horizontal support, but if that level does break, then $1,530 is the likely target area.
- The RSI is in middle territory, and nowhere near being overbought. This suggests that there can still be further upside for price.

- Next Support: $1,745
- Next Resistance: $2,000
- Direction: Bullish
- Upside Target: $2,160
- Downside Target: $1,530
Cryptonary's take
For us, it's difficult to bet on upside in this market when we have concerns over the macro environment over the coming months. However, if you are looking to bet on upside, ETH is the play, and it looks attractive to Long in comparison to other plays.If the general market can hold up (not meaningfully pull back), then ETH can break out and test $2,000 and then $2,160 in the short term.
ETH price struggles at $1,745 resistance
21 April 2025Ethereum’s price has been locked in a tight range, and traders are eyeing crucial levels for a potential breakout or pullback. Here's a look at what’s ahead for ETH.
Disclaimer: This is not financial or investment advice. You are responsible for any capital-related decisions you make, and only you are accountable for the results.
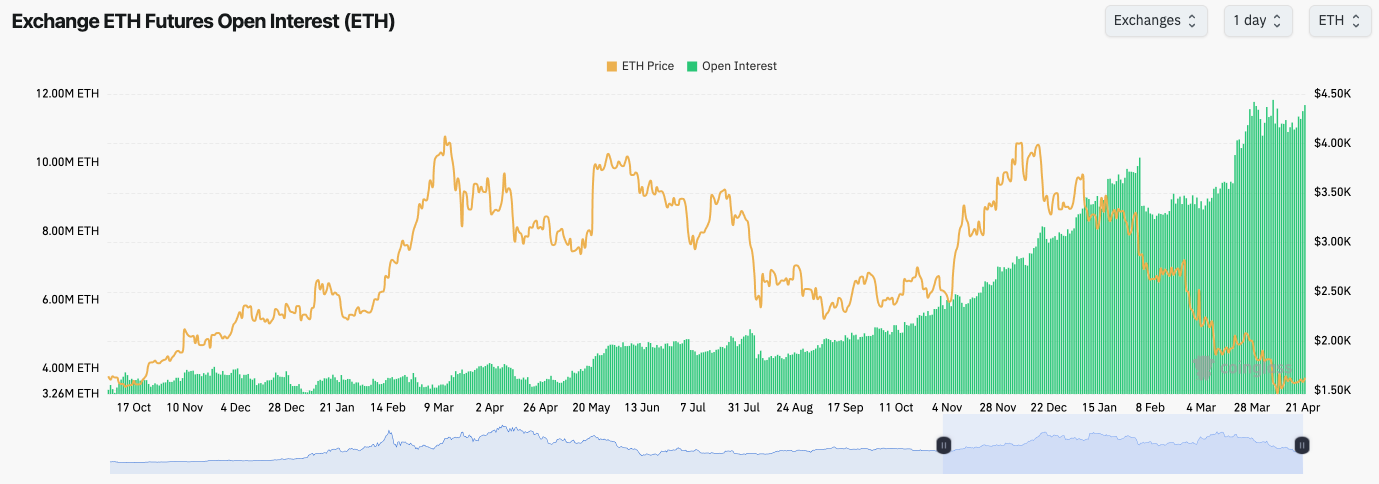
- ETH's Open Interest (by number of coins) remains at extremely elevated levels as traders continue to take advantage of the 'cash-and-carry' trade.
- Like the other Majors, ETH's Funding Rate has mostly been range-bound between slightly positive and slightly negative, indicating that there is no clear directional bias amongst traders.
Technical analysis
- ETH's price action remains range-bound between the support of $1,530 and the horizontal resistance of $1,680.
- Beyond $1,680, the major horizontal resistance lies at $1,745. If ETH can reclaim/flip this level, we'd take that as the signal for the bullish reversal.
- On the RSI, ETH has broken out of its main downtrend line, and it's above its moving average in middle territory. This could see an extension of the move higher, however, we do expect $1,745 to remain a strong resistance.
- We still expect a retest of the Green Buy Box between $1,230 and $1,530 over the medium term.

- Next Support: $1,530
- Next Resistance: $1,745
- Direction: Bearish
- Upside Target: $1,745
- Downside Target: $1,230
Cryptonary's take
ETH remains in a long-term downtrend, and we fully expect a retest of the lows, which would put price comfortably in the Green Buy Box between $1,230 and $1,530. We would look to accumulate ETH in this area with a long-term view to hold - it would likely be at least a 12-month hold.Whilst it's possible in the immediate term, ETH could see more upside (up to say $1,745 at best), we are, however, expecting more downside over the medium term; therefore, again, we remain patient. But with ETH, we're not looking for Shorts, as it's not at an attractive price point for Shorts despite the fact that we believe we'll see further downside in the medium term.
Ethereum forms bullish pennant near key level
14 April 2025ETH forms a tightening pennant, with bullish RSI and improving funding rates. But with resistance zones overhead, traders are watching closely for either breakout or rejection.
Disclaimer: This is not financial or investment advice. You are responsible for any capital-related decisions you make, and only you are accountable for the results.
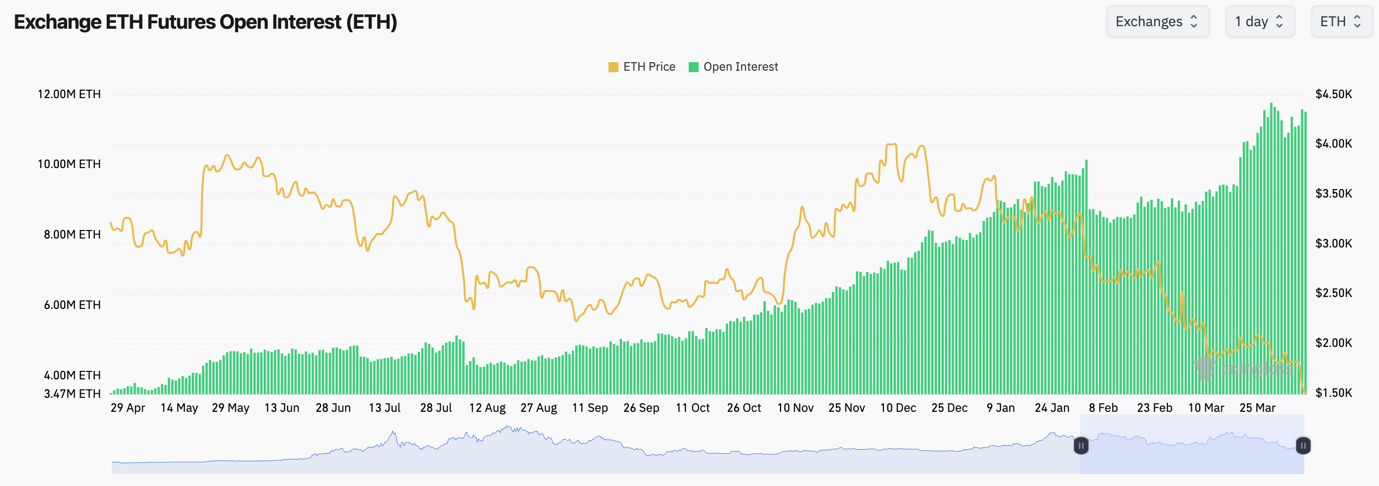
- ETH's Open Interest still remains at very elevated levels as traders take advantage of the basis trade. From a zoomed-out perspective, ETH's OI is becoming less and less of a relevant tool when conducting our analysis.
- ETH's Funding Rate has fluctuated between negative and positive, but it now sits at more meaningfully positive levels. However, overall, this reflects indecision amongst traders.

Technical analysis
- ETH has found support between $1,400 and the $1,530 horizontal level, with price now forming a pennant pattern that looks to potentially be setting up to breakout to the upside.
- ETH is also squeezing into its main downtrend line. A breakout could set up a swift move to at least the next horizontal level at $1,745.
- To the upside, the main horizontal resistances are at $1,745 and $2,160. $2,000 is also a psychological level.
- To the downside, $1,400 to $1,530 remains the support zone.
- The RSI is above its moving average, and it has broken out of its downtrend line, whilst it's still in low middle territory, suggesting that there's further upside to be had.
- In terms of a bullish reversal signal, we'd be looking for a breakout of the local downtrend line and a reclaim of $1,745. We think this is possible in the short term.

- Next Support: $1,530
- Next Resistance: $1,745 (then $2,000)
- Direction: Bullish
- Upside Target: $2,000 (maybe $2,160)
- Downside Target: $1,530
Cryptonary's take
In the short-term, we expect ETH to see a breakout to the upside, which could see $1,745 retested as the minimum level, with $2,000 potentially being the first major stopping point. However, we do expect this to be a short-term relief rally, and for the $2,000 to $2,160 zone to be the stopping point (local top). We would then lean more bearish again, and expect the lows to be retested. That's where we'd look to fill longer-term Spot buys, between $1,230 and $1,530.ETH battles key support amid downtrend
11 April 2025ETH is fighting for a breakout at critical levels, with support around $1,230. As the market watches, will ETH reclaim its upward momentum, or continue its bearish trend?
Disclaimer: This is not financial or investment advice. You are responsible for any capital-related decisions you make, and only you are accountable for the results.
- ETH's Open Interest (by the number of coins) remains at highs. This is due to the coin's value going down substantially (reflected in higher OI by the number of ETH), but there is also still the appetite for funds to be taking advantage of the carry trade (Long Spot, Short Futures, and profit the Funding Rate).
- However, ETH's Funding Rate has recently flipped to being negative, as we can see below, suggesting there is more of an appetite amongst traders to be Short, but we might look to take the other side of this.

Technical analysis
- ETH has been in an aggressive downtrend now for 4 months, having reached extreme oversold levels, not seen since August 2024, and August 2023.
- Price is currently battling at the horizontal level of $1,530, whilst price is also squeezing into the local downtrend.
- The key level for price to reclaim to the upside is the $1,745 horizontal level. If this happens and the price can break out of the downtrend line, then $2,000 (psychological level) is the target.
- On Tuesday, the RSI went into extreme oversold levels. It has since bounced, and it's now pushing up against its downtrend line, whilst it's also got above its moving average.
- In terms of accumulation levels for ETH, we see ETH as being close to a bottom. We'd be accumulating for the long-term (maybe smaller sizing against HYPE SOL etc), between $1,230 and $1,550.

- Next Support: $1,230
- Next Resistance: $1,745
- Direction: Neutral/Bullish
- Upside Target: $2,160
- Downside Target: $1,230
Cryptonary's take
As we said, ETH has been in an aggressive downtrend for 4 months now, and it's down 65% from its highs. With us potentially beginning to turn on the macro front, it might be wise to begin turning from a bearish to a more bullish bias and to be looking to pick up longer-term Spot bags. For that, we'll be eyeing the range between $1,230 and $1,550.In the short term, we think ETH might be good to attempt a breakout of its downtrend line here. However, the critical testing area will be $1,745, if ETH can reclaim that horizontal level, and then breakout of the downtrend line, $2,160 is the target.
ETH struggles at $1,530 support amid decline
07 April 2025As Ethereum battles crucial support levels, it joins BTC in a volatile market. Let's take a closer look at how ETH and other major assets like BTC are reacting to the current market conditions.
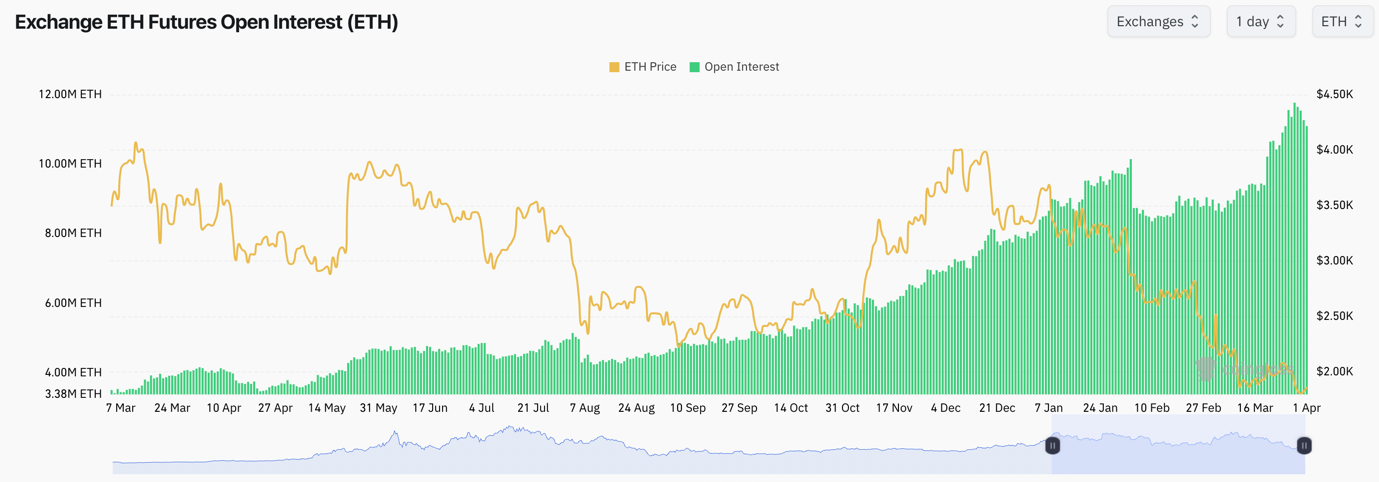
- ETH's Open Interest remains really high, however, this is due to the coin's price going down, hence OI by the number of coins goes up, as it becomes cheaper to leverage ETH.
- ETH's Funding Rate is fluctuating between slightly positive and slightly negative, suggesting that there's a lack of conviction and indecision amongst investors.
Technical analysis
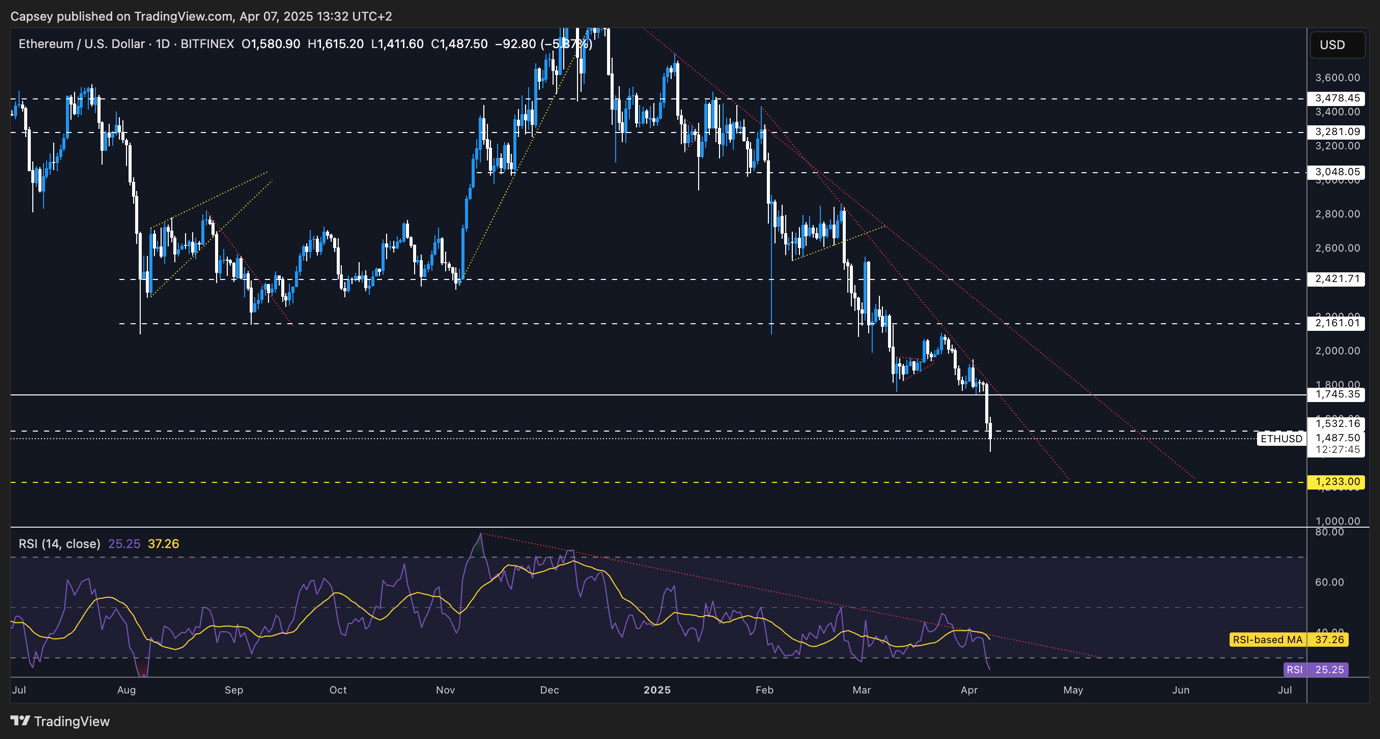
- ETH moved down to the horizontal support of $1,745. But, price quickly broke down from that support ,and ETH is now fighting at the next horizontal level of $1,530.
- Below $1,530, the next major horizontal support is at $1,230. If ETH were to get there in the short/medium term, we might have to consider some light buys.
- On the RSI, ETH remained in its downtrend before breaking down more significantly. The RSI is now into deep oversold territory.
- To the upside, the $1,745 horizontal level will now be the new resistance. We wouldn't get bullish again until ETH reclaimed that level.
- ETH remains in both of its downtrend lines for now (dotted down-trending red lines).
- Next Support: $1,230
- Next Resistance: $1,745
- Direction: Neutral/Bearish
- Upside Target: $1,745
- Downside Target: $1,230
Cryptonary's take
ETH's price action has been really poor. It's essentially been straight down, with rallies being weak, and crucial support levels eventually being lost. Where this price decline stops is hard to say.Right now, price is very oversold, but with ETH really lacking in positive narratives, it's possible ETH can go lower. At some point, it'll reach a point where it starts to look attractive from a valuation point of view. $1,230 may be that level.
For now, we'll sit tight and see how this plays out, but we are getting closer to these buy levels, and it has happened quicker than we expected due to Trump's aggressiveness.
Ethereum targeting $2,100 resistance zone
01 April 2025Ethereum’s price is consolidating near crucial support levels while Bitcoin tests key resistance. As the market teeters, let’s explore the latest movements and see what lies ahead for ETH in these volatile conditions.
Disclaimer: This is not financial or investment advice. You are responsible for any capital-related decisions you make, and only you are accountable for the results.
- ETH's Open Interest remains close to all-time highs (by number of coins), whilst the Funding Rate remains slightly positive. Again, there isn't much signal in this currently other than the fact that the carry trade is still being had, whilst there isn't a huge appetite amongst leverage traders to be taking sizeable trades.
Technical analysis
- ETH rejected at $2,100 and price pulled back to the horizontal support of $1,745, as we expected it might.
- Price is now trying to bounce from this $1,745 horizontal support level. The RSI has also put in back-to-back bullish divergences (lower lows in price, with higher lows on the oscillator). This could help fuel a move higher.
- If the $1,745 horizontal support is broken to the downside, then the next major horizontal support is at $1,530. If $1,745 is broken, then expect $1,530 swiftly, although we do think $1,745 can hold in the short-term.
- To the upside, the horizontal resistances are $2,100 and $,2160, with the most significant at $2,420, although, to be frank, we don't expect this to be retested anytime soon.

- Next Support: $1,745
- Next Resistance: $2,100
- Direction: Neutral
- Upside Target: $2,100
- Downside Target: $1,530
Cryptonary's take
Despite the general picture for risk assets not being very positive currently, ETH is squeezing into a local downtrend line, having put in two back-to-back bullish divergences. If there is a general breakout in the market, then ETH does look like one of the plays that could get a good breakout.The issue with ETH recently has been its underperformance. So, even though this chart might look good for a breakout (if we're wrong on the macro and the market can break out) then ETH might rally but still underperform.
Whilst the structure looks constructive, we're not looking to chase strength in the current macro backdrop. We'd be more interested in Shorts if the price runs into key resistances, say at $2,420, but we don't expect this level to be retested anytime soon. For this reason, we just steer clear of ETH for now. The play recently was BTC into the Short box zone.
ETH faces bearish pressure at $1,950
28 March 2025Ethereum ($ETH) is testing key support levels, with bearish pressure continuing. Despite positive funding rates, price action remains weak, and a retest of lower levels is expected in the coming days.
- ETH's Open Interest continues to soar higher as traders/institutions take advantage of the 'cash-and-carry' trade - Buy Spot ETH, Short the Perps contract and profit from being paid the Funding Rate.
- ETH's Funding Rate has remained mostly positive, indicating traders have been more willing to be Long than Short.

Technical analysis
- ETH rejected to $2,100, which was where the bottom wicks lined up previously.
- We expected the major horizontal resistance of $2,160 not to be surpassed, and we presumed it would be tested, considering ETH was getting a relief rally after a really strong downtrend. However, it wasn't even retested.
- ETH is now seemingly breaking below the local support of $1,950.
- The major horizontal support for ETH is at $1,745. We expect this to be retested sometime over the next fortnight. We're not sure exactly when, but we do think it's inevitable.
- ETH's RSI broke out of its downtrend line, but it has swiftly rejected and fallen back into the trend, with it now also breaking below its moving average. Not great to see.

- Next Support: $1,745
- Next Resistance: $2,160
- Direction: Bearish
- Upside Target: $2,160
- Downside Target: $1,745
Cryptonary's take
ETH still looks very weak, and each time it gets to a key level to stage a test, it seems to fail, eg, it couldn't even retest $2,160 in this relief rally. We are expecting a retest of $1,745 in the coming week or two.If/when ETH gets there, we'll reassess, as it's possible another bullish divergence might form close to oversold territory, whilst ETH is moving into a major horizontal support. That might provide an opportunity for a Long. But let's see if our thesis plays out, and we'll reassess closer to the time.
ETH aims for $1,960 target
18 March 2025- ETH's Open Interest has continued its grind higher, likely due to participants taking advantage of the 'carry' trade.
- ETH's Funding Rate is slightly positive, but it might be being compressed due to the 'carry' trade, so the fact it remains positive suggests there's likely more of a slight bias here amongst traders to be Long, at this moment in time.

Technical analysis:
- Key note; the chart below is ETH on the 3D timeframe, so much more zoomed out. And we'll look at it from that perspective to get a better gauge as to how to play it, and to help us identify key levels.
- ETH is essentially just above its major support at $1,745, with $1,530 the next key level.
- We don't expect $1,530 will be lost/broken to the downside.
- On the upside, ETH's horizontal resistance is at $2,160, and we think this can be retested at a major relief rally.
- ETH's RSI is very oversold, the most oversold it's been since mid 2022, yes, that's pre-FTX collapse.

- Next Support: $1,745
- Next Resistance: $2,160
- Direction: Neutral
- Upside Target: $1,960
- Downside Target: $1,545
Cryptonary's take:
In the short term, we expect ETH will be range-bound between $1,745 and $1,960. We expect a breakdown into the $ 1,500 is possible, but that might be a good long-term buying area.Over the coming weeks, and maybe months, we expect the price to be range-bound and then to put in a more meaningful bounce on the other side of Trump/administration uncertainty. That might take 1-3 months. But we're expecting a sideways grind before a move higher.
So, something similar to summer 2022. We'd look to bid into the $1,500's to then sell ETH at $2,160. That's the play we'd be looking at for ETH over the coming weeks/months. But, we do see $1,500's as a good long-term buying opportunity to then sell ETH later in the year or in early to mid 2026.
ETH risks drop toward $1,530
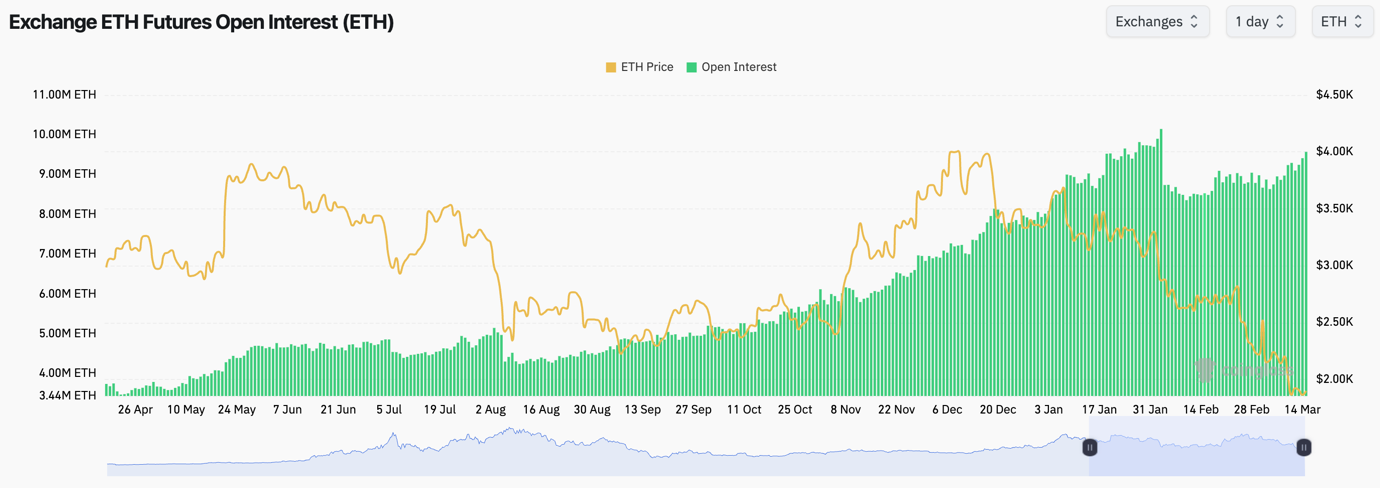
14 March 2025- ETH's Open Interest (by number of coins) still remains very high. Since the early February flush out, ETH's OI has climbed back close to its all-time highs, now just 5% down from its highs. This shows that there is still strong demand for the carry trade in ETH (Long Spot, Short Futures, profit from the Funding Rate).
- ETH's Funding Rate is just about positive, and it has fluctuated between slightly positive and negative. This indicates that there's no clear bias or confidence among traders.
Technical analysis
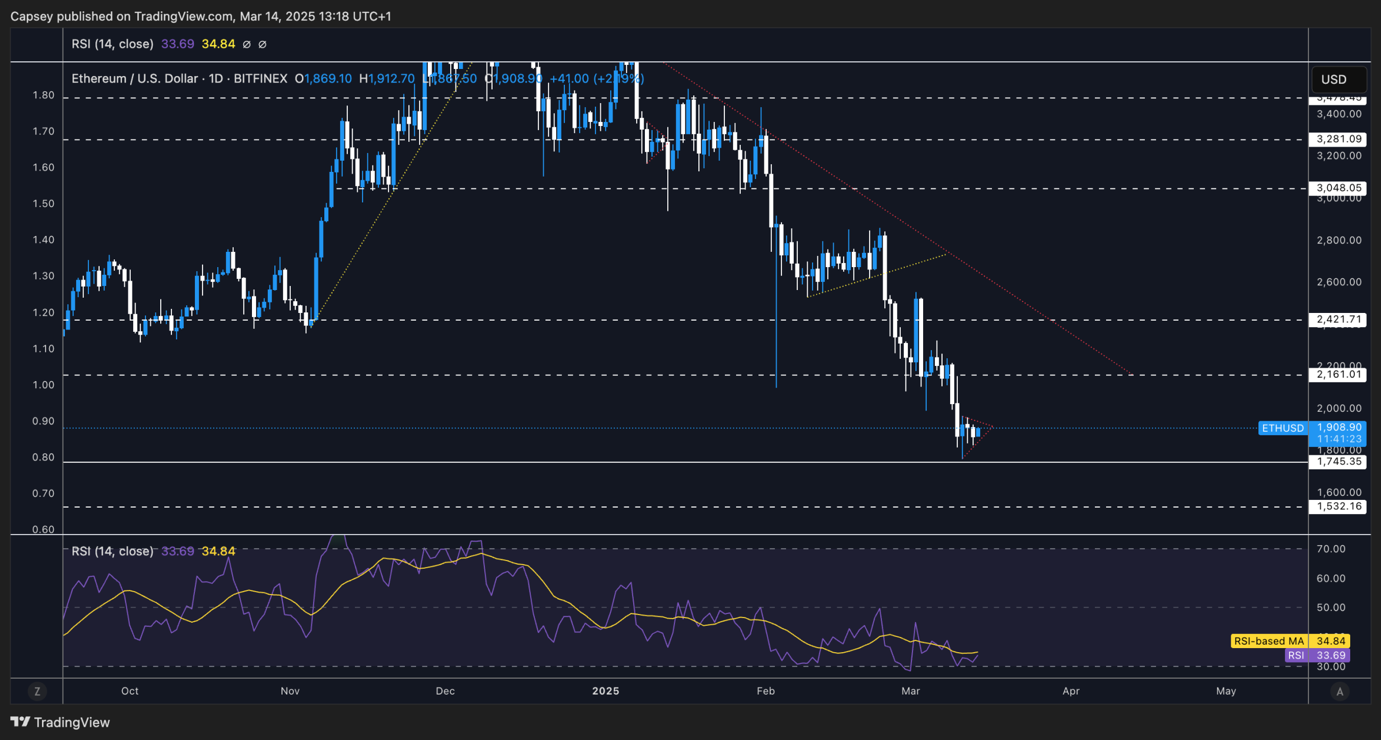
- A really ugly chart that has been essentially down only now for some time.
- We commented at the beginning of the week that ETH had just broken below the $2,160 horizontal support level, and it was butting up into it, essentially as new resistance. It wasn't reclaimed, and ETH dropped drastically lower.
- Price then bounced perfectly off of the $1,745 horizontal support and has since formed a pennant pattern.
- ETH is now forming a bearish pennant which has a bias to break lower. The target of this would be a move back down to $1,745.
- Interestingly, ETH's RSI has put in two bullish divergences now (lower low in price, higher low on the oscillator). This may help the price to bounce.
- If ETH can bounce (our confidence is low), then $2,160 would be the likely top-level target. We wouldn't expect the price to breach above this level in the near term.
- To the downside, if $1,745 is lost, then $1,530 is the next horizontal support.
- Next Support: $1,745
- Next Resistance: $2,160
- Direction: Neutral/Bullish
- Upside Target: $2,160
- Downside Target: $1,530
Cryptonary's take
Despite ETH forming a bearish pennant, and if this were to break down, we think the price can retest $1,745 and bounce again from that level. However, our thinking is that ETH can potentially bounce here in the short term and potentially find a local resistance of $2,160.We're not sure we'd bet on this, because essentially it would be trading against the trend, but we can also appreciate that this is likely due a relief rally in the short-term.
ETH’s next support stands at $1,745
10 March 2025Ethereum continues to underperform, struggling below key resistance, while Bitcoin also faces downside risk. Market sentiment remains cautious—will relief rallies emerge, or is more weakness ahead? Let’s dive into the latest crypto trends and price action.
- ETH's Open Interest remains mostly unchanged as traders continue to take advantage of the basis trade. This doesn't give us much signal from a trading perspective.
- ETH's Funding Rate has fluctuated between 0.01% and -0.01% as traders have flip-flopped in their positioning. Although Funding is contained, so by, there is little appetite amongst traders to make big leveraged bets.

Technical analysis
- From a technical perspective, ETH doesn't look good here.
- ETH has just lost the vital horizontal support at $2,160, with the next major support at $1,750.
- Yesterday, the price broke below the $2,160 support. The price has since moved up to $2,160 and was rejected from that level. Old support now may have been turned into new resistance.
- The RSI has broken out of its downtrend line, and it remains close to overbought territory. This could have helped towards ETH bouncing, but whilst the rice remains beneath $2,160, it's not a good setup for Longs.
- If $2,160 can be reclaimed, then $2,420 is the next horizontal resistance level.

- Next Support: $1,745
- Next Resistance: $2,160
- Direction: Neutral/Bearish
- Upside Target: $2,420
- Downside Target: $1,745
Cryptonary's take
ETH has just been such an underperformer for a long time now. With ETH now seemingly having lost this $2,160 horizontal support level, it's hard to get bullish on ETH anytime soon. We're expecting a slow move down to $1,745 in the coming weeks. In the immediate term, ETH might just keep butting up to $2,160 and rejecting into that level.ETH battles key levels as sentiment fades
04 March 2025As ETH clings to key support and BTC faces its own pullback, market sentiment stays fragile. Traders watch critical levels closely across major cryptos, eyeing the next big move. Let’s break down what’s happening across the board.
Disclaimer: This is not financial or investment advice. You are responsible for any capital-related decisions you make, and only you are accountable for the results.
ETH:
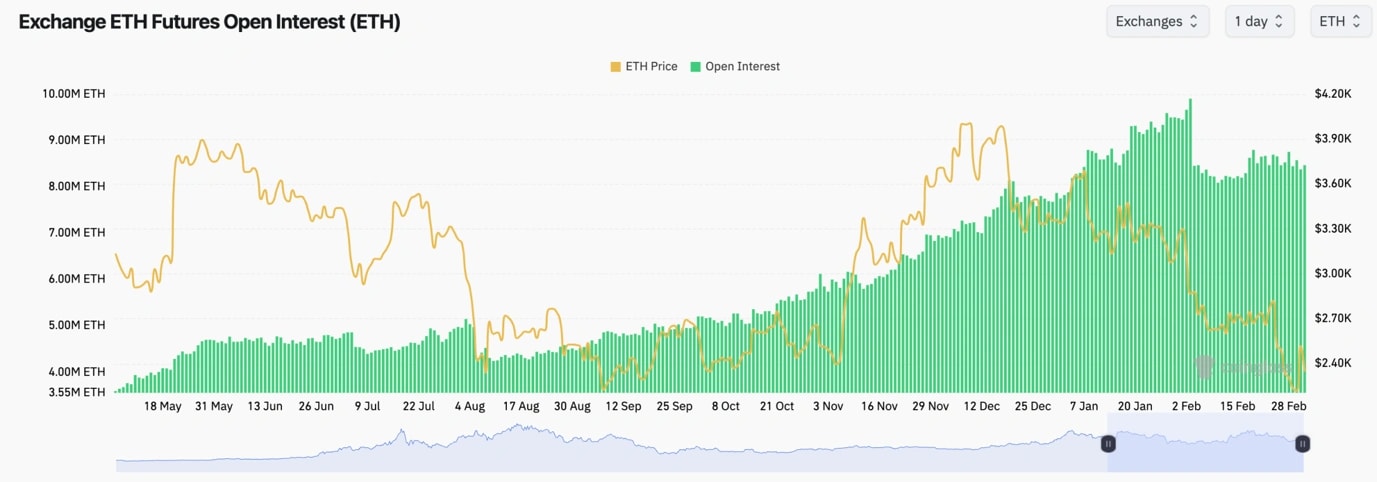
- Like Bitcoin, ETH's Funding Rate remained relatively flat (even balance between Longs and Shorts) whilst the Open Interest remained level also.
- This suggests that the price increase was spot-driven.
Technical analysis
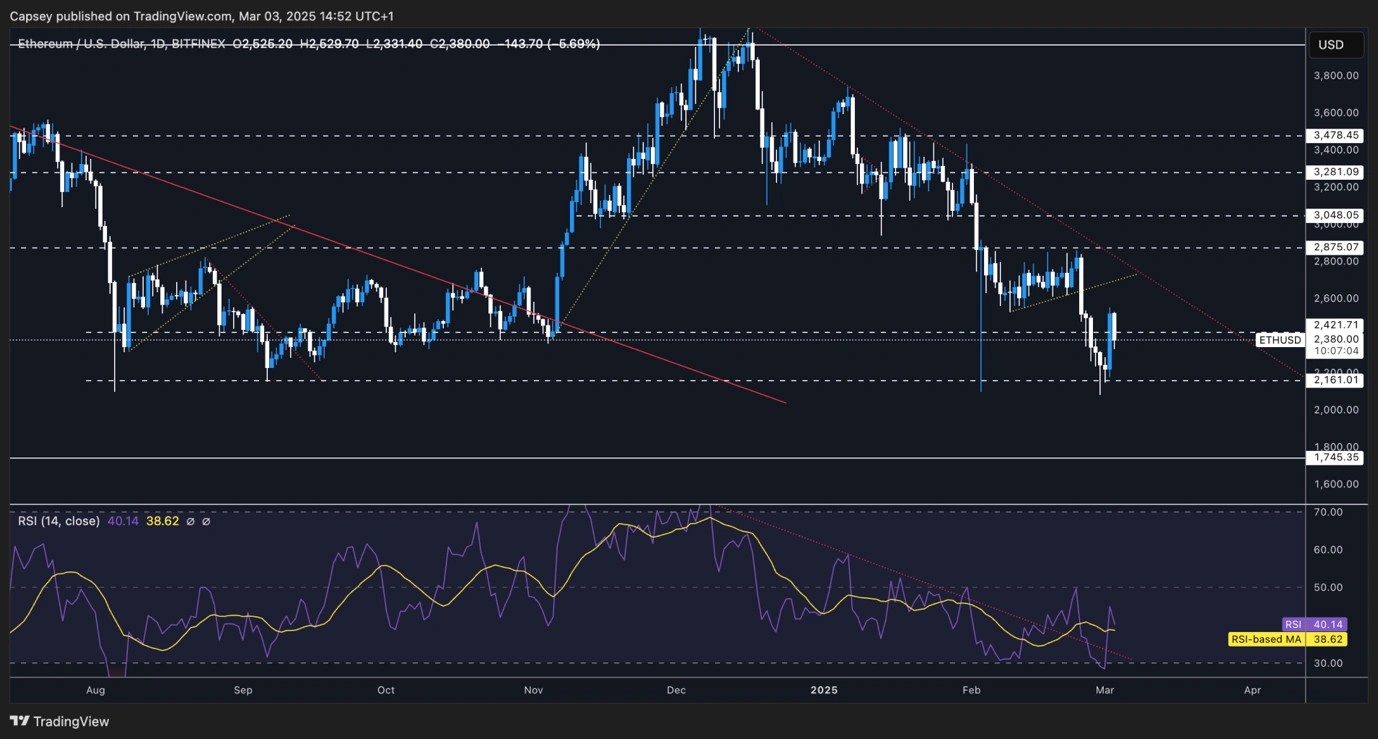
- ETH broke down to the last horizontal support at $2,160, and fortunately price was able to hold this level, and ETH bounced on yesterday's Trump tweet.
- Price is now battling at the $2,420 horizontal level. A reclaim of this and price can potentially be setup for a retest in to $2,600.
- The RSI has broken out of it's downtrend, and it's sat on top of it's moving average. This is perhaps the only positive element of the chart currently.
- The key supports are $2,160 and then if that's lost, $1,745.
- Next Support: $2,160
- Next Resistance: $2,420 (then $2,600)
- Direction: Bearish
- Upside Target: $2,600
- Downside Target: $1,745
Cryptonary's take:
Despite the positivity and the whip-saw to the upside in general sentiment following Trumps tweet yesterday, if we look at the ETH chart, it looks pretty poor here. It's possible in the short-term we see price just grind along and chop between $2,160 and $2,600 (more likely $2,420).And then in the upcoming month, potentially we see ETH break down to $1,745. We're not bullish on any timeframe on ETH here to be quite frank. Look at that chart and zoom out, it's hard to see where the bullish turn will come from as well. For now, we're sitting watching this and expecting more chop, and then a downside from there to say the $1,745 level.
$2,420 ETH support in focus
24 February 2025Ethereum faces rejection at $2,875 while funding rates remain mixed. With key support at $2,420, traders watch for either a breakout or further downside in the coming weeks.
- ETH's Open Interest has moved up from the lows very slightly, but it still remains well below the highs we saw before the flush out.
- ETH's Funding Rate has fluctuated between positive and negative, indicating that traders have flip-flopped between Longing and Shorting.

Technical analysis
- ETH has bounced from the $2,500 level and it's moved up to the local horizontal resistance of $2,875, where it has (for now) rejected, as we expected it to. $2,875 to $3,050 is the resistance zone. For now, we expect this resistance zone to hold.
- There is local support for ETH at $2,655, with the major support at $2,420.
- We're now also seeing the formation of a local uptrend line (yellow line). A break below this line could propel a larger move to the downside.
- The RSI has broken out of its main downtrend, it's moving higher and is using its moving average as support. This is one of the few elements of the TA.

- Next Support: $2,650 (then $2,420)
- Next Resistance: $2,875
- Direction: Bearish
- Upside Target: $2,875
- Downside Target: $2,420
Cryptonary's take
It's possible we see a positive outcome over the coming weeks, although we still favour the negative outcome (downside). The positive outcome would be price grinding into the main downtrend line and the horizontal resistance of $2,875, and then breaking out to the upside. The negative outcome is just a rejection into this converging resistance zone, and then the price makes new lows, likely at the $2,420 support.ETH RSI positive, Eyes $2,875 target
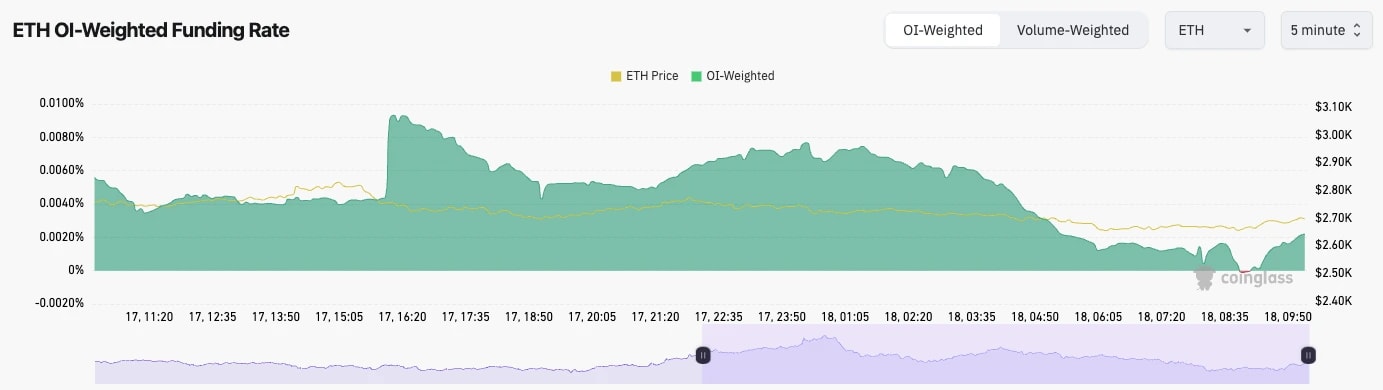
18 February 2025Ethereum ($ETH) remains range-bound, struggling to break above $2,875 while support at $2,500 holds. With resistance at $3,050, can ETH flip bullish, or is a drop to $2,420 next? Let’s analyze the latest price action.
Disclaimer: This is not financial or investment advice. You are responsible for any capital-related decisions you make, and only you are accountable for the results.
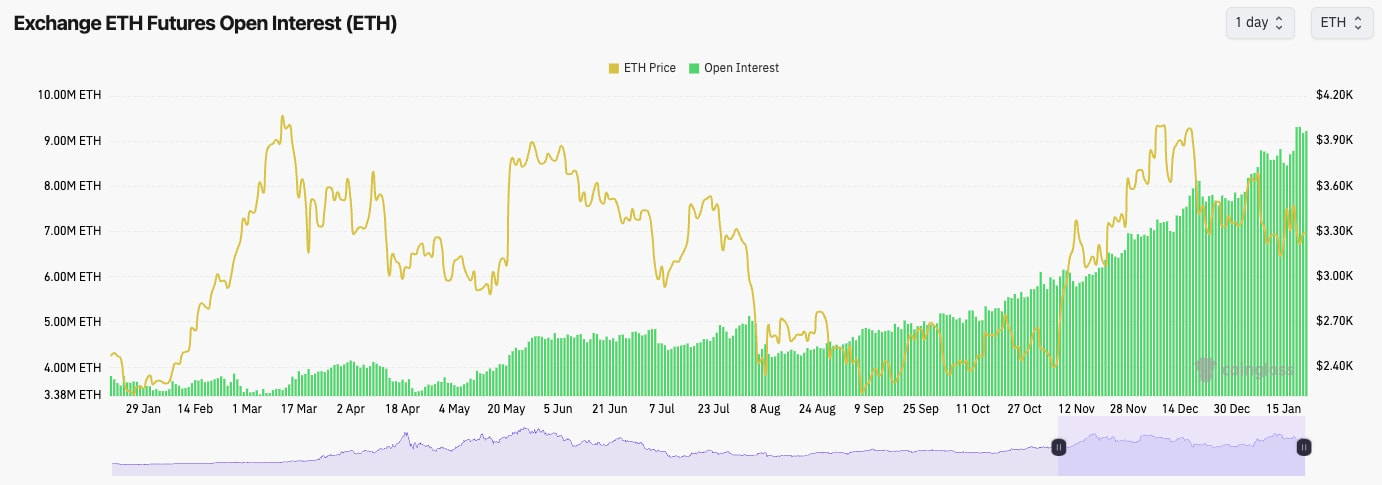
- ETH's Open Interest pulled back substantially on the price puke out in early February. Open Interest then bottomed off and has started rising again.
- ETH's Funding Rate isn't negative, but it is only just positive. This suggests that a fair portion of the open interest that has been recently added is in Shorts.
Technical analysis
- ETH has been range-bound at the new lows between $2,500 and $2,900.
- The horizontal resistance is at $2,875. We would need to see this level flipped and reclaimed in order to flip bullish again. However, just beyond this level, $3,050 is also a large resistance. So ETH has two big resistances within just a 10% move higher for price.
- Currently, there is local support at $2,700, but the main horizontal support is at $2,420.
- The RSI is the most positive aspect of ETH. It's broken out of its downtrend line, and it's also now nicely above its moving average.
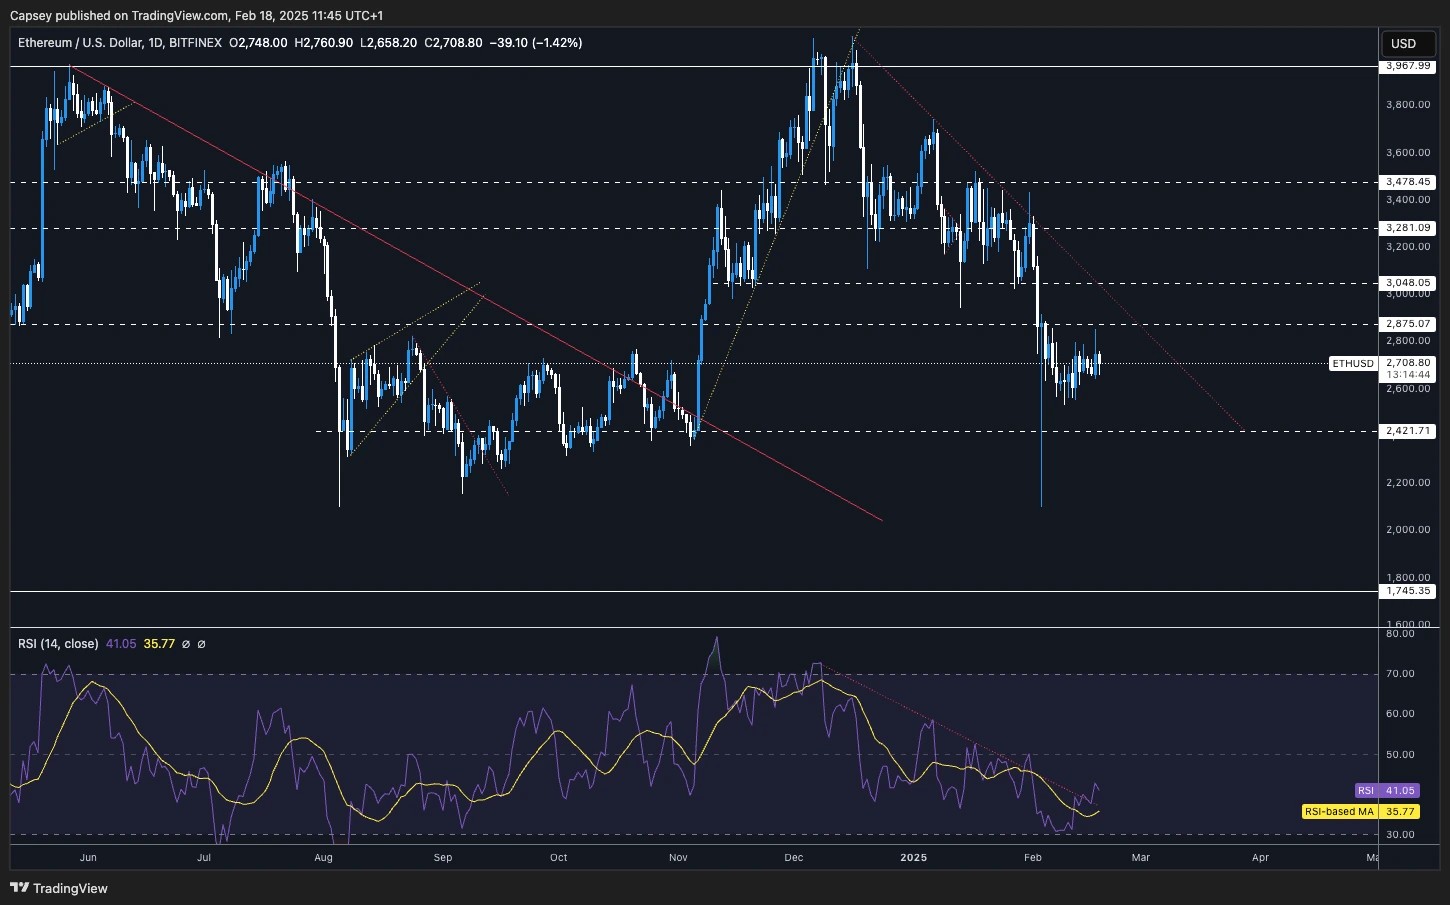
- Next Support: $2,500
- Next Resistance: $2,875
- Direction: Neutral/Bearish
- Upside Target: $2,875
- Downside Target: $2,420
Cryptonary's take
It's hard to get bullish on ETH here. We're now just generally used to lacking performance, and then when you look at the chart, ETH is below two heavy horizontal resistances; $2,875 and $3,050.For now, we'd just remain patient with ETH, and whilst we still don't see the macro as majorly supportive, this would suggest to us that ETH can revisit the $2,420 area as a minimum in the coming weeks/months.
ETH drops 16% in liquidation event
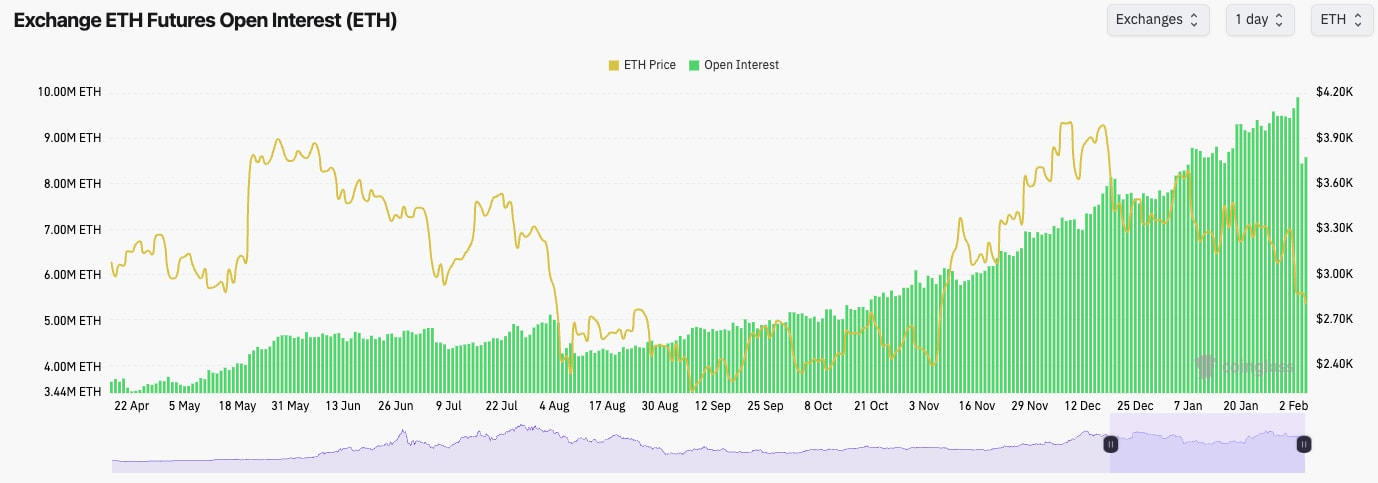
04 February 2025Ethereum’s open interest plunged 16% in a major liquidation event. ETH struggles to hold $2,600 support, while traders face market indecision with fluctuating funding rates and uncertain breakout potential.
Disclaimer: This is not financial or investment advice. You are responsible for any capital-related decisions you make, and only you are accountable for the results.
- ETH's Open Interest plummeted over the last 48 hours, showing that this was a large leverage washout event.
- ETH's Open Interest (by number of coins) fell by 16%.
- ETH's Funding Rate was very negative on Monday, but it has now returned to slightly positive. However, funding keeps flip-flopping between positive and negative, showing indecision among traders, who are most likely being chopped up.
Technical analysis
- ETH rejected into the horizontal resistance of $3,480. A failed breakout then sent the price to $3,280, which also couldn't hold.
- The capitulation event sent ETH well below the next horizontal support of $2,420, but the price has recovered and is now trying to stabilise around the Yellow Box - which has now been filled, as we called for.
- $2,600 is the next horizontal support, whilst $2,875 is the next horizontal resistance.
- ETH's RSI is close to being oversold, and it remains well below its moving average.
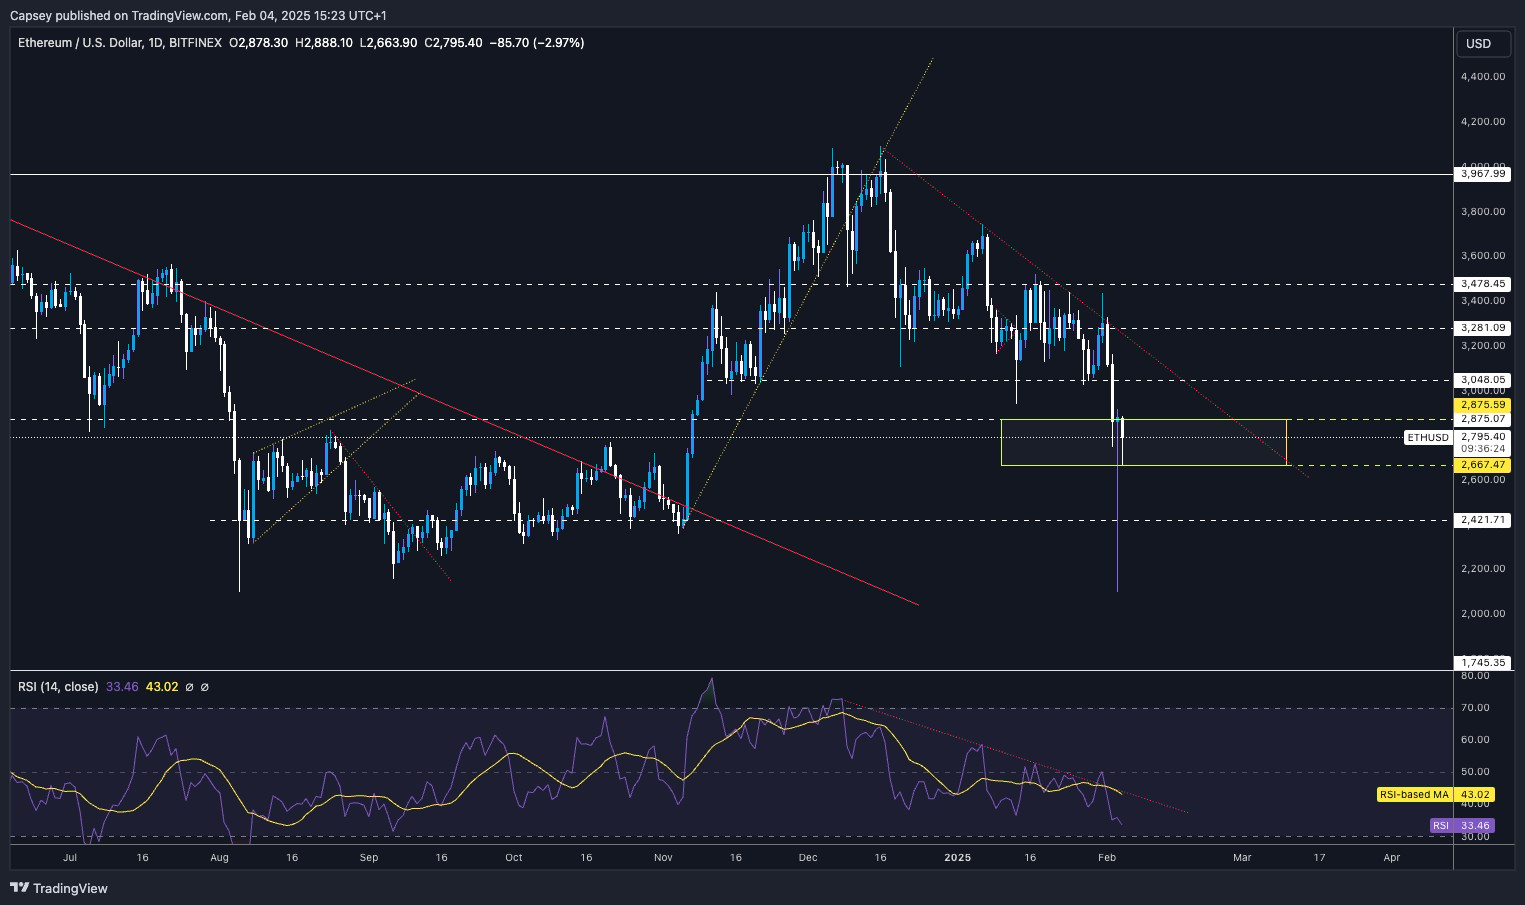
- Next Support: $2,600
- Next Resistance: $3,050
- Direction: Bearish/Neutral
- Upside Target $3,050
- Downside Target: $2,400
Cryptonary's take
We'd expect the price to take some time to establish a new range here, likely between $2,600 and $3,050. Whilst the price remains in the downtrend, we'd expect it to be range-bound, and therefore, we're not expecting any major breakouts anytime soon. If the price were to revisit the $2,300's, that might be worth a bounce play. But, other than that, we're not too interested in ETH at this moment in terms of trading opportunities.ETH eyes $3,700 after breakout
31 January 2025Ethereum is testing key levels at $3,280 and $3,480, struggling to break out. Meanwhile, Bitcoin holds its range, and the market remains uncertain. Will ETH rally or retest $3,050 first? Let’s break down the key price action.
Disclaimer: This is not financial or investment advice. You are responsible for any capital-related decisions you make, and only you are accountable for the results.
Technical analysis
- ETH is interesting here. The price bounced off the main horizontal support of $3,050.
- Price is now attempting a break above the horizontal level of $3,280 whilst it's also looking to break out of the main downtrend line.
- The key for a major breakout here will be for the price to break the main horizontal resistance at $3,480.
- If the price can break out at $3,480 (we're sceptical in the short-term), then $3,700 is the target.
- The RSI is also attempting a breakout above the downtrend line and the moving average. We really need to see this move stick to potentially see a more substantial upside.
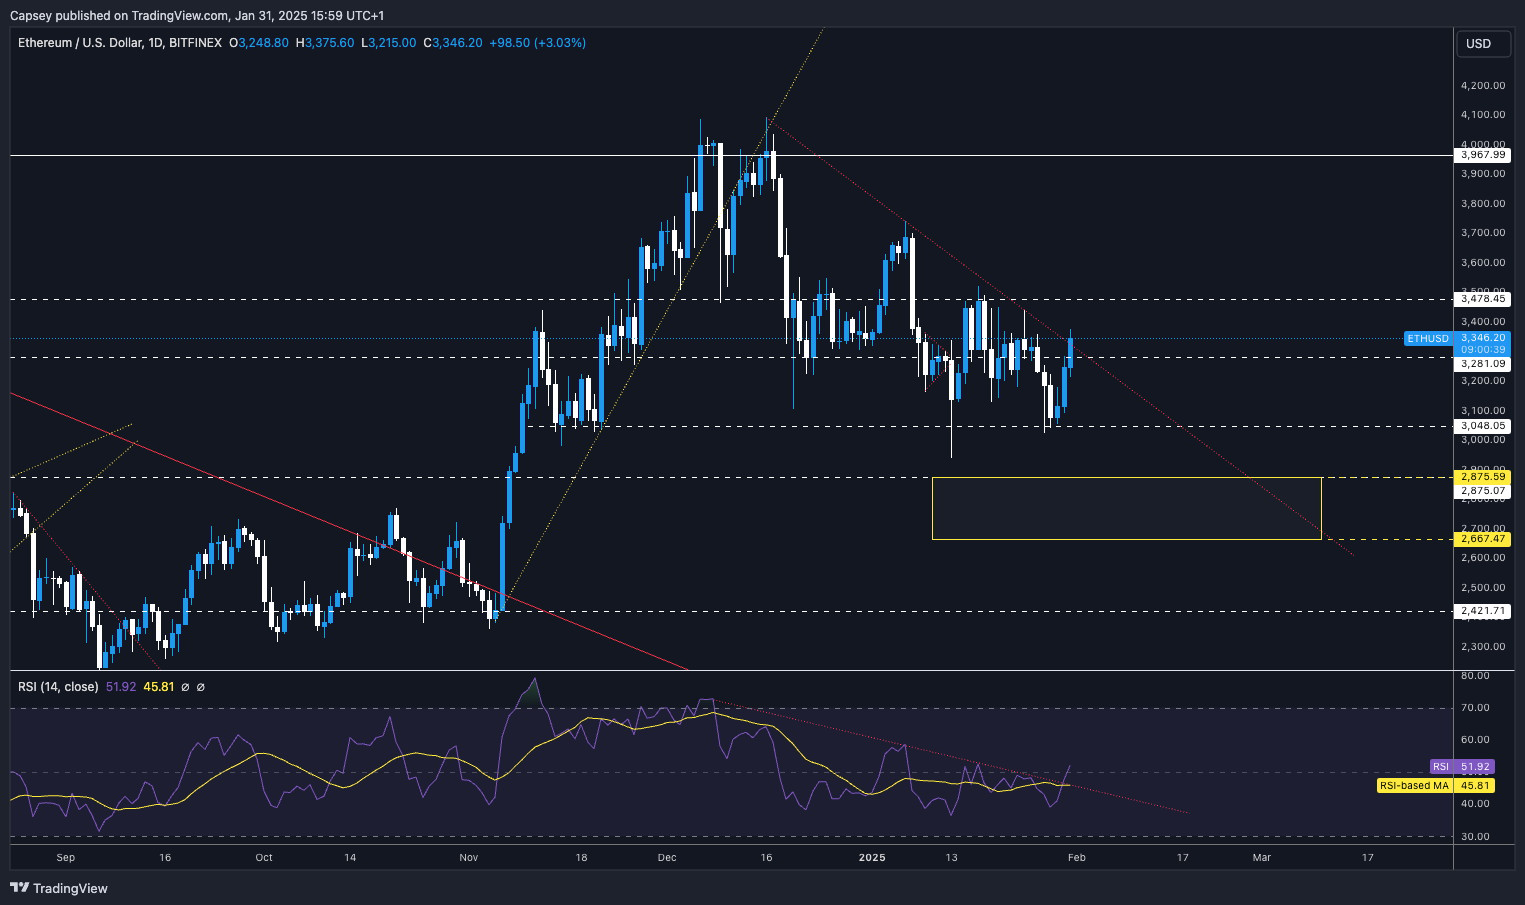
- Next Support: $3,280
- Next Resistance: $3,480
- Direction: Neutral
- Upside Target: $3,700
- Downside Target: $3,050
Cryptonary's take
ETH is at a really key level here as it is trying to break out. A breakout of the downtrend line and $3,480 horizontal resistance is a big ask, so we are sceptical. But this is what's needed to get that breakout.If the price were to break out, it would be a huge sign-off strength, and this may actually lead to other plays/sectors also having more substantial rebounds. Unfortunately, we're not expecting a substantial breakout in the short term, and we're still thinking that ETH can revisit $3,050 before it touches the Yellow Box. But we're expecting $3,050 as a minimum retest again.
ETH breaks below $3,280 – What’s next?
28 January 2025Ethereum remains stuck in a tight range, failing to break above $3,280 resistance while holding $3,050 support. With high open interest and a balanced funding rate, will ETH finally see a breakout? Let’s analyze the market action.
Disclaimer: This is not financial or investment advice. You are responsible for any capital-related decisions you make, and only you are accountable for the results.
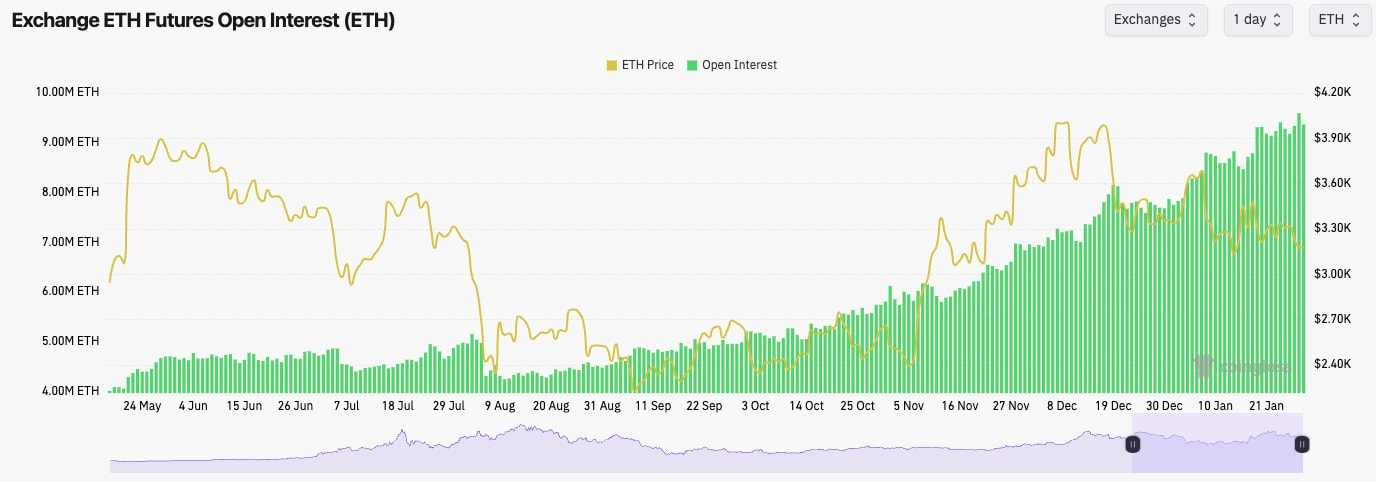
- ETH's Open Interest is still sky-high due to the cash-and-carry trade. It's becoming somewhat pointless to look at ETH's OI because of this.
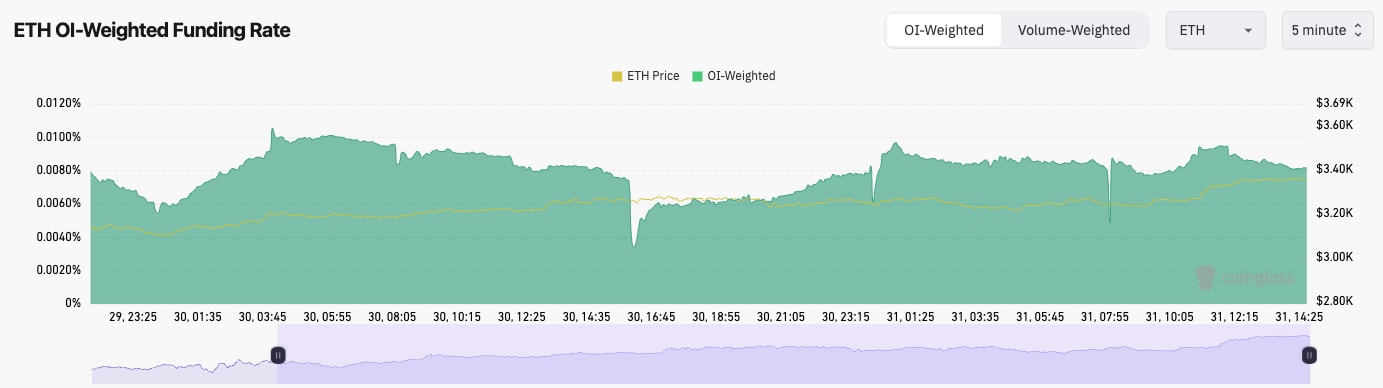
- ETH's Funding Rate is at 0.008%, suggesting there's an even mix of Longs and Shorts.
Technical analysis
- ETH has broken down from its main horizontal resistance of $3,480 and is also rejected at the main downtrend line.
- Price has then broken below the next horizontal level of $3,280, but we are seeing the $3,050 hold as support for now.
- The RSI is in middle territory, but it's in a downtrend and also below its moving average.
- The key breakout will be a move above $3,480 and a break above the downtrend line.
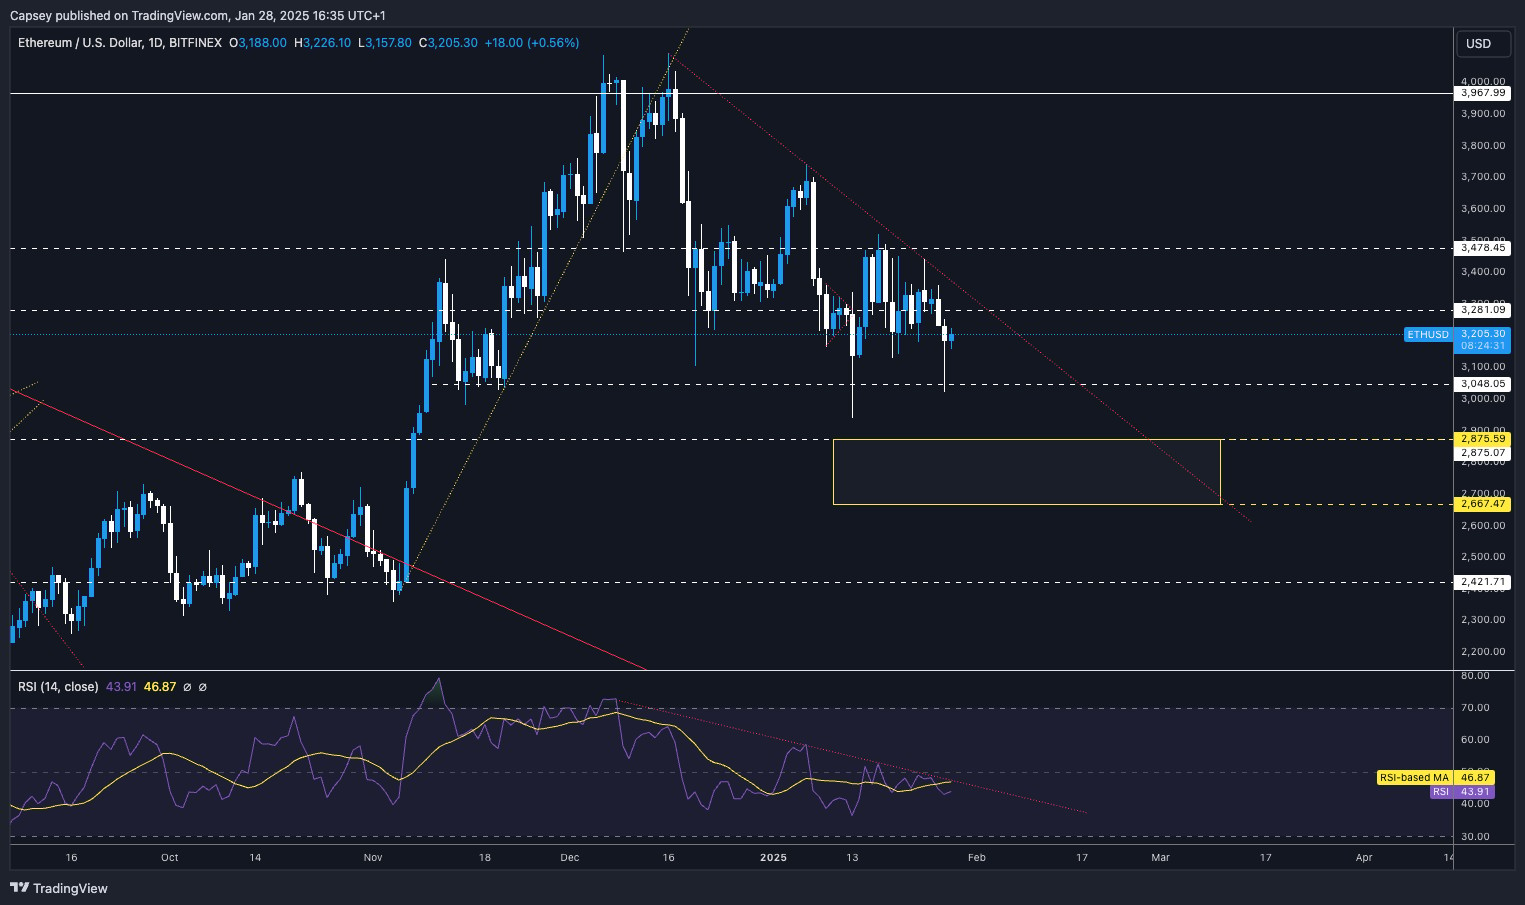
- Next Support: $3,050
- Next Resistance: $3,280 (then $3,480)
- Direction: Neutral/Bearish
- Upside Target: $3,280
- Downside Target: $2,900
Cryptonary's take
ETH has been pretty boring here, and there isn't a mega-development beyond our last update. However, the new information we have is that ETH hasn't broken out of its downtrend line, and it's now also below the horizontal level of $3,280 - last time, it was butting up to $3,480 (the key breakout level).It's possible ETH can move back up to $3,400 - $3,500; however, we wouldn't be surprised if the Yellow box is eventually filled in the coming weeks. Again, this is another that we'll wait on for it to show us direction.
ETH targets $3,700 after $3,480 break
24 January 2025Ethereum ($ETH) is at a critical point, holding $3,280 support while testing $3,480 resistance. Will ETH break out toward $3,700, or face a potential rollover? Let’s dive into the latest market analysis
Disclaimer: This is not financial or investment advice. You are responsible for any capital-related decisions you make, and only you are accountable for the results.
- ETH's funding rate is 0.01%, which indicates an even mix between longs and shorts.
- The Open Interest for ETH remains really high, and alongside that, we've seen Spot purchases not be as strong.
Technical analysis
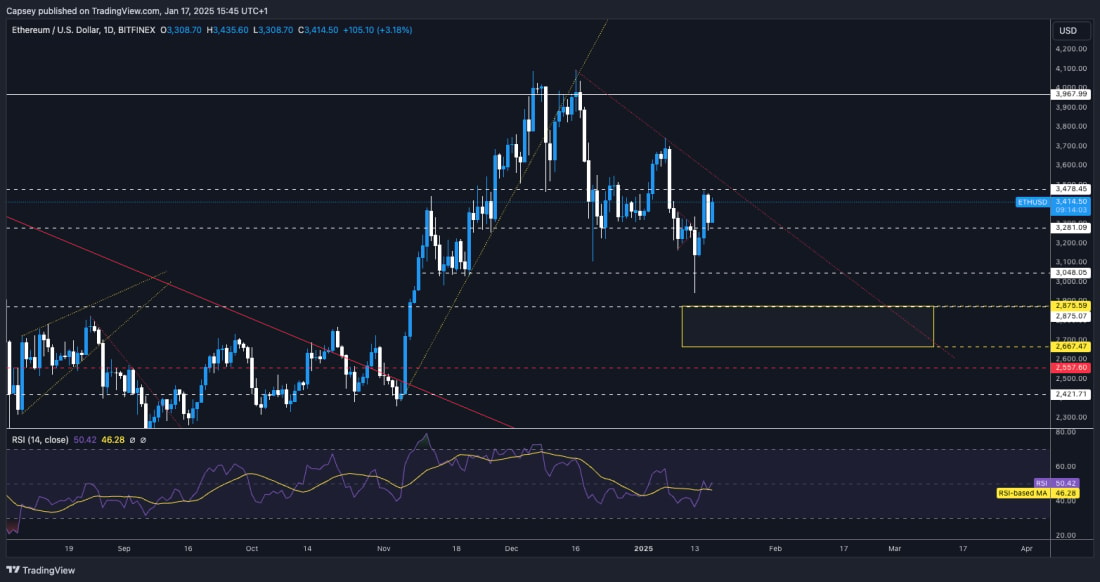
- ETH is beginning to look more interesting here from a TA perspective.
- We have ETH, having been able to hold the lows/the supports at $3,150, and the price has now reclaimed $3,280 and is pushing onto the main horizontal resistance of $3,480.
- The $3,480 horizontal resistance also converges with the main downtrend line. If the price can break out of these converging resistance areas, then the price will likely swiftly move up to $3,700.
- ETH's RSI is now also battling at its uptrend line and looking for a breakout.

- Next Support: $3,280
- Next Resistance: $3,480
- Direction: Neutral
- Upside Target: 3,700
- Downside Target: $3,050
Cryptonary's take
Key decision time here for ETH. It's managed to hold the lows and move higher, with it now really testing the main resistance levels (the horizontal resistance at $3,480 and the main downtrend line). We need to see ETH get some follow-through here. Otherwise, confidence may be lost again, and we might see a price rollover and retest of $3,050.The key decision for ETH is here. If it can be helped/pushed by the rest of the market, then that's great, as that's what it may need.
Ethereum finds support at $3,140
21 January 2025Ethereum battles $3,480 resistance as its RSI trends downward, while BTC shows signs of strength. Will key catalysts push the market toward a breakout? Let’s explore the latest trends and opportunities.
Disclaimer: This is not financial or investment advice. You are responsible for any capital-related decisions you make, and only you are accountable for the results.
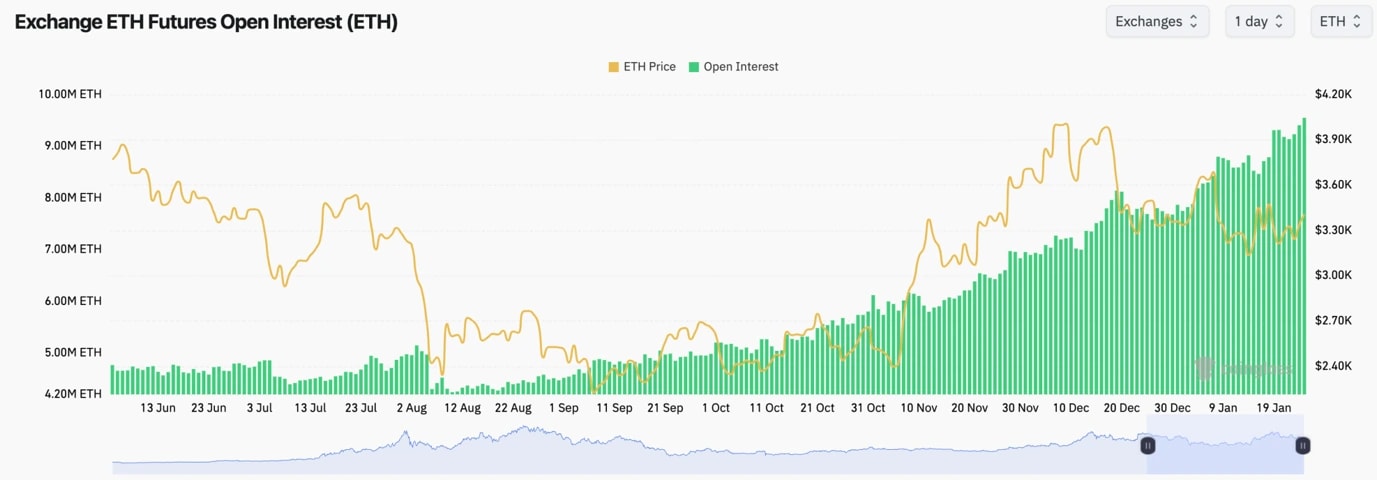
- ETH's Open Interest just continues to soar. This is likely TradFi taking advantage of the 'cash-and-carry' trade alongside protocols/mechanisms like Ethena.
- Funding is at 0.01%, so there is an even balance between Longs and Shorts.
- The signals aren't that clear or decisive here.
Technical analysis
- ETH remains range-bound between the major horizontal resistance of $3,480 and the local support of $3,140 (this is a new level).
- There are also other key horizontal levels to monitor: $3,050 and $3,280.
- ETH remains in its main downtrend, and to see a major bull reversal, we'll need to see the price breakout of the downtrend and also the horizontal resistance of $3,480.
- The RSI is also in a downtrend, and it hasn't yet broken out, whilst it's currently battling to remain above its moving average.
- Next Support: $3,140
- Next Resistance: $3,480
- Direction: Neutral
- Upside Target: $3,700
- Downside Target: $3,050
Cryptonary's take
Like BTC, ETH doesn't really look either here or there. Although arguably, BTC has shown some strength, whereas ETH has just held its level, it seems to be losing a bit of momentum. This week remains a tricky week to navigate, with the market just essentially waiting on Executive Orders from Trump.If there is a sell-off, and we think this is still possible for ETH to achieve, then $3,050 is likely the minimum target. But, if Trump issues very pro-Crypto executive orders, then this could see ETH get the breakout that it really needs.
ETH targets $3,700 upside soon
17 January 2025ETH struggles to break $3,480 resistance despite strong RSI. BTC's rally drives optimism. Trump’s policies next week could shape crypto momentum.
Disclaimer: This is not financial or investment advice. You are responsible for any capital-related decisions you make, and only you are accountable for the results.
- The Open Interest in ETH didn't even pull back. There's a huge amount of OI on ETH currently. This may be due to new market mechanisms/protocols such as Ethena.
- The Funding Rate is also back to 0.01%, indicating a balance between bulls and bears (Longs and Shorts).
Technical analysis
- ETH wicked into the $2,900's and was close to filling the Yellow box. However, it got a strong bounce, and the price rebounded swiftly into the main horizontal resistance at $3,480.
- Price is now range-bound between the horizontal support of $3,280 and the horizontal resistance of $3,480.
- ETH remains in a downtrend, and for this to bull reverse, it'll need a breakout of the $3,480 and the main downtrend line.
- The RSI is looking better/good here, and it's now resting on top of its moving average. Being in the middle territory, this has room to go higher here.
- A break below $3,200 - $3,280, and ETH likely pulls back to $3,050.
- Next Support: $3,280
- Next Resistance: $3,480
- Direction: Bullish
- Upside Target: $3,700
- Downside Target: $3,050
Cryptonary's take
Unlike BTC, ETH hasn't broken out of its downtrend currently. For the full bull reversal, we'll need to see ETH break out of the downtrend and reclaim comfortably back above $3,480. However, similar to BTC, a lot of the short-term forecasts rely on Trump next week.If it's better than what the market expects, then the price can break out; if not, then a sell-down. It's hard here; it depends on what Trump does next week. If Trump delivers, then I'd expect to see ETH break out. If the opposite is true, then the $3,200's can be tested.
Yellow buy box: $2,660-$2,875 range
13 January 2025ETH struggles below $3,280 resistance, with RSI nearing oversold levels. Key supports include $3,050 and the Yellow Buy Box ($2,660-$2,875) for potential recovery.
Disclaimer: This is not financial or investment advice. You are responsible for any capital-related decisions you make, and only you are accountable for the results.
- ETH Open Interest is frightening. It just keeps soaring higher.
- ETH's Funding Rate is at 0.005%, which again shows a balance between Longs and Shorts.

Technical analysis
- ETH had a nasty rejection on Jan 7th, which was the jobs data, and it lost the key horizontal level of $3,280 just days later, breaking down from the bearish pennant.
- On the upside, the key level for ETH to reclaim is $3,480, although the price is 15% away from there currently.
- ETH has now moved down into the local horizontal level of $3,050, where we have initially seen some bids come in, and the price is holding up for now. Beneath $3,050, the next horizontal level is at $2,875, with the Yellow Buy Box going down to $2,660.
- The RSI has moved down drastically and now just sits above oversold territory, although there aren't any bullish divergences yet.
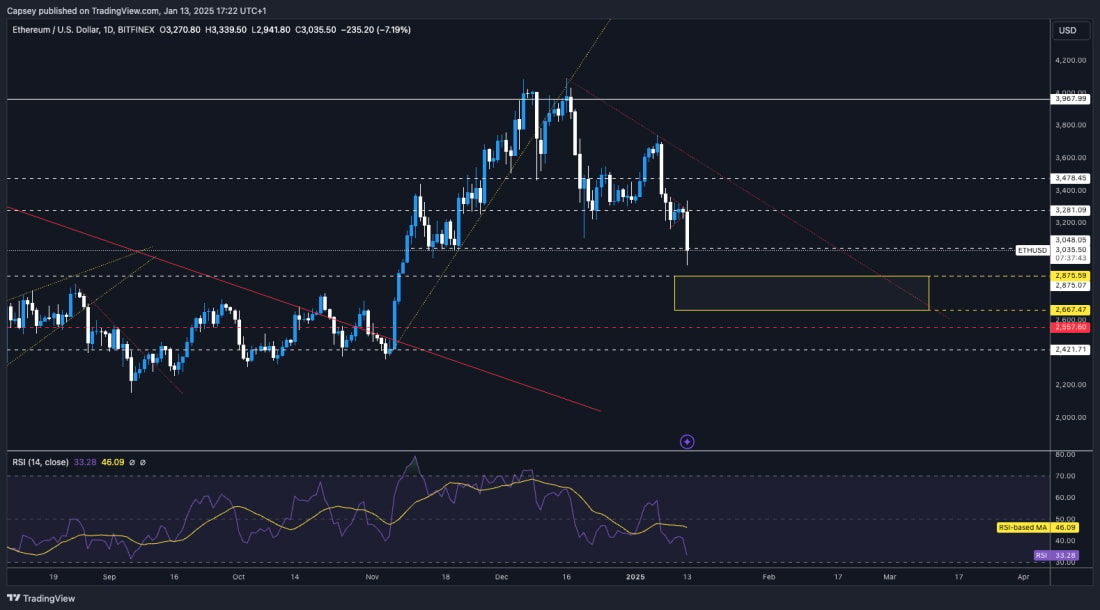
- Next Support: $3,050
- Next Resistance: $3,280
- Direction: Bearish
- Upside Target: $3,280
- Downside Target: $2,660 - $2,875
Cryptonary's take
ETH has pulled back substantially, but it is close to approaching the Yellow Buy box, whilst the RSI is also close to being overbought. What we'd like to see is a price to pull back to the Yellow Buy box and remain range-bound for a period. In this period, we'd like to see 1 or 2 bullish divergences (lower low in price, higher low on the oscillator) build up. That would be the indication for us to potentially Buy/Long.We wouldn't be surprised to see ETH either range here in a tight area for a few days or break lower. We're expecting an upside at some point, but not in the immediate term. We have the inflation data on Wednesday, and a hot print could be what sends ETH into the Yellow Buy box. Let's see.
Ethereum moves toward $4,000 resistance zone
06 January 2025Ethereum ($ETH) surges above $3,480 resistance, targeting $3,970 and $4,000 as leverage resets. RSI confirms bullish momentum with room for further upside.
Disclaimer: This is not financial or investment advice. You are responsible for any capital-related decisions you make, and only you are accountable for the results.
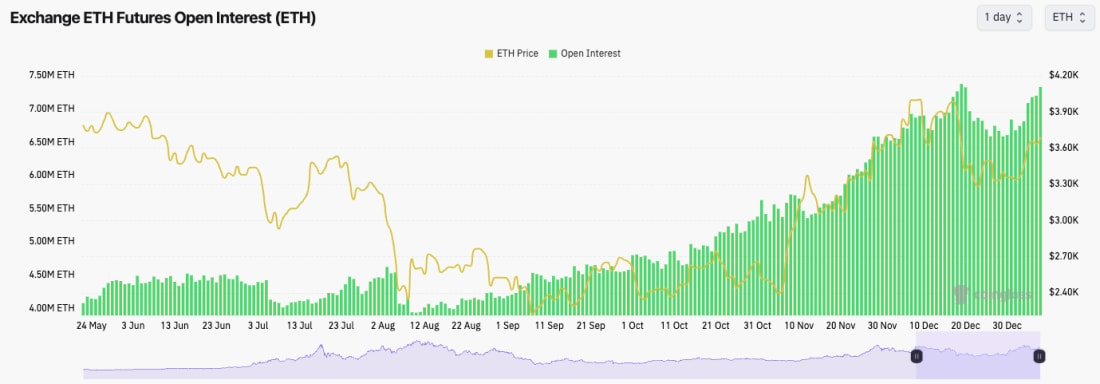
- It's really interesting to see that ETH's OI (by number of coins) is back to its highs. This shows that a lot of leverage has been put into ETH recently.
- ETH's Funding Rate is flat at 0.01%, meaning that the increased Open Interest is a relatively even mix of Longs and Shorts.
- This leverage setup is likely TradFi players taking advantage of the basis trade - Long the ETH ETF, Short the Futures, and take the Funding Rate as the arbitrage risk-free.
Technical analysis
- Exactly what we were expecting and looking for: a clean break above the range resistance at $3,480.
- $3,700 is a local resistance, but it might just be a short-term stopping point before ETH ends up heading higher to $4,000 again.
- If there is a more meaningful pullback (we're not expecting one), then $3,480 is likely to be old resistance now flipped into new support.
- The RSI has broken above its moving average, and at 58, it's still a long way from even being close to overbought. More upside likely.
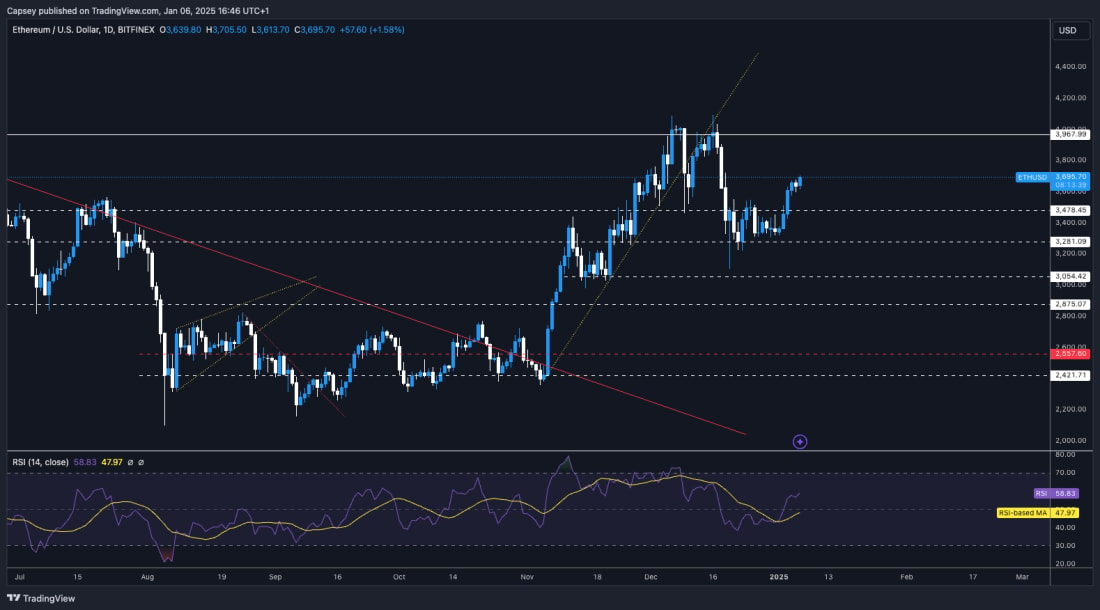
- Next Support: $3,480
- Next Resistance: $3,970
- Direction: Bullish
- Upside Target: $3,970
- Downside Target: $3,480
Cryptonary's take
Again, it was a really nice and clean move higher than we perfectly called in our last Market Direction. ETH is now in this higher range between $3,480 and $3,700. There's likely more upside to be had even if the price sits still for a few days first, but we are expecting a retest of $3,970 in the coming 7-10 days. All conditions look good here for it; let's see if we get it.Ethereum moves toward $4,000 resistance zone
31 December 2024Ethereum ($ETH) holds $3,280 support while aiming for $3,700. A 10% OI pullback has reset leverage, creating an opportunity for fresh momentum in the coming days.
Disclaimer: This is not financial or investment advice. You are responsible for any capital-related decisions you make, and only you are accountable for the results.
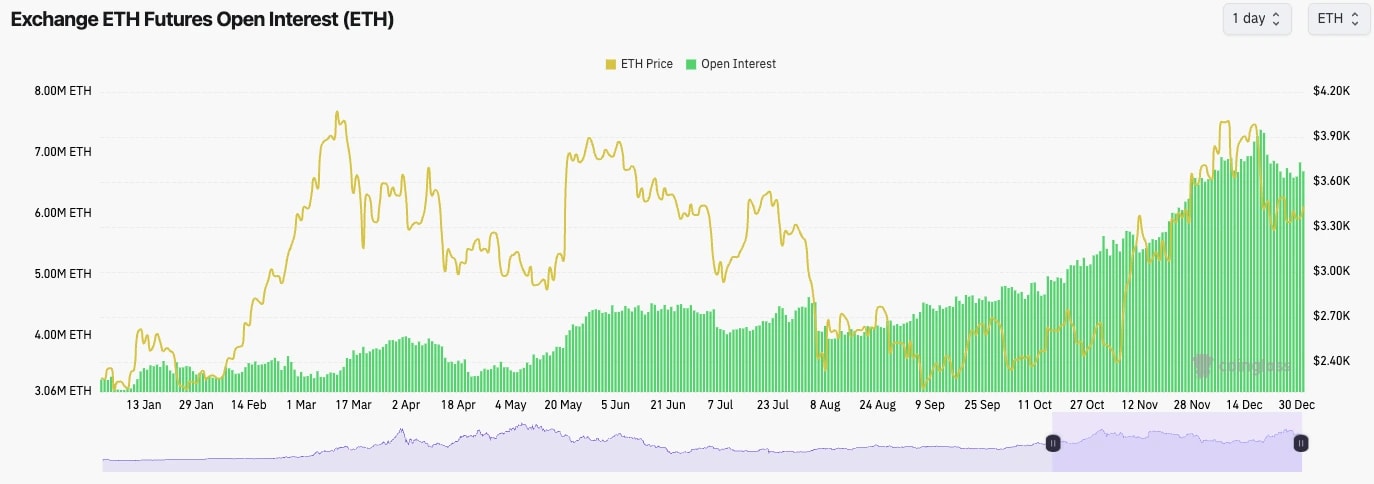
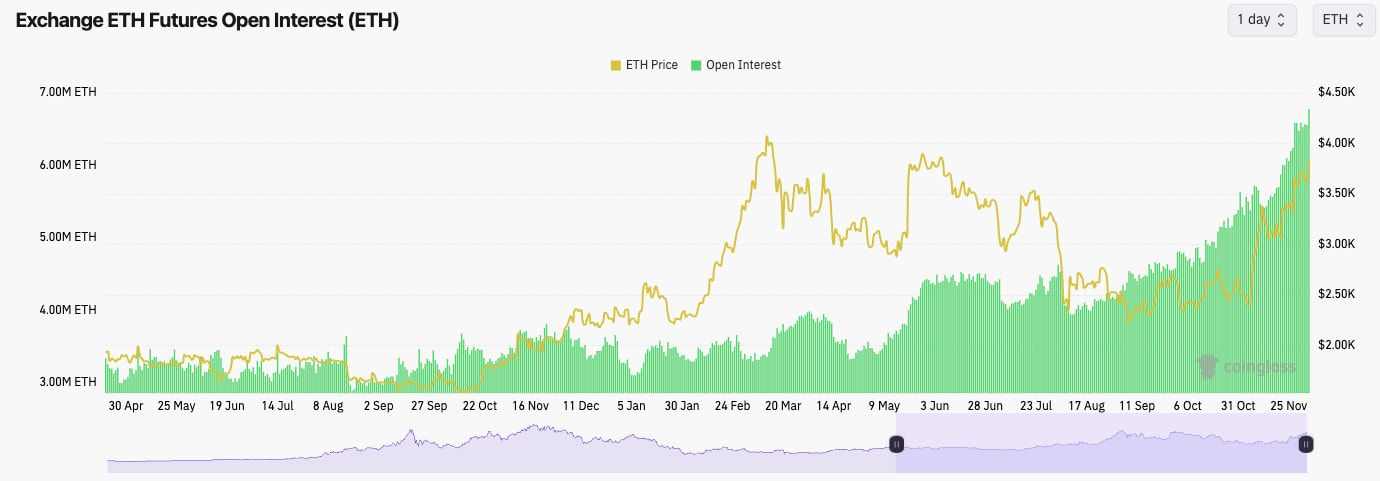
- ETH's Open Interest is also down approximately 10% from its highs, although it has started moving higher again in the past few days. Perhaps traders are looking to get exposure to ETH going into the New Year.
- The Funding Rate for ETH is at 0.01%, indicating a healthy dynamic between Longs and Shorts. Funding isn't skewed in either direction for now.
Technical analysis
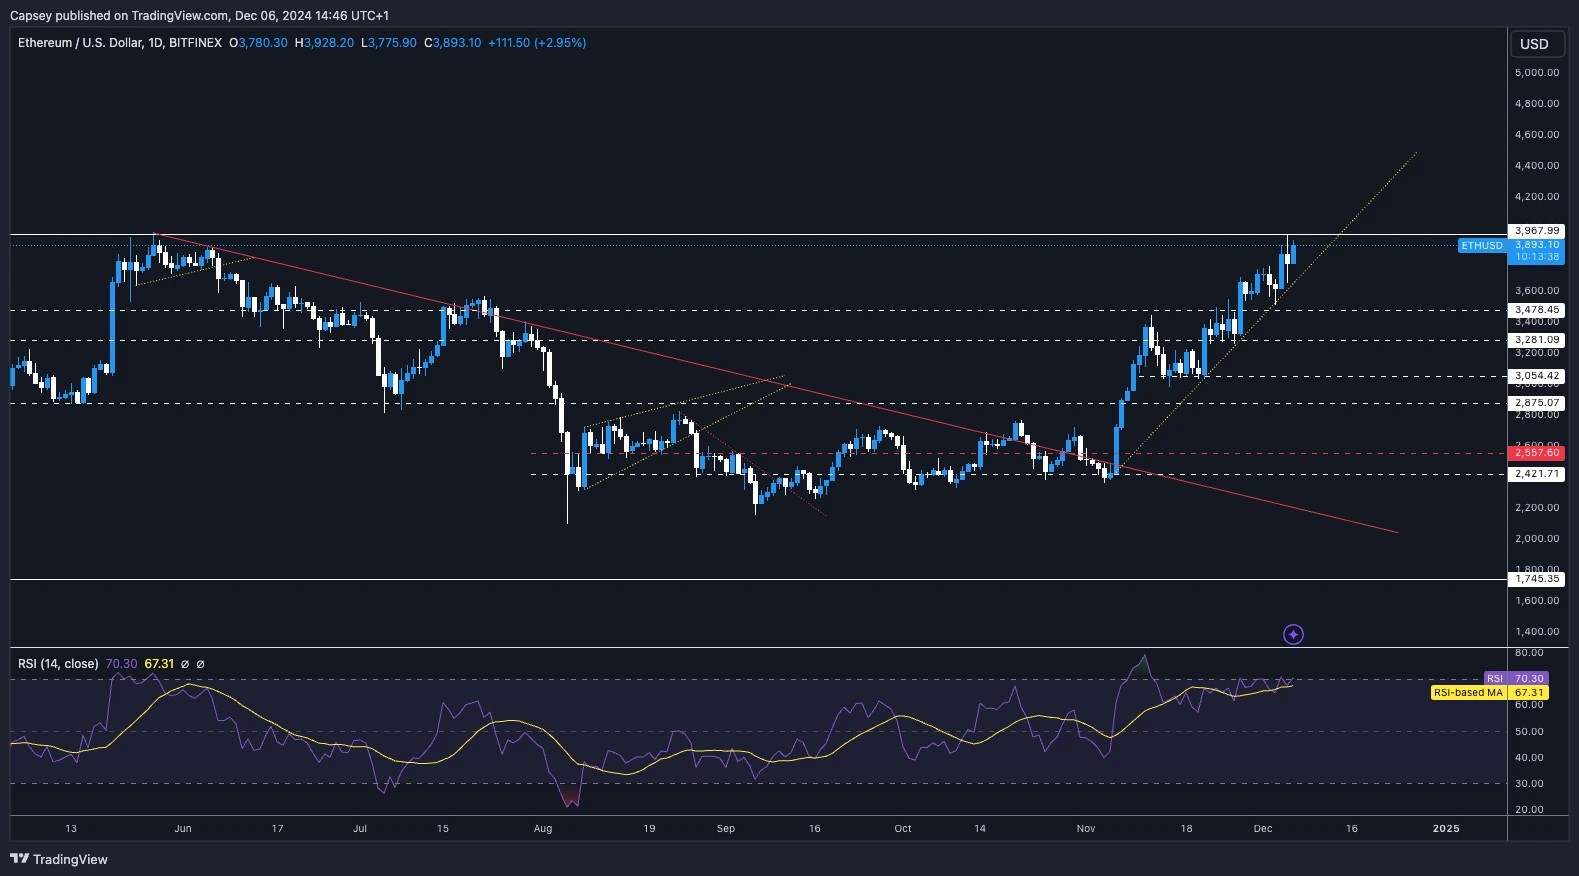
- Overall, it is a really interesting chart with prices respecting key levels.
- The price was rejected on the underside of the uptrend line, and the horizontal resistance was at $3,967.
- Price has since pulled back to the low $ 3,00,0, and it has been mostly range-bound between the horizontal support of $3,280 and the horizontal resistance of $3,480.
- A break out of $3,500 likely sends the price swiftly back to $3,700.
- The RSI is in the middle territory at 47, but it is breaking above its moving average. This could see price follow through a push up to $3,700 in the immediate term.
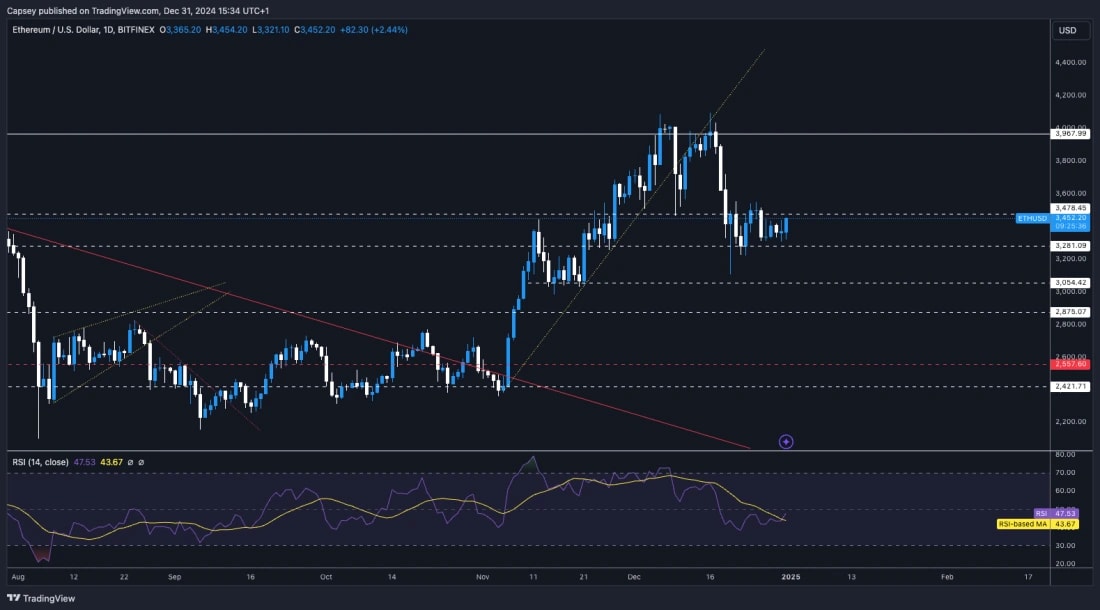
- Next Support: $3,280
- Next Resistance: $3,480
- Direction: Neutral (Bullish)
- Upside Target: $3,700
- Downside Target: $3,280
Cryptonary's take
ETH looks good here for a short-term stab higher, potentially testing into $3,700. For this, we're looking for a breakout of $3,480 to $3,500, which we think we'll get/see in the coming days.ETH struggles near $4,000 resistance
16 December 2024ETH climbs after reclaiming key support at $3,480, while BTC holds strong and SOL eyes a potential breakout. Let’s analyze what’s next for Ethereum.
Disclaimer: This is not financial or investment advice. You are responsible for any capital-related decisions you make, and only you are accountable for the results.
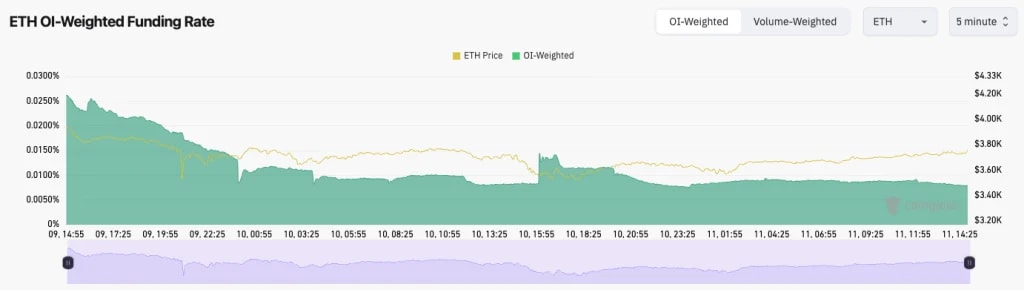
- ETH's Open Interest (by number of coins) continues to grind to a new all-time high. However, this may be due to large funds/institutions taking advantage of the 'cash-and-carry' trade (buy the ETF, short the futures, profit off the Funding Rate).
- ETH's Funding Rate remains at the healthy level of 0.01%. This is positive to see.

Technical analysis
- ETH did break below its uptrend line, but the price bounced perfectly from the $3,480 horizontal support.
- Price is now battling to recover the uptrend line, and it is putting up a good fight so far.
- Price is now butting into the main horizontal resistance between $3,950 and $4,000.
- If ETH were to break above $4,000 convincingly, we'd expect $4,500 to be swiftly achieved.
- There is now local support for ETH between $3,700 and $3,800.
- The RSI has meaningfully reset and not near overbought territory. This may allow the price of the room to run higher.
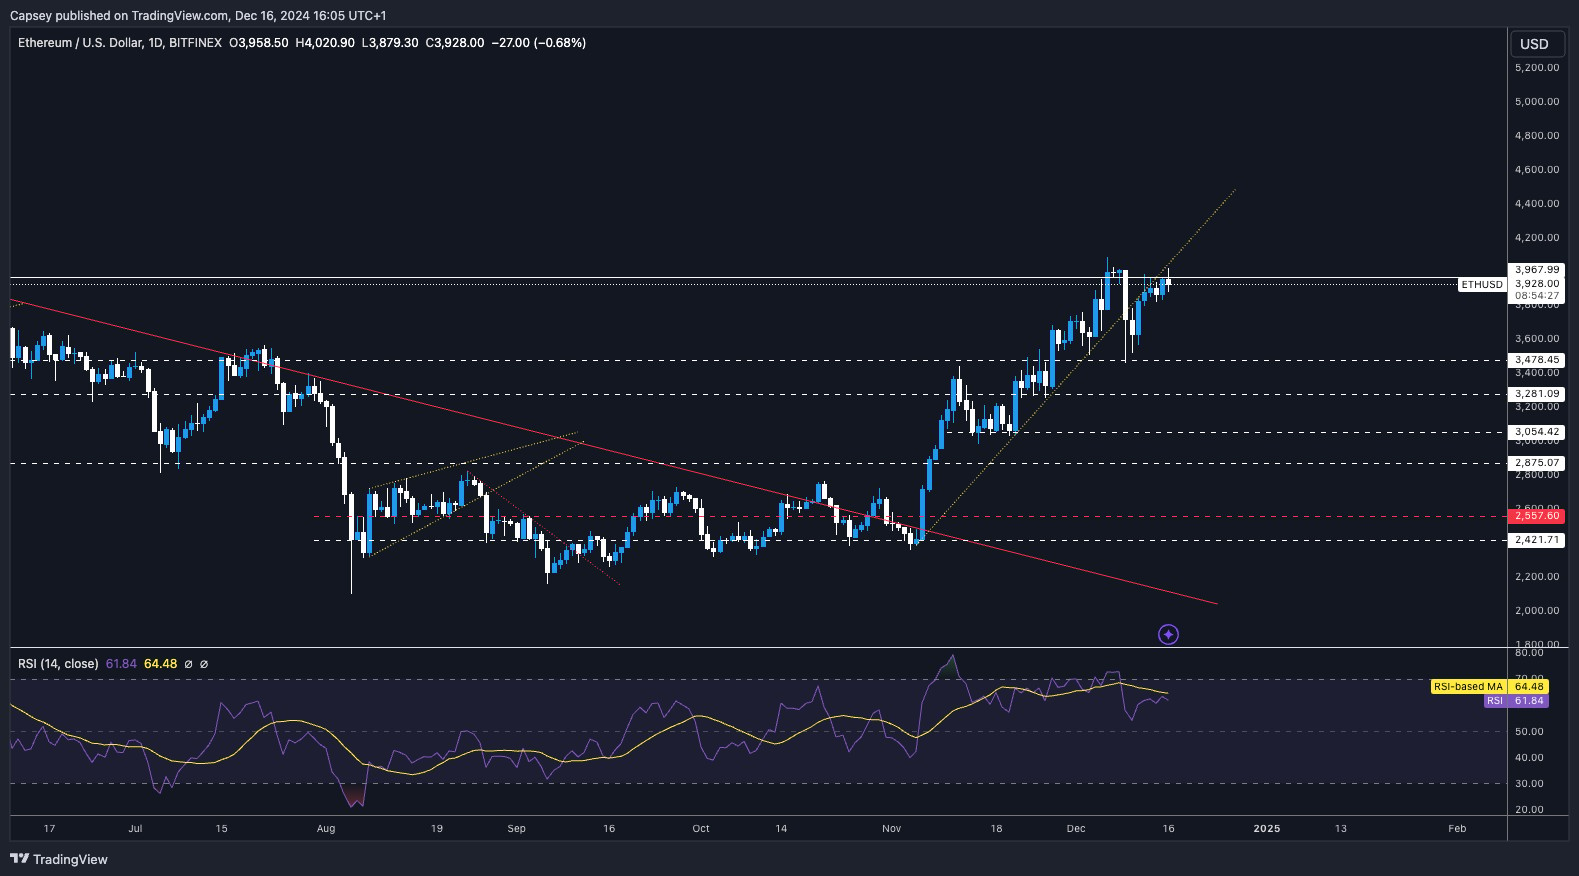
- Next Support: $3,700
- Next Resistance: $4,500
- Direction: Bullish
- Upside Target: $4,500
- Downside Target: $3,700
Cryptonary's take
ETH is in a really interesting spot here. It's possible that the converging resistances (beneath the uptrend and the horizontal resistance) can keep the price below $4,000 for more days. However, we expect ETH to break out more imminently. And when it does, we expect $4,500 to be achieved quickly. Any pullbacks to $3,700 - $3,800 should be bought for a move up to $4,500.ETH consolidates below $4,000 range
11 December 2024ETH consolidates below $4,000 after a clean bounce off $3,480 support. With RSI normalizing and resistance firm, what’s next for Ethereum?
Disclaimer: This is not financial or investment advice. You are responsible for any capital-related decisions you make, and only you are accountable for the results.
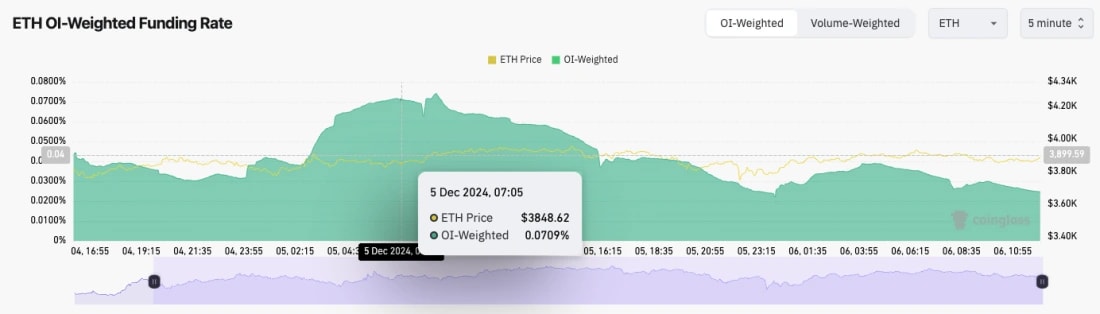
- ETH's Open Interest still remains high and hasn't seen as much of a flush out.
- ETH's Funding Rate has pulled back substantially from 0.03% to just 0.01% in the last 48 hours. So we've seen some flush out of excess Longs.
Technical analysis
- Really clean price action.
- Price was in a really clean uptrend and rejected at the main horizontal resistance at $4,000.
- The price then broke below the main uptrend line and swiftly revisited the main horizontal support at $3,480, where the price bounced perfectly.
- Price is now out of the main uptrend, so therefore, the underside of the uptrend line and the horizontal resistance of $4,000 will act as strong resistance.
- The RSI has also pulled back to 58, which is close to middle territory and nowhere near being overbought.
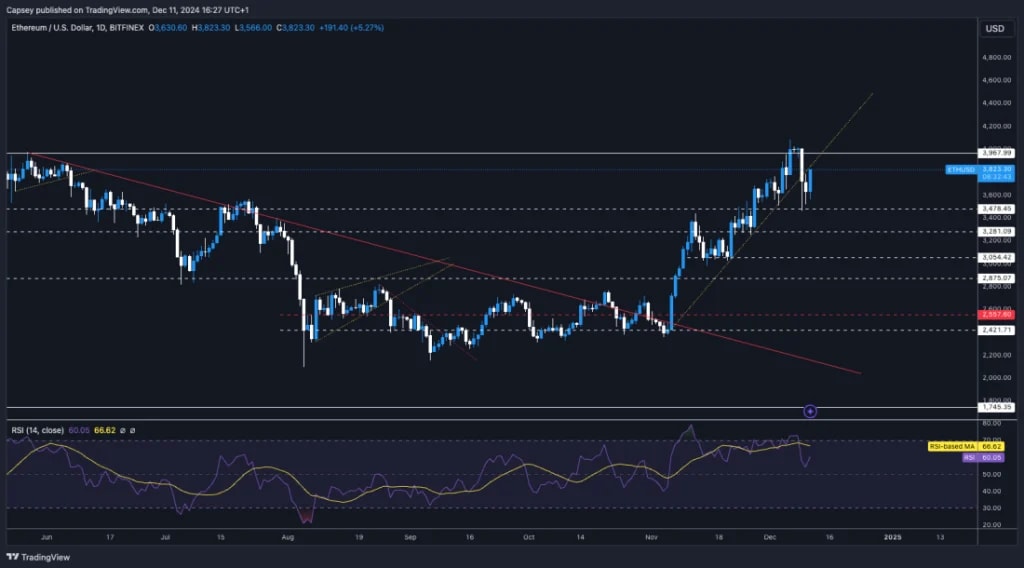
- Next Support: $3,480
- Next Resistance: $4,000
- Direction: Neutral/Bullish
- Upside Target: $4,000 (then $4,500)
- Downside Target: $3,480
Cryptonary's take
ETH is now out of its main uptrend, so it's possible we will see a further period of consolidation below $4,000. The bullish reversal will come upon a breakout of $4,000, so that's what we'd be waiting for. We expect this might take another week or so, and ETH might require patience here. For now, we continue to hold ETH, and we're not looking to make any changes.ETH holds key support at $3,700
06 December 2024Ethereum ($ETH) saw a 10% Open Interest drop and funding reset, holding key support at $3,700. Bulls eye $4,000 resistance, with $4,500 as the next upside target.
Disclaimer: This is not financial or investment advice. You are responsible for any capital-related decisions you make, and only you are accountable for the results.
- Like BTC, the rest of the market also moved lower; however, generally speaking, the rest of the market saw less of a meaningful flush out.
- ETH's Open Interest on Binance moved down from 1.67m ETH to 1.51m ETH, so an approximate 10% flush out in Open Interest for ETH.
- The Funding Rate had moved up substantially, and it came down from 0.065% to 0.024%.
- So, some Longs were flushed out. However, there still remains a relatively high level of Open Interest.
Technical analysis
- The TA hasn't changed much from our last update, so we'll keep this section lighter.
- Price has remained in an uptrend, and for now, the price has initially rejected the major horizontal resistance and psychological level of $4,000.
- To the downside, the $3,480 to $3,700 zone should act as major support.
- The RSI is very close to overbought territory. It's close that there is further upside, but we wouldn't be surprised to see the price linger under $4,000 for a week or so, and that might help reset the RSI slightly.
- Next Support: $3,480 - $3,700
- Next Resistance: $4,000
- Direction: Neutral/Bullish
- Upside Target: $4,000 (then $4,500)
- Downside Target: $3,480
Cryptonary's take
Whilst it's possible that ETH does just break beyond $4,000, we do still expect that $4k is a resistance, at least for a few more days, potentially up to the next week. However, beyond that, we do expect a stronger break out that eventually sees ETH move to $4,500 within the coming weeks.For now, we continue to hold Spot bags. A retest of $3,500, and we'd consider adding to these Spot bags for a short-term swing trade.
ETH RSI signals $4,000 resistance
04 December 2024Ethereum’s ($ETH) rally pushes near $4,000, with strong open interest and elevated funding rates. As RSI enters overbought territory, $3,700 emerges as a key support for potential pullbacks. Will ETH break through psychological resistance?
Disclaimer: This is not financial or investment advice. You are responsible for any capital-related decisions you make, and only you are accountable for the results.
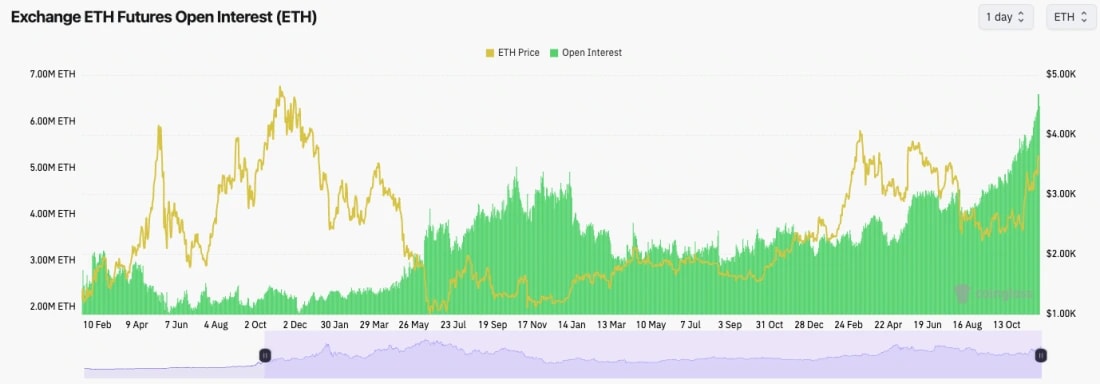
- ETH's Open Interest is on an absolute rip, on both the USD terms and the by the number of ETH. This is likely due to increased 'cash-and-carry' trades and more large players entering the ALT market following Trump's win.
- ETH's Funding Rate has also increased to 0.03%. Again, this is relatively elevated; however, we're not greatly concerned about it in the immediate term.
Technical analysis
- It was just a really clean move up to nearly $4,000, which we have called for perfectly over the last few weeks.
- Price has managed to find support and held key horizontal levels before moving higher. First, it was $3,000, then $3,280, then $3,480, and now it's a straight move to $4k.
- To the downside, we'd expect $3,550 to $3,700 to be a strong support zone for ETH.
- For now, ETH is moving in a nice uptrend, and it's possible that, at an approach of $4,000, there might be significant psychological resistance for ETH.
- The RSI is also grinding higher into overbought territory. If ETH approaches $4,000 and struggles to have a smooth break out above that level, we might see a short-term overbought pullback.
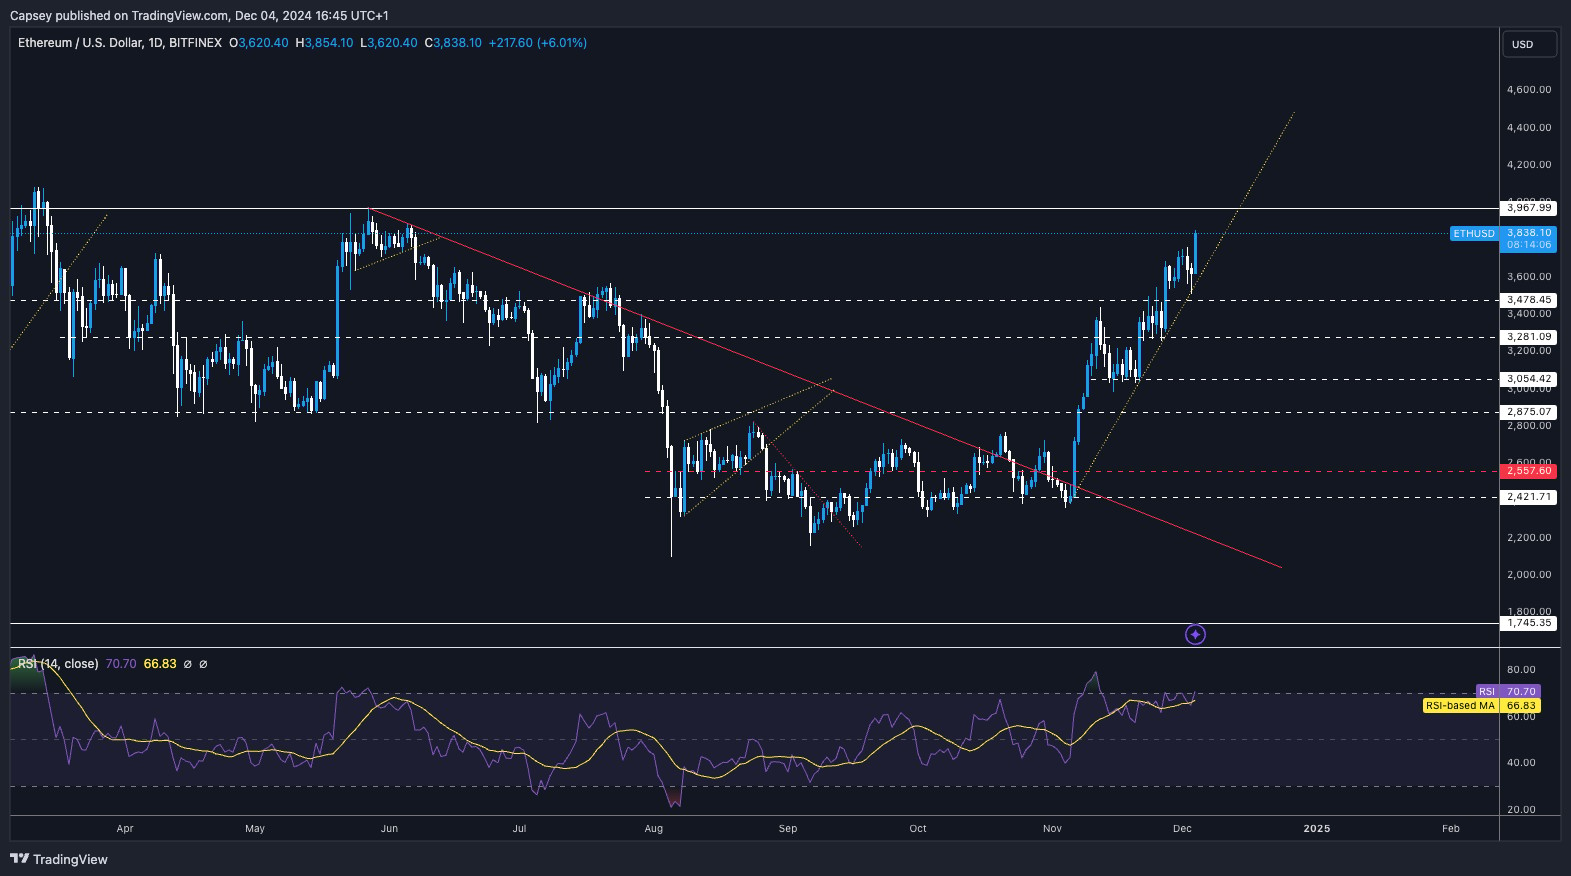
- Next Support: $3,700
- Next Resistance: $4,000
- Direction: Bullish
- Upside Target: $4,000
- Downside Target: $3,480
Cryptonary's take
ETH is one we've got really spot on over the last few weeks, having perfectly called for the move up from the lows around $2,300 to $2,500. ETH is now approaching the short-term target of $4,000. While it's possible we will see a major break out of that level, it's also possible that we will see ETH stall in the short term at the $4,000 mark. If that then generates a small pullback, a retest of $3,700 might be a good place for a new entry.ETH targets $4,000 this week
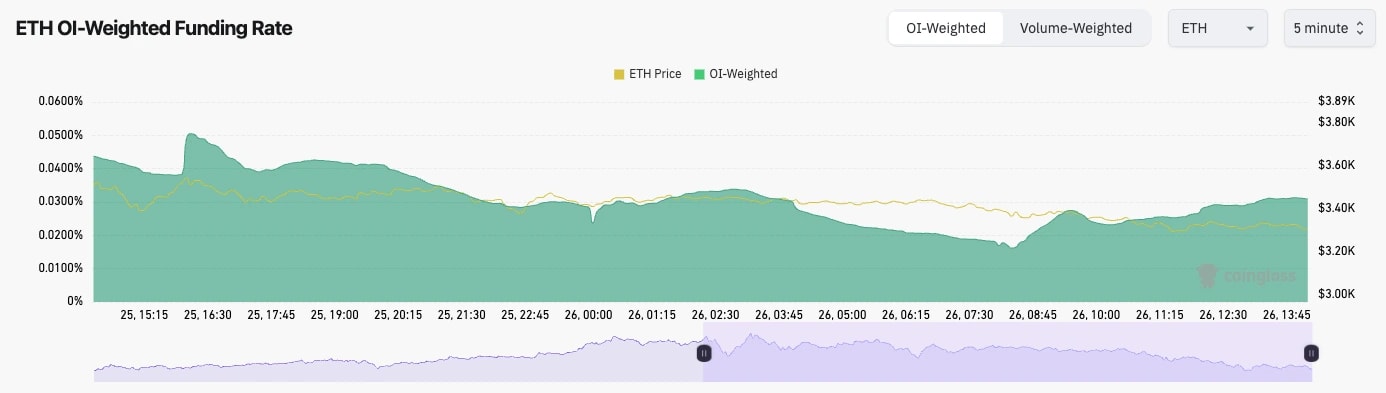
29 November 2024Ethereum ($ETH) consolidates between $3,480 support and $4,000 resistance. Record-high open interest and bullish momentum point to further gains despite bearish divergence on oscillators.
Disclaimer: This is not financial or investment advice. You are responsible for any capital-related decisions you make, and only you are accountable for the results.
- ETH's Open Interest remains at record highs, while the Funding Rate is also elevated, but it is not excessively high.
- The reason why ETH's Open Interest is likely so high is likely due to large players taking advantage of the 'cash-and-carry' trade. Buy the ETF and Short ETH Spot, and profit from being paid the Funding Rate.
Technical analysis
- Really nice move that, overall, we've called relatively perfectly.
- ETH managed to consolidate between $3,280 and $3,480 before now breaking above $3,480 and pushing into $3,600. $4,000 likely soon.
- In terms of support, we expect $3,480 to be local support, with $3,280 as a stronger support.
- On the upside, we think the main resistance is at $4,000. It's a psychological level as well as a prior resistance level.
- One thing to note here is that ETH has put in a bearish divergence (a higher high in price and a lower high on the oscillator). However, it's not in overbought territory, so that's not as bad.
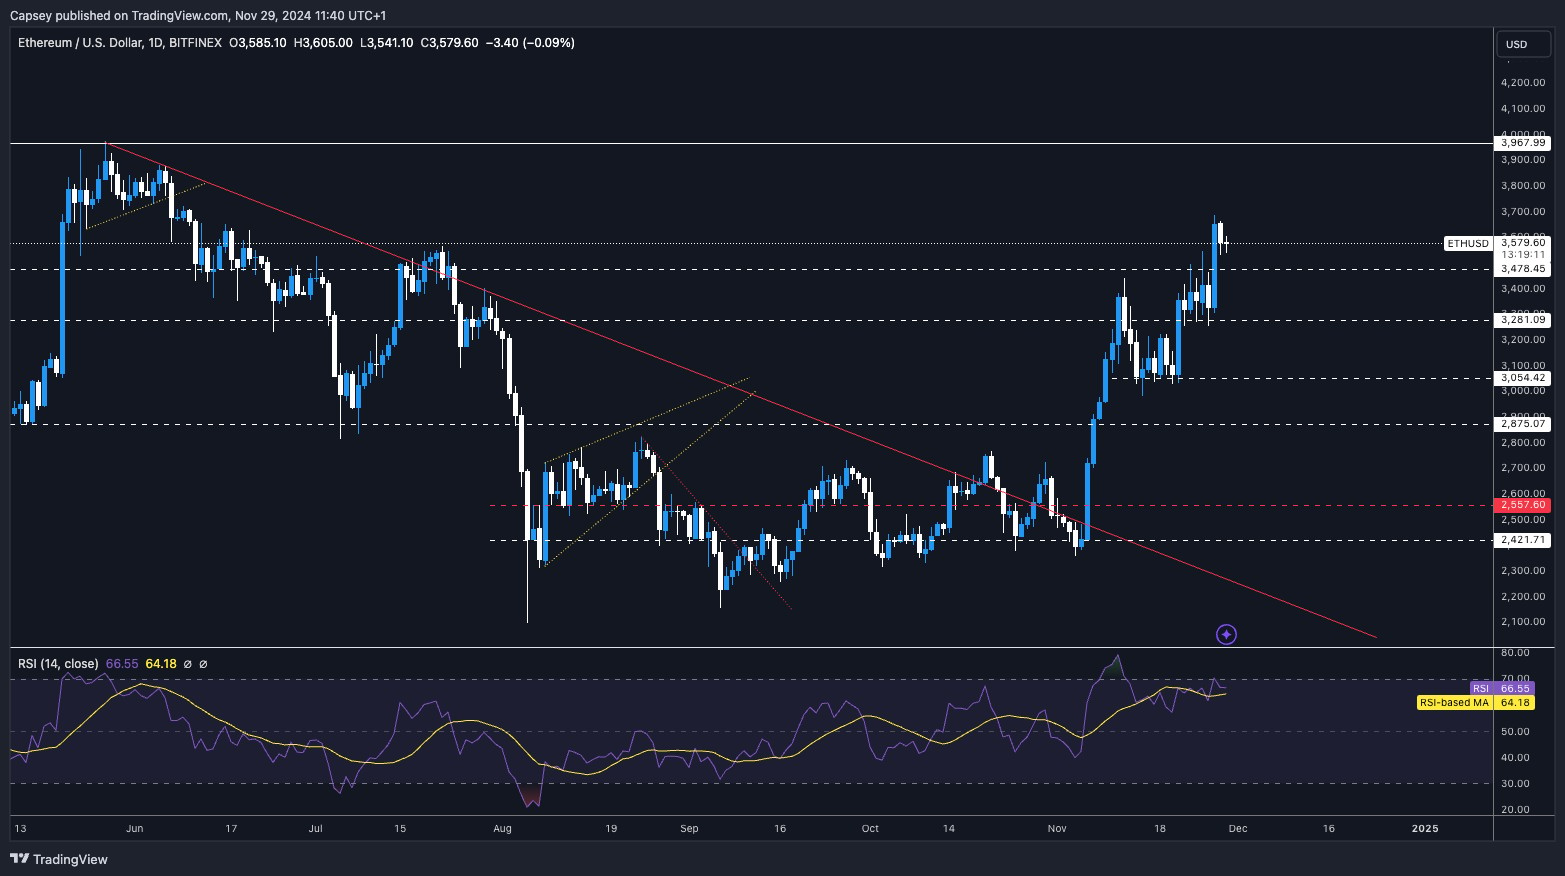
- Next Support: $3,480
- Next Resistance: $4,000
- Direction: Bullish
- Upside Target: $4,000
- Downside Target: $3,280
Cryptonary's take
ETH's narrative has improved substantially, and price action has been positive for once.Therefore, we do expect ETH to just grind up to $4,000 in the coming week.
If we get this, we'd expect $3,480 to then become a more major support. Overall, we're positive on ETH here, as we pretty much have been since its lows in the low $ 2,000s.
ETH trades 25% off all-time highs
26 November 2024ETH remains resilient above $3,280 as BTC retraces. With institutional interest growing, RSI cooling, and key levels in play, the stage is set for a potential breakout. Let’s explore the latest action across the crypto market.
Disclaimer: This is not financial or investment advice. You are responsible for any capital-related decisions you make, and only you are accountable for the results.
- Like BTC, ETH's Open Interest remain very high. An element of this may be institutional players taking advantage of the carry trade, longing the ETF, shortening the futures, and profiting from the funding rate.
- ETH's Funding Rate also remains high at the 0.03% level, although it has been higher, and this isn't very extreme here, all things considered.
- ETH looks less vulnerable to a flush-out in comparison to BTC, even though it is still somewhat overheated here.
Technical analysis
- Much more positive price action from ETH here, with it being able to hold above the $3,280 horizontal support.
- For now, in the short term, the $3,480 horizontal level remains the major resistance.
- A break above $3,480 and ETH likely moves on to $4,000.
- If $3,280 is lost to the downside, then it's possible that ETH pulls back as much as $3,000, although there is a fair amount of support between $3,000 and $3,280.
- The RSI was overbought but has recently approached back into overbought territory, with it now resetting to 61. This is positive to see it's not overbought.
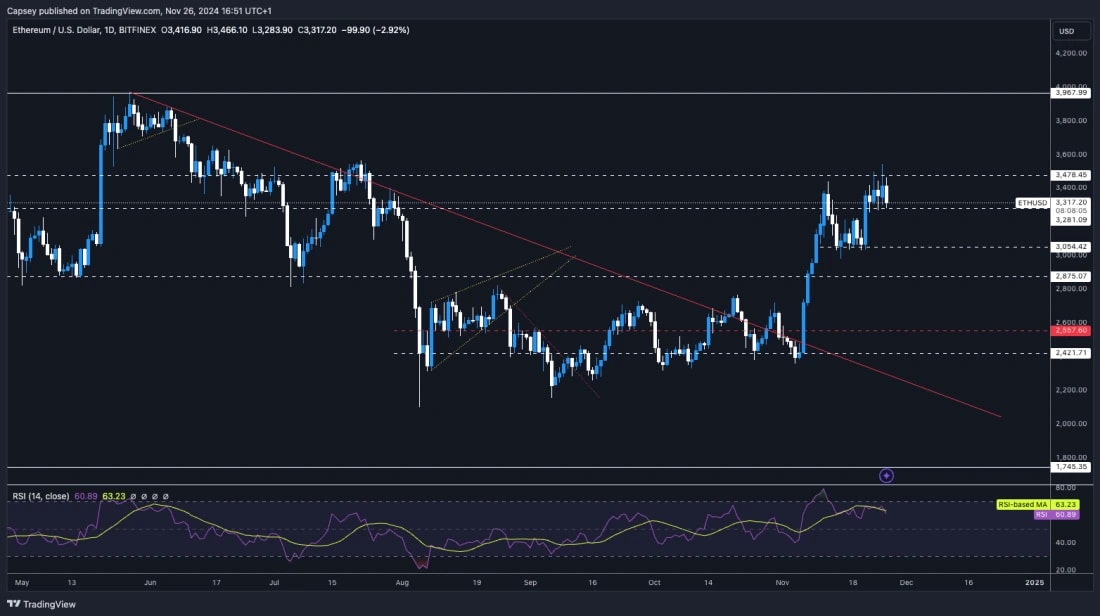
- Next Support: $3,280
- Next Resistance: $3,480
- Direction: Neutral/Bullish
- Upside Target: $4,000
- Downside Target: $3,050
Cryptonary's take
This is the first time ETH has performed relatively well, even with the rest of the market seeing a more significant pullback. Institutions may be looking at ETH here and saying, "It's 25% off its all-time highs, whilst BTC is 50% above its old all-time highs; there is some divergence here".This may then attract institutional money into ETH here as it's beginning to look more attractive in relation to BTC, despite ETH still somewhat lacking the narrative.
We'd like to see ETH continue to find support above $3,280. If it does this, we'll grow in confidence that a $3,480 break out is on the cards.
We're holding Spot ETH and are not looking to sell it here. Overall, we think ETH looks relatively positive here, especially if BTC can avoid a larger pullback to the $87k area, let's say.
Ethereum’s next target: $3,480 resistance
22 November 2024Ethereum’s open interest hits all-time highs as it consolidates near $3,280. Can ETH break resistance at $3,480 and target $4,000 next?
Disclaimer: This is not financial or investment advice. You are responsible for any capital-related decisions you make, and only you are accountable for the results.
- ETH's Open Interest is still at all-time highs, having really kicked up higher over the last week. It's likely we'll see a shakeout at some point. However, this may last for more days/weeks.
- The Funding Rate has also increased back to its recent highs. This indicates that positioning is net Longs here, meaning Longs are potentially vulnerable to a flush-out.

Technical analysis
- ETH looks really interesting here.
- ETH looks to be potentially forming a double top into the $3,400 area just shy of our $3,480 horizontal resistance.
- ETH did manage to find support locally at $3,050 and into $3,000, as we thought might be the case, with $3,00 being a psychological level.
- ETH is currently sitting on top of local support at $3,280. If ETH can hold support at $3,280, this improves the setup and enables ETH to possibly run to $4,000 upon a breakout of $3,480.
- If ETH were to lose the $3,000 level, then we'd expect the major support of $2,875 to hold.
- ETH's RSI has pulled back from overbought territory, and it also has printed any bearish divergences (unlike BTC).
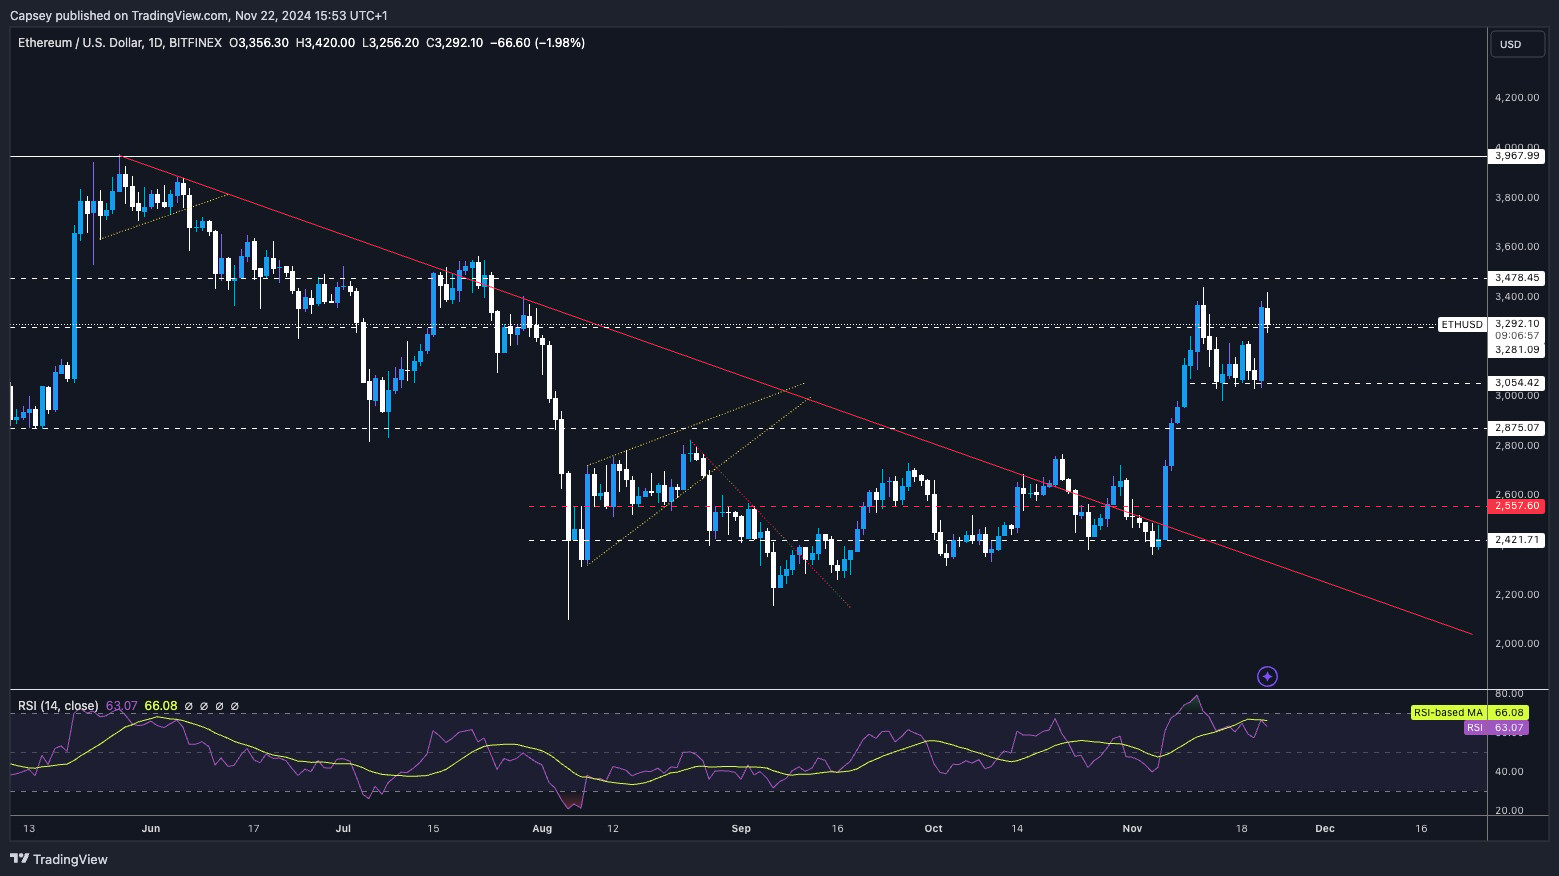
- Next Support: $3,000
- Next Resistance: $3,480
- Direction: Neutral
- Upside Target: $4,000
- Downside Target: $2,875
Cryptonary's take
ETH is currently in an interesting spot between a key range of $3,000 to $3,480. We'd expect, with the bullish market we have, that ETH can reach $4,000 again in the coming weeks/months. We'd be buyers on dips, although we would remain underweight ETH against SOL, and we still favour being significantly overweight SOL. We expect ETH to move up with the rest of the market, but we still don't feel that it'll outperform other assets (SOL especially).ETH at $3,480 or $2,875?
19 November 2024Ethereum’s pullback to $3,000 raises questions as funding rates climb and leverage markets overheat. Meanwhile, BTC holds highs. Let’s break down ETH’s bear flag setup and key levels ahead.
Disclaimer: This is not financial or investment advice. You are responsible for any capital-related decisions you make, and only you are accountable for the results.
- ETH's Open Interest remains at very high levels.
- The funding rate has also increased more meaningfully.
- The leverage market as a whole is quite overheated here, and therefore, a flush out to the downside may be on the cards.
Technical analysis
- Since rejecting the $3,400 level, ETH has pulled back to the psychological level of $3,000, but it has managed to bounce from there.
- However, ETH is now forming a bear flag, which would have a breakdown target of somewhere between $2,875 and $3,000. It's possible that the $3,000 psychological level can be held as support if there is a breakdown for price.
- The RSI has pulled back meaningfully from overbought conditions, and it's now back to a more middle territory of 58. This is a healthy reset.
- To the upside, the key levels for the price to reclaim are $3,280 and then $3,480. A break above $3,480 and ETH will likely swiftly move on to $4,000.

Cryptonary's take
Other than BTC, most of the market is seeing a slight pullback here, including ETH. Whilst ETH is set up bearishly in the immediate term, we're still very bullish in the medium and long term. Therefore, if ETH does move down to $3,000, this may be a good level to add buys, particularly if there is a move into the $2,875 area.Bearish to neutral in the immediate term. Bullish beyond that.
ETH testing $3,000 support zone
15 November 2024Ethereum ($ETH) consolidates after hitting resistance near $3,280-$3,480, with support at $2,875. RSI and funding rates reset, setting the stage for its next potential move.
Disclaimer: This is not financial or investment advice. You are responsible for any capital-related decisions you make, and only you are accountable for the results.
- ETH's Open Interest remains extremely high and at all-time highs in USD value and by the number of ETH.
- Like BTC, ETH's Funding Rate has also pulled back to more sensible and therefore healthy levels. This is positive.
Technical analysis
- Even though ETH's move was also mostly straight up, we're referring back to the Daily timeframe for the ETH chart.
- ETH moved into the range between two key levels: $3,280 and $3,480. ETH couldn't sustain in this higher range and has since pulled back.
- It's possible that the psychological level of $3,000 acts as local support for ETH. However, the major support for ETH is at $2,875.
- ETH was very overbought, but via pulling back, the RSI has reset more meaningfully, and it's back in the middle territory and finding support on its moving average. This is better and needed.
- On the upside, it's likely that $3,280 to $3,480 will be more significant resistance for ETH to overcome.
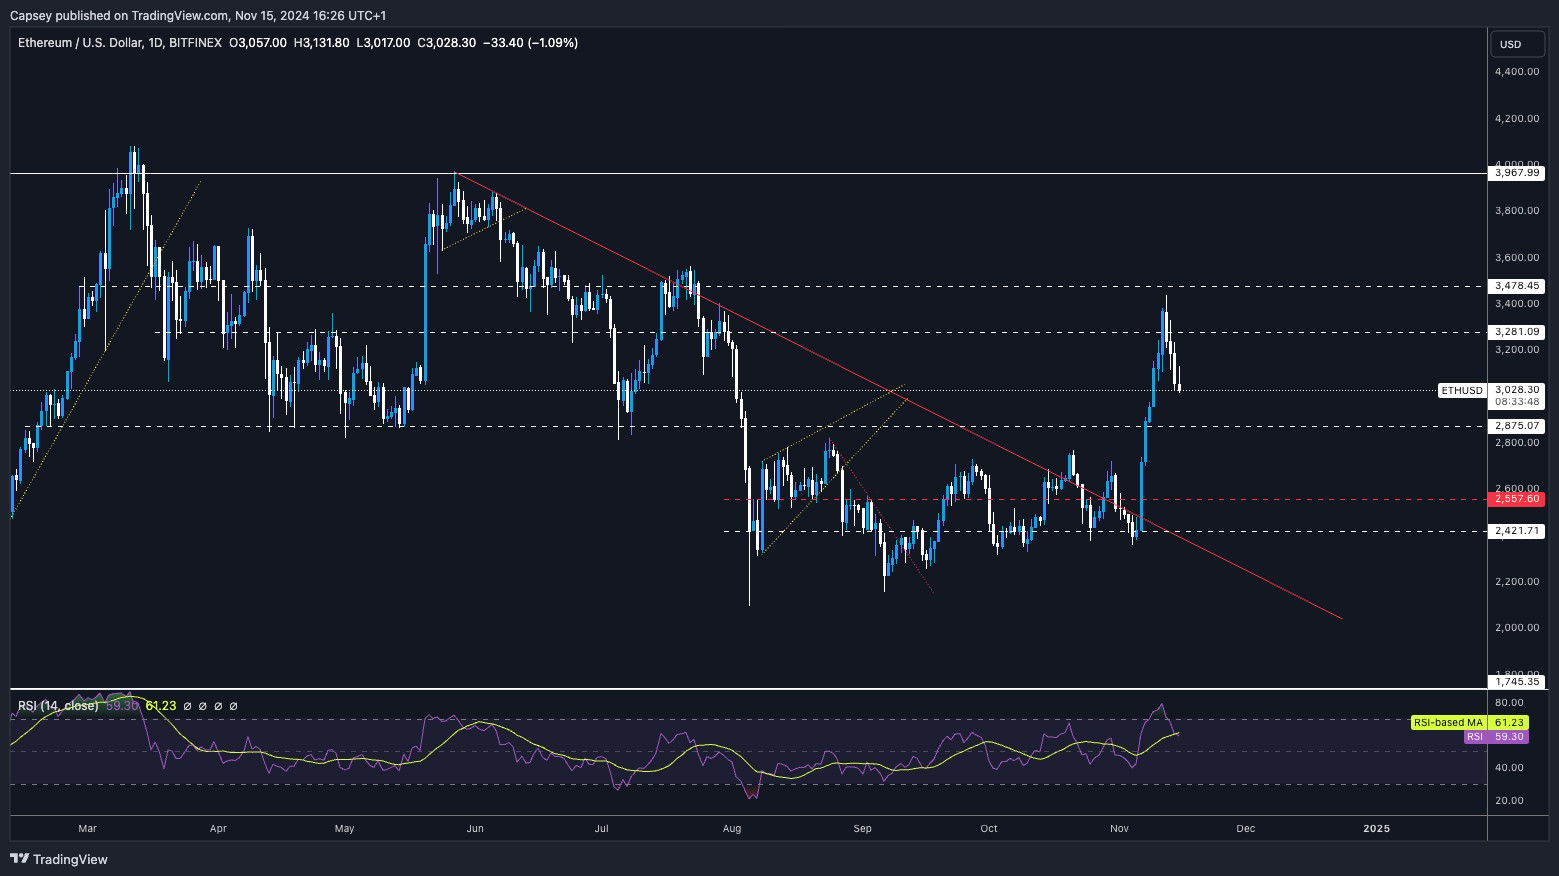
- Next Support: $3,000
- Next Resistance: $3,280
- Direction: Neutral
- Upside Target: $3,280 (then $3,480)
- Downside Target: $2,875
Cryptonary's take
It was a massive move higher for ETH, so it could be expected that some of that move is given back, which we're seeing now. Since pulling back, some of the indicators have reset from very overbought levels, and ETH is close to approaching an area of support.We expect ETH to hold above $2,875 and potentially find support in that range between $2,875 and $3,000. Let's see if we get that over the coming days/week. We're not looking to sell any Spot ETH, and we're looking to hold through this period, which we merely see as a small pullback in a wider bull market.
Ethereum targets $4,000 after breakout
12 November 2024Ethereum’s surge to $3,480 raises questions as funding rates hit highs. Meanwhile, BTC and SOL also face critical levels. Will these assets continue upward, or is a correction on the way?
Disclaimer: This is not financial or investment advice. You are responsible for any capital-related decisions you make, and only you are accountable for the results.
- ETH's Open Interest has hit an al-ltime high in both USD terms and the number of coins (ETH) terms.
- However, ETH's funding is high here at 0.06%, 66% annually.
- This suggests a flush out is needed here also as there's a lot of leverage overly positioned one-sided, Long.
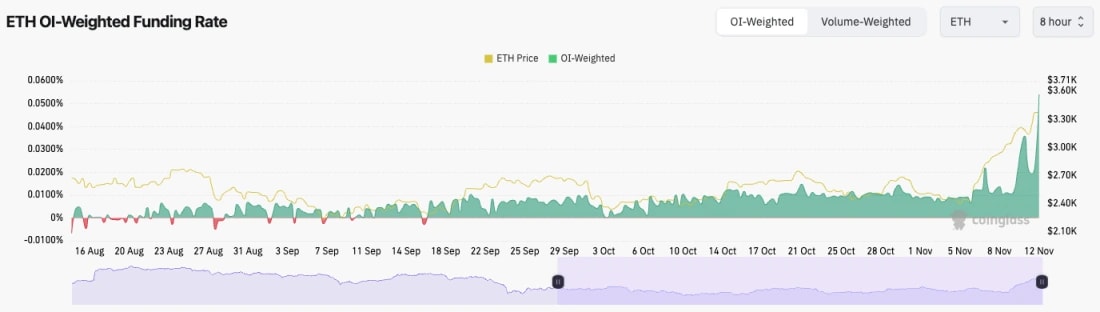
Technical analysis
- It is a massive breakout and potentially a game changer for ETH, with a Trump victory providing hope for a new regulatory regime.
- ETH smashed through two major horizontal levels, the first at $2,875 and the second one at $3,240.
- Price has now moved up to the next horizontal resistance at $3,480, and it has pulled back from there. Expected after such a huge move higher.
- Price is now battling to find and maintain support at the $3,240 horizontal level. It would be very positive for Price to hammer this level in as new support and spend some time cementing itself above this level.
- The RSI for ETH is also very high at 73. It's likely we need to see more of a pull back for price or at least a period of price slowing down and consolidating, ideally in the range above $3,200.
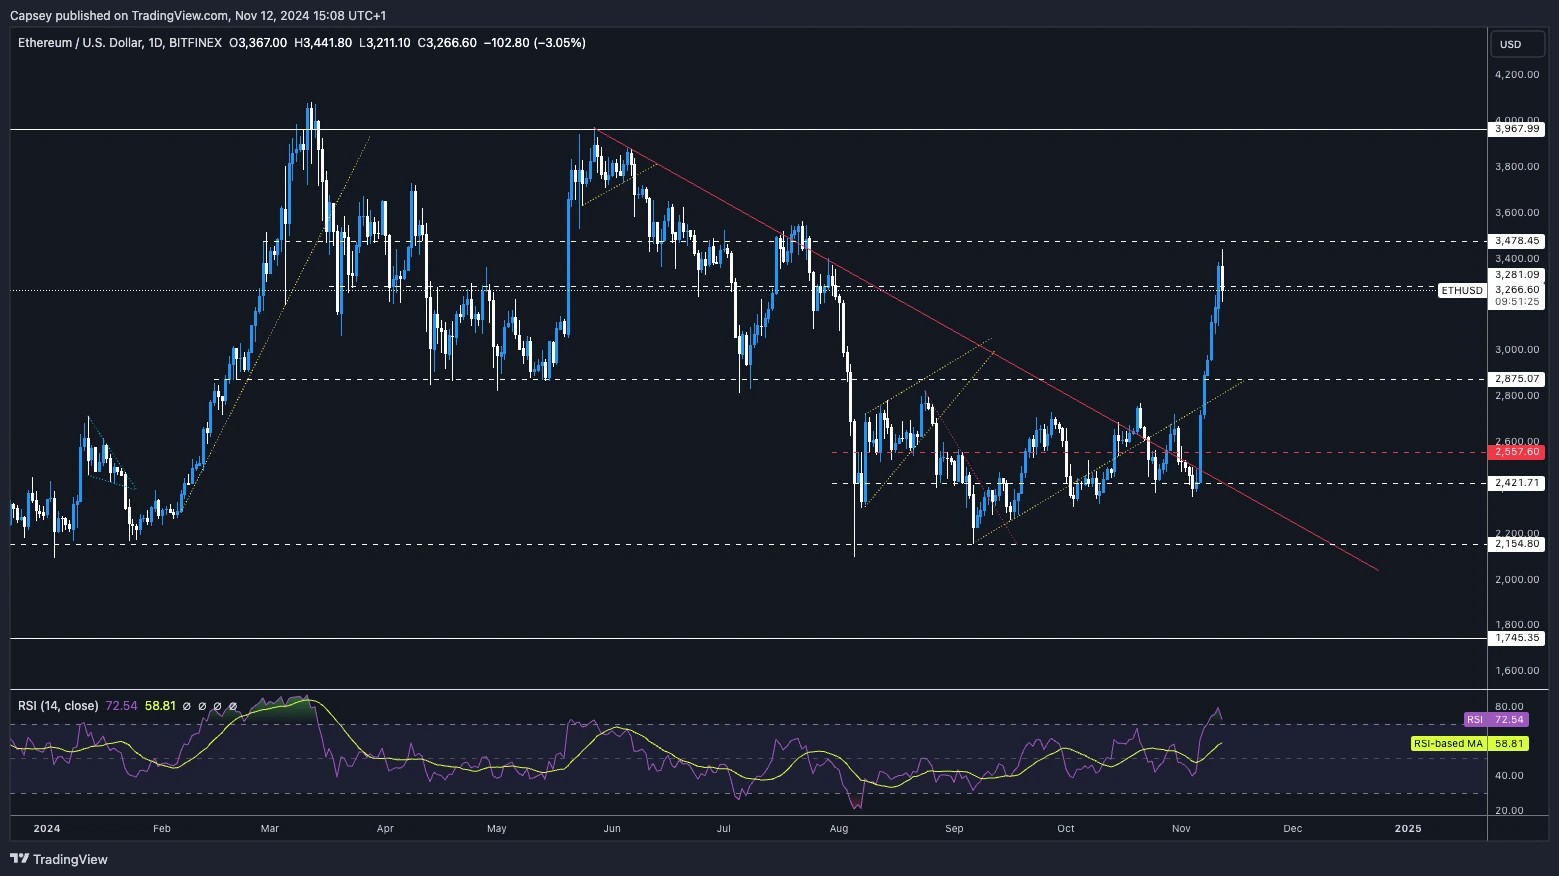
- Next Support: $3,100 to $3,240
- Next Resistance: $3,480
- Direction: Neutral
- Upside Target: $3,480 (and then $4,000)
- Downside Target: $3,100
Cryptonary's take
The Trump win has absolutely given fresh life to ETH and just generally the DeFi space. We expect the price to slow down here, and ideally to just consolidate for a week or so between $3,200 and $3,400. This would give Alts/Memes more room to breathe and go higher, so we'd see that as positive. However, if there is a slight further pullback for ETH here, we wouldn't rule out a re-visit to $3,100.Ethereum aims for $3,280 resistance
07 November 2024As $ETH gains momentum and open interest peaks, the market braces for a potential breakout. Let’s look into key levels for ETH.
Disclaimer: This is not financial or investment advice. You are responsible for any capital-related decisions you make, and only you are accountable for the results.
- The ETH Open Interest is in an aggressive uptrend and hit new all-time highs yesterday. This indicates a lot of leverage has gone in to ETH.
- The Funding Rate is similar to BTC. Positive but contained on larger exchanges, but the
- Funding Rate is rising on the smaller, less liquid exchanges, indicating traders are paying a higher and higher premium to be Long here.
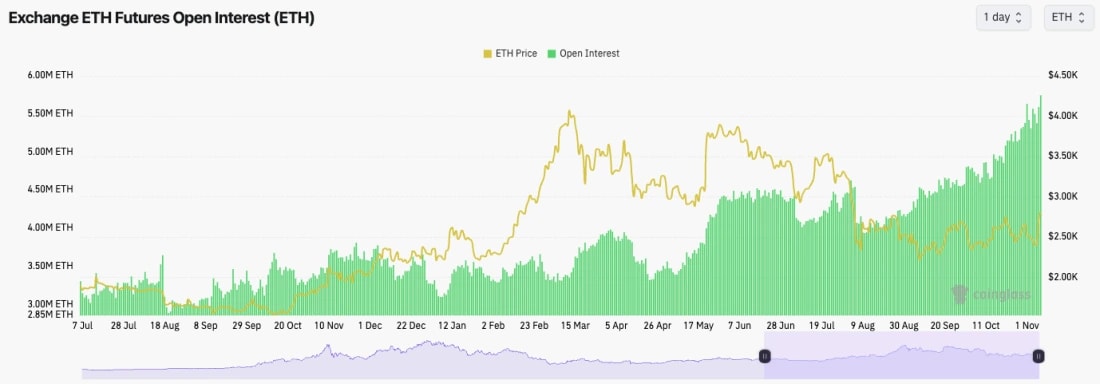
Technical analysis
- So far, a really lovely move, and maybe the first time we're seeing some life from ETH following a Trump victory that potentially improves the regulatory environment, benefitting ETH.
- ETH broke back above the main downtrend line and shot straight up to the main horizontal resistance of $2,875 that we've had in place for a number of months now.
- Price has so far been rejected from $2,875; although the price now being in this higher range, it's likely we will see a breakout of $2,875 in the coming weeks.
- Local support for ETH should be around the $2,700 mark. Really, in this market, ETH should be able to hold the $2,700 local support.
- Beyond $2,875, ETH's next major horizontal resistance is $3,280.
- ETH's RSI is approaching overbought territory, but isn't yet close. If price consolidates for a few days, this'll reset the RSI more and likely give more room for ETH to then break above $2,875 more convincingly. Likely more upside to go here.
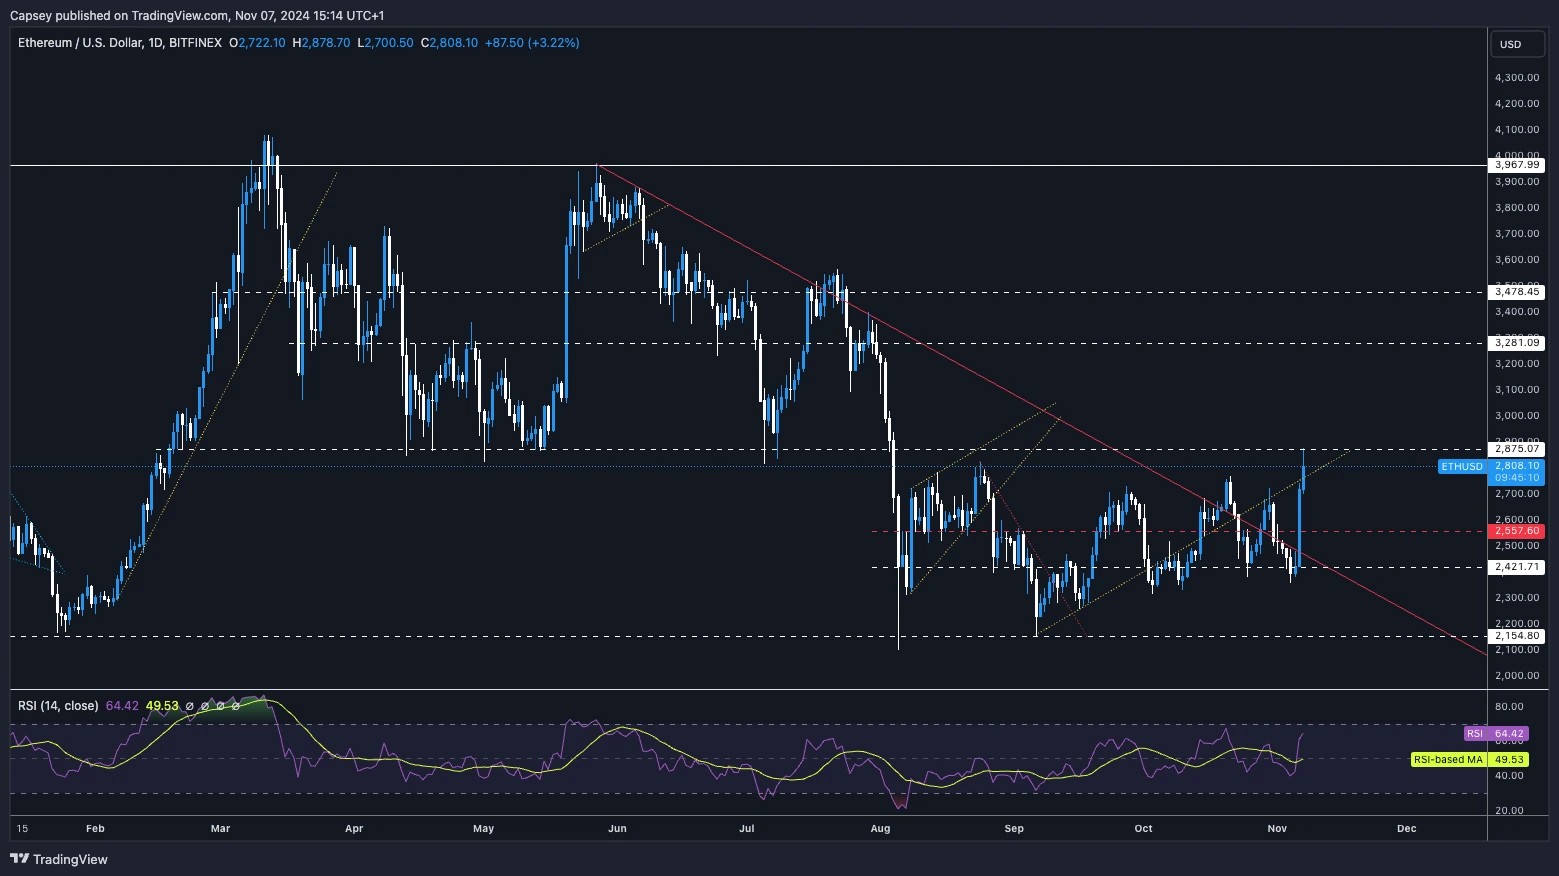
- Next Support: $2,700
- Next Resistance: $2,875
- Direction: Neutral/Bullish
- Upside Target: $2,875 (to $3,280 upon breakout)
- Downside Target: $2,700
Cryptonary's take
A much more positive-looking chart which is to be expected considering ETH and just the blockchain space is now likely to be moving into a new regulatory regime.We're expecting the price to be range-bound between $2,700 to $2,875 for a few more days and then to break out above $2,875 potentially by the end of the weekend.
ETH open interest peaks, Price stalls
04 November 2024Ethereum is testing key levels, with $2,420 support and $2,550 resistance in play. The election could steer ETH’s next big move. Let’s explore what this means for ETH and other major cryptos.
Disclaimer: This is not financial or investment advice. You are responsible for any capital-related decisions you make, and only you are accountable for the results.
- ETH's Open Interest remains at highs (measured in the number of coins rather than USD) suggesting there are a lot of leverage bets on ETH currently.
- The funding rate is at 0.01%, so it is still at a relatively healthy level.
- If there is a Harris win, it's possible we see price trade lower and OI be flushed down.
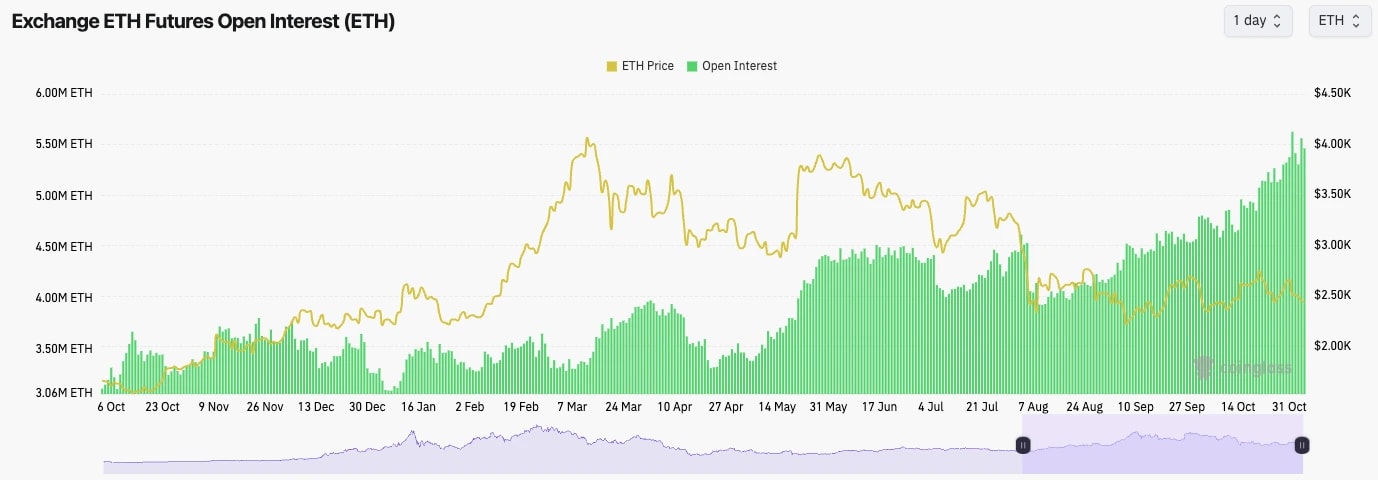
Technical analysis
- ETH is now entering its fourth month in the lower price range of $2,150 to $2,800.
- ETH was rejected in the $ 2,700s and underside of the local uptrend line. Price has now fallen back into the main downtrend and beneath the key horizontal level of $2,557 - not great!
- Price is now approaching its local support level at $2,420, which will need to hold or $2,300 is likely and the door to the major support at $2,150 will be open.
- On the upside, honestly, our focus is just on reclaiming $2,557 at this rate. This will likely only happen if we see a Trump win.
- ETH's RSI is at 41, so somewhat still in middle territory, although the smaller timeframes are putting in bullish divergences.

- Next Support: $2,420
- Next Resistance: $2,550
- Direction: Neutral
- Upside Target: $2,550
- Downside Target: $2,150
Cryptonary's take
It's becoming harder and harder here to stay positive on ETH. ETH has attempted a breakout of the main downtrend line a number of times and it has failed at each opportunity. We would likely only see a more substantial upside for ETH upon a Trump victory, however, we still favour other assets under that scenario, SOL for example. If Harris wins, it's possible we will see ETH re-visit $2,150.ETH price targets $2,750 next
28 October 2024Ethereum (ETH) is retesting the $2,420 support after failing a breakout above $2,550. Can ETH recover, or will it slide to $2,150? Here's today's analysis.
Disclaimer: This is not financial or investment advice. You are responsible for any capital-related decisions you make, and only you are accountable for the results.
- ETH is becoming increasingly interesting from a mechanics point of view.
- ETH's Open Interest continues to grind to new highs (measured in the number of coins).
- Meanwhile, the funding rate remains low but positive. This is still a good setup overall.
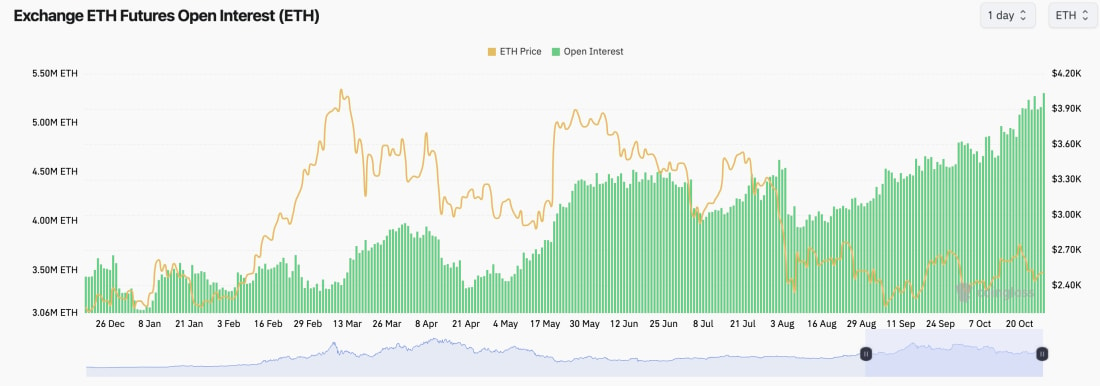
Technical analysis
- ETH broke out of the main downtrend line, but it couldn't sustain a breakout.
- After the failed break out, price broke beneath the horizontal support of $2,550, the local uptrend line, and it also fell back in to the downtrend line. Not good.
- The RSI has more meaningfully reset, and the price has found some support at the local level of $2,420, which perhaps are the only positive aspects here.
- To the downside, $2,420 needs to hold as local support really, or a break down to $2,150 could be possible.
- To the upside, the local level to reclaim is $2,550; beyond that, it's $2,750.
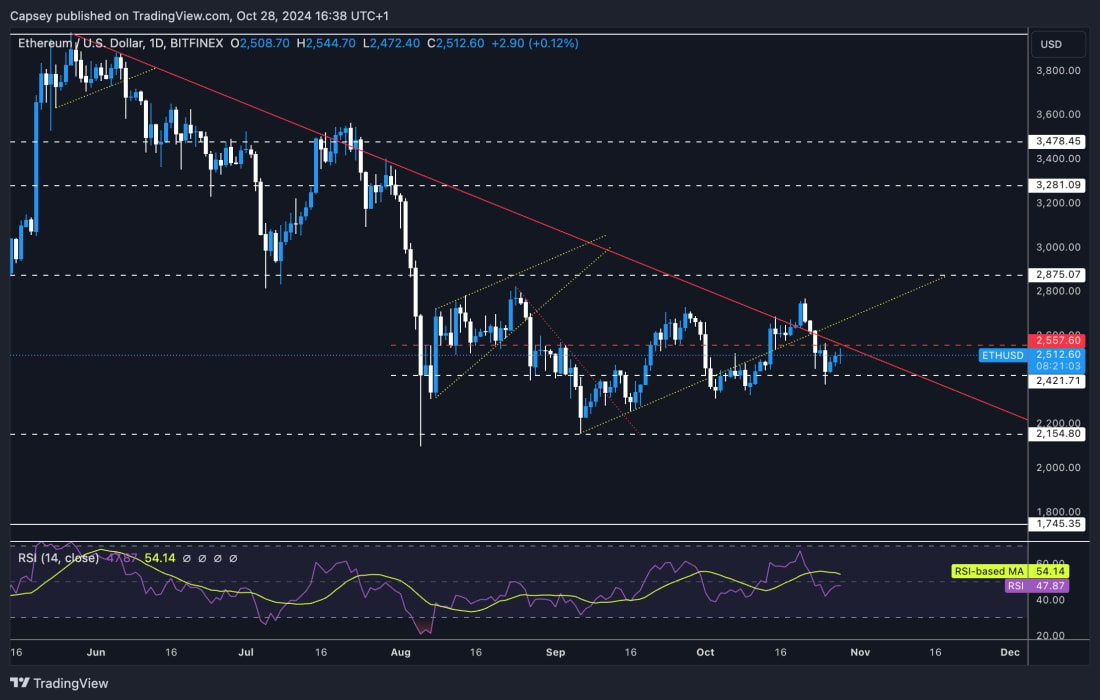
- Next Support: $2,420
- Next Resistance: $2,550
- Direction: Neutral
- Upside Target: $2,750
- Downside Target: $2,150
Cryptonary's take
ETH continues to underperform here and highlights this as BTC and SOL (the Majors) break out. ETH can't just hold the $2,550 level, but it actually breaks below that support. It's becoming more difficult to advocate for ETH with this kind of performance despite the chart suggesting that the lows are potentially in.However, just because the lows might be in doesn't necessarily mean that ETH will now perform well/outperform BTC and SOL. Overall, we're not too confident about ETH here as it just can't maintain any meaningful price level for a sustained period of time. If BTC breaks out, then ETH could reclaim $2,550 and potentially push on to $2,750, but we still see it as underperforming.
ETH lags despite BTC’s breakout: What happens next?
23 October 2024ETH is one of the main reasons we're not too optimistic about the market currently.
With BTC pumping hard, why is the top altcoin left behind? Let's analyse the technicals and indicators for clues on ETH's next move!
Disclaimer: Not financial or investment advice. You are responsible for any capital-related decisions you make, and only you are accountable for the results.
Technical analysis
Despite BTC and other major altcoins performing really well, ETH has gone up, but it has underperformed compared to other majors.The positive news is that ETH is now above the local resistance of $1,660 but met sellers into the $1,700 level. However, the weekly MA is at $1,698, and the price has been rejected so far at that point. BTC is well above its Weekly MA; ETH isn’t. We should mention that the main horizontal resistance is $1,745, and ETH is still far from that zone.
RSI and funding rates
The RSI is nowhere near overbought levels, currently at 62, which probably shows how much ETH has underperformed. For now, ETH does not look to be forming any divergences.Regarding funding, ETH is positive but at a middle level, unlike BTC, which is very positive. The open interest is also relatively low, indicating that this isn’t overheated here and could help push ETH higher. However, to get this, BTC will likely need to continue pushing higher or at least hold its current price.
Conclusion on trading ETH
If we were to open fresh longs/buys here, ETH might be the play simply because it may have more room to move. However, we feel it has underperformed, adding to our lack of confidence.Action
- ETH could surprise here and move later than other coins.
- However, so far, ETH’s move has underperformed, and we believe this shows an overall lack of confidence in ETH, and it would be dangerous to be ape’ing into new longs/buys here for ETH.
ETH faces resistance and support in a bullish setup
22 October 2024Ethereum faces key resistance at $2,700, with $2,550 support in focus. Will ETH break higher or pull back? Find out in today’s outlook.
Disclaimer: This is not financial or investment advice. You are responsible for any capital-related decisions you make, and only you are accountable for the results.
- ETH's Open Interest has increased substantially over the past week, suggesting traders are betting on ETH here.
- Funding is more meaningfully positive, suggesting traders are Long ETH. For now, the Funding Rate is contained, which is positive.
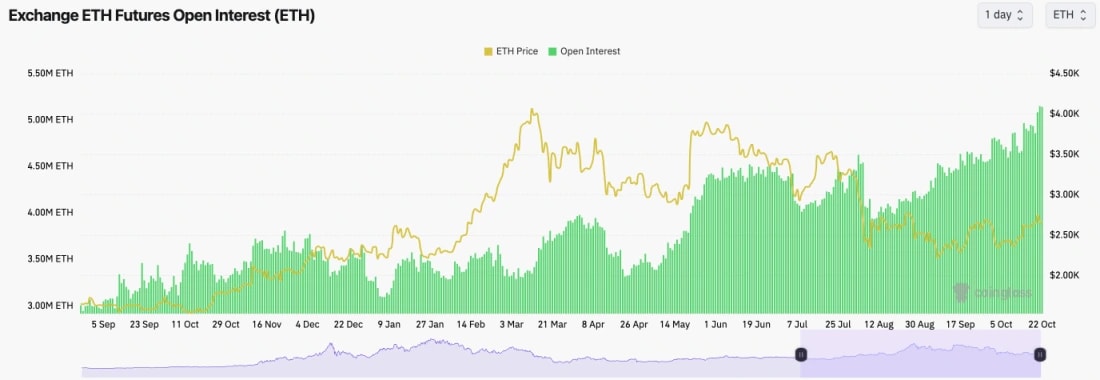
Technical analysis
- A really interesting move as ETH looked as if it was breaking out of its long-term downtrend line, and the local horizontal level of $2,700.
- The price was initially rejected, but it has found some support on top of the downtrend line and in the low $2,600's.
- ETH is also still in its local uptrend, having reclaimed the trend a week ago.
- The RSI was approaching the overbought level, but it has now meaningfully reset back to middle territory and is resting on top of its Moving Average.
- On the upside, the local resistance is at $2,700, and the main horizontal resistance is at $2,875.
- On the downside, the main support is at $2,550.
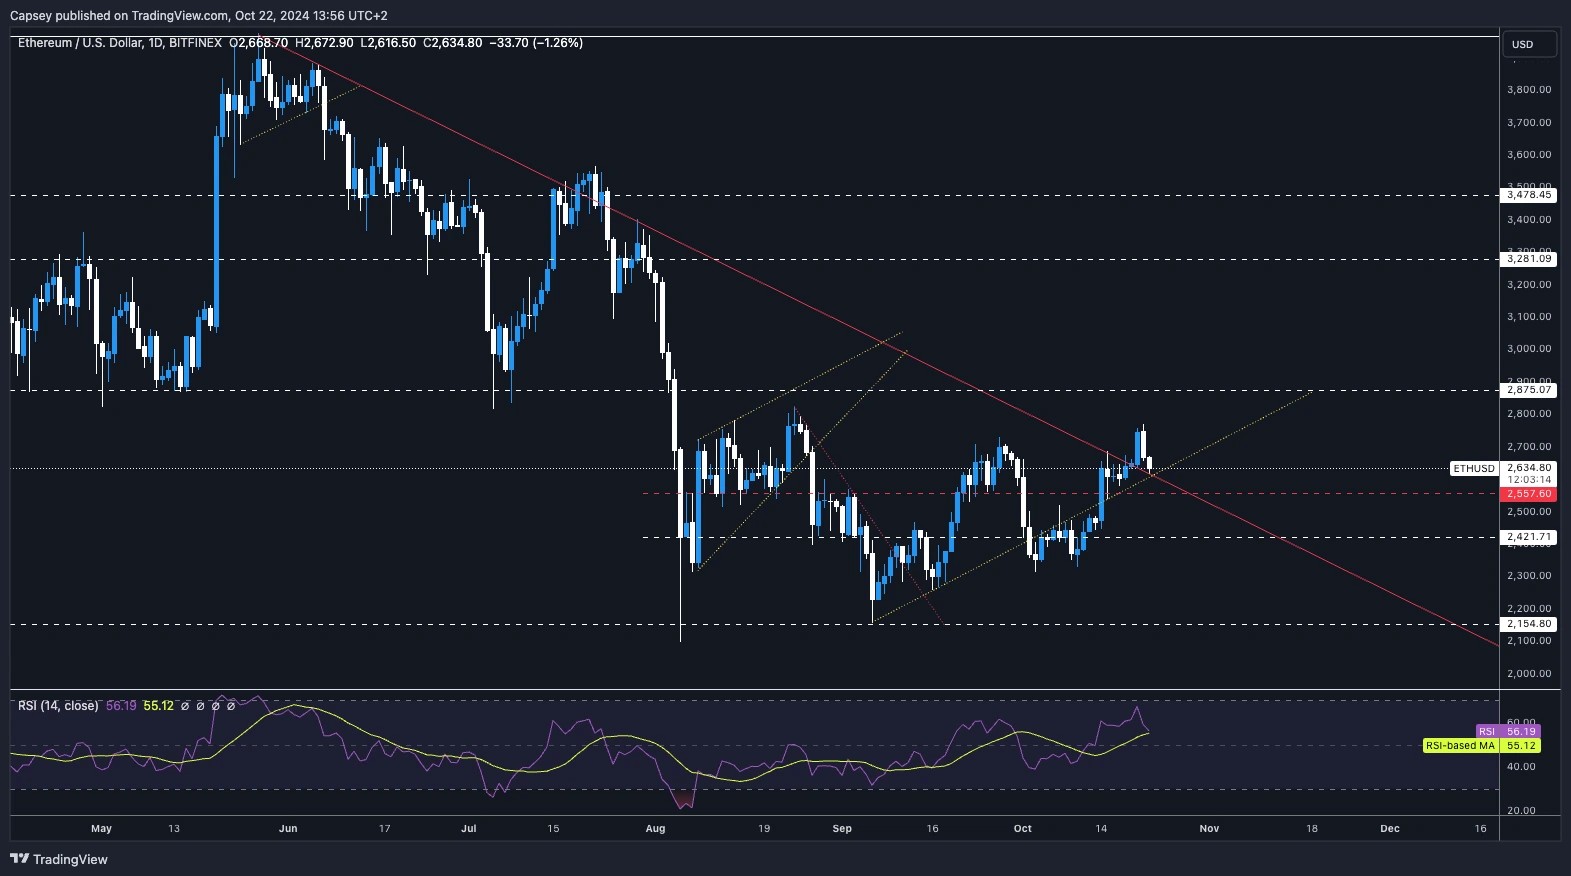
- Next Support: $2,550
- Next Resistance: $2,700
- Direction: Neutral/Bullish
- Upside Target: $2,875
- Downside Target: $2,550
Cryptonary's take
Even though ETH has pulled back a touch here, the outlook remains positive. ETH has broken out of a major downtrend line and is now retesting it as new support. Alongside this, the mechanic's setup is clean.Even though we're expecting more subdued price action until the election, ETH looks like one of the better plays for a potential meaningful move to the upside.
SOL/ETH ratio at 0.061: Will Solana hit 0.064 ATH soon?
18 October 2024Solana’s SOL/ETH ratio consolidates below 0.061 resistance, signaling a potential breakout towards 0.064 ATH. Is SOL ready to outperform Ethereum?
Disclaimer: This is not financial or investment advice. You are responsible for any capital-related decisions you make, and only you are accountable for the results.
Solana versus Ethereum is shaping up to be a battle of titans. SOL/ETH has been consolidating just under the 0.061 resistance level, preparing for what looks like its next major move. While Solana has held strong against Bitcoin, it's also quietly positioning itself to challenge Ethereum.
- Support: The 0.0533 level remains a key support, with the 200 EMA around 0.05 acting as a solid backup if we see any deeper pullbacks.
- Resistance: Solana is knocking on the door of the 0.061 resistance. If it breaks above this level, the next target is the 0.064 all-time high (ATH), which could be the launchpad for another major rally.
- Potential scenario: If SOL/ETH manages to push through the 0.061 resistance, we could see Solana outperform Ethereum in the short term, moving towards 0.064 ATH and possibly higher.
Conclusion
SOL/ETH is on the verge of breaking key resistance levels. If Solana manages to push through 0.061, it could be poised to outperform Ethereum, setting the stage for a major rally in the coming months.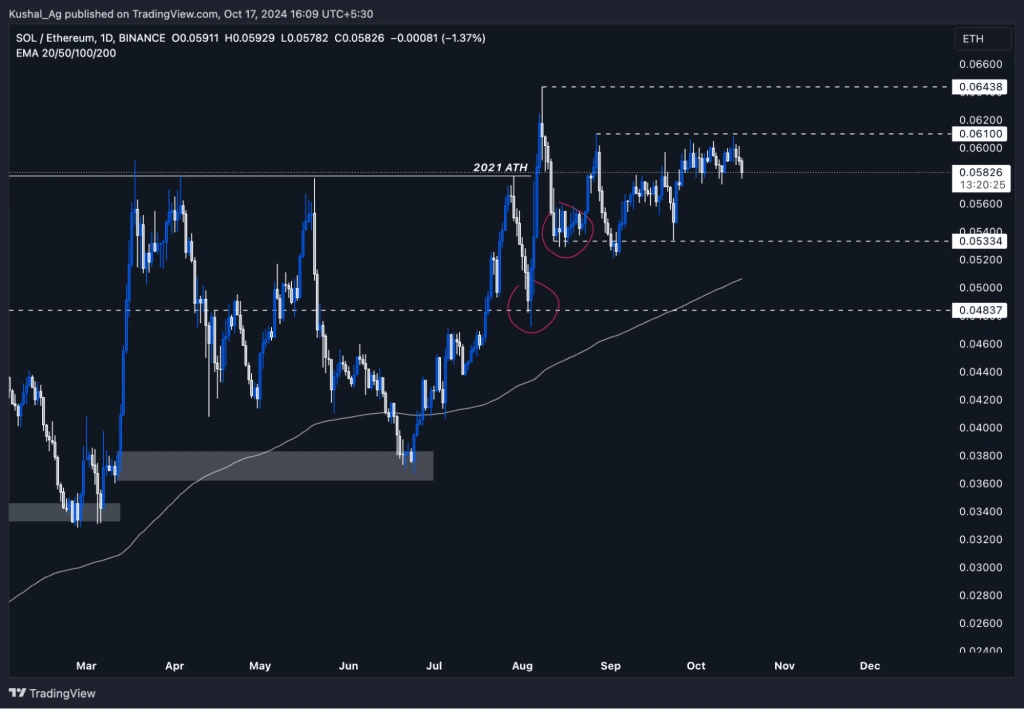 Apart from technical analysis, let's look at fundamentals a little bit for a better picture.
Inflation rate of SOL vs ETH
- Ethereum (ETH): Post-EIP-1559, Ethereum's inflation has been dynamic due to its burn mechanism. As of October 2024, Ethereum's inflation rate has stood at approximately -0.054% since the merger, with a significant supply reduction of 136K ETH over the last two years. Ethereum's deflationary mechanism, especially during high transaction periods, creates a supply scarcity that positions it as "ultrasound money," a narrative strengthened by the network's growing staked supply.
- Solana (SOL): In contrast, Solana has a much higher inflation rate. Its current inflation rate is 5.1%, which will gradually taper by 15% annually until it reaches a terminal rate of 1.5% in 2031. Further, Solana's burn mechanism, while active, has had a more limited effect compared to Ethereum. Only 1.1M SOL has been burned YTD, offsetting about 6% of the gross issuance. This fixed schedule makes Solana more inflationary in the short term but predictable for long-term investors.
Unlock vs. Pectra upgrade
- Solana's upcoming unlocks: One of the significant unlock events is expected in March 2025, which will release 7.5M SOL (worth $1.1B) into the market. Such unlocks typically can lead to sell pressure.
- Ethereum's Pectra upgrade: At the same time, Ethereum's next upgrade is scheduled for early 2025. The Pectra upgrade aims to enhance Ethereum's staking system, increasing validator staking limits from 32 ETH to 2,048 ETH. The upgrade will also improve gas efficiency, rollup scalability, and smart contract functionality, positioning Ethereum as a more scalable and secure platform. These enhancements are key for Ethereum's future dominance, especially in the growing institutional adoption of its Layer 2 solutions.
Layer 2s thesis: Ethereum vs Solana
- Ethereum's Layer 2 Ecosystem: Ethereum's success with Layer 2s is evident, with major institutions like Coinbase and Sony integrating their operations. Ethereum's rollups dramatically reduce gas fees and improve scalability, drawing more projects and users into its ecosystem. This institutional growth further reinforces Ethereum's leadership in decentralised applications (dApps), and the upcoming Pectra upgrade will only bolster this position.
- Solana's Scaling Strategy: Solana focuses on base-layer scaling, notably with its Firedancer initiative, which could enable the network to process over 1 million TPS per core. Unlike Ethereum's reliance on Layer 2s, Solana's core network is optimised for speed and low-cost transactions, giving it an edge in high-frequency trading and gaming sectors.
ETH/BTC ratio at 0.04: Will Ethereum reclaim 0.045 soon?
18 October 2024ETH/BTC ratio holds firm at 0.04. Will Ethereum reclaim 0.045 resistance and start outperforming Bitcoin soon? Discover key levels and scenarios today.
Disclaimer: This is not financial or investment advice. You are responsible for any capital-related decisions you make, and only you are accountable for the results.
Ethereum is sitting at a crossroads. For the past six weeks, the ETH/BTC pair has clung to the 0.04 support level, refusing to break down despite multiple tests. This is more than just consolidation- this is Ethereum holding the line, preparing for what could be a defining reversal against Bitcoin.
- Support: The 0.04 grey zone is rock solid, and even if the price wicks down to 0.035, this area is shaping up to be Ethereum's bottom against Bitcoin.
- Resistance: To really get things moving, ETH/BTC needs to reclaim the 0.045 level. This is where we start seeing Ethereum taking back some control from Bitcoin.
- Potential scenario: The longer Ethereum holds this support, the stronger the eventual move. Once it breaks 0.045, expect capital to flow heavily into ETH, giving it the momentum to start outperforming Bitcoin in the coming months.
Conclusion
Ethereum has been quietly holding its ground, and the pressure is building. With key support intact, the next leg up could see Ethereum lead the charge in this bull run.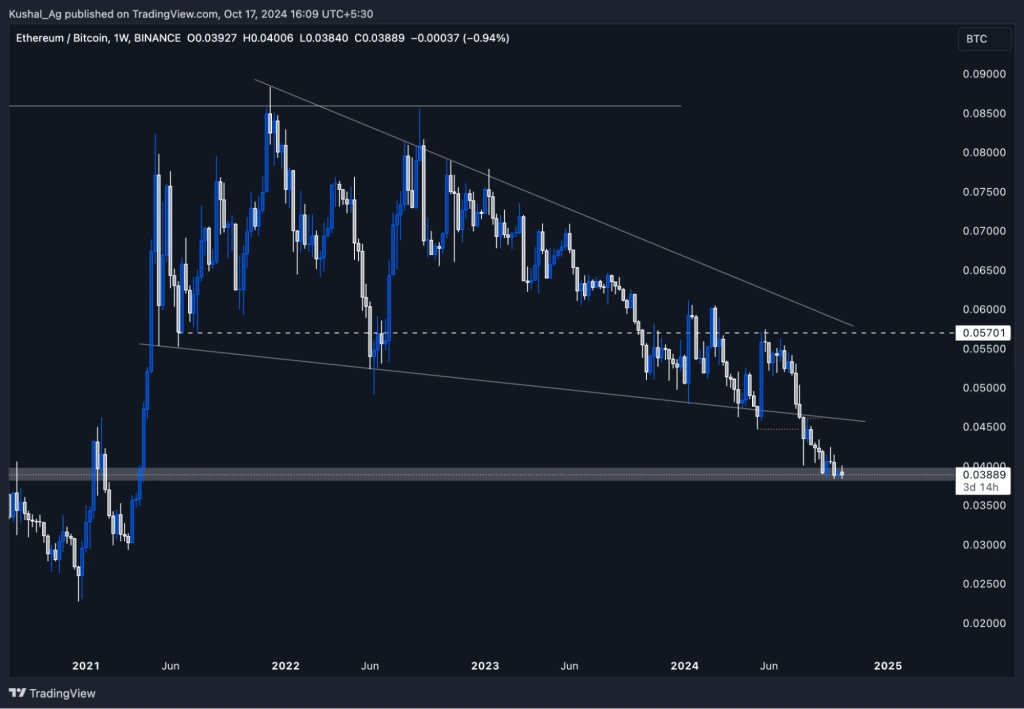
Ethereum eyes $2,420 support zone
18 October 2024ETH tests $2,725 resistance today. Can Ethereum reach $2,875 or fall to $2,557 support? Dive into today’s ETH price analysis and insights.
Disclaimer: This is not financial or investment advice. You are responsible for any capital-related decisions you make, and only you are accountable for the results.
- ETH's Open Interest is at all-time highs, and despite Funding decreasing slightly from positive levels (arguably a good sign), the Spot CVD has increased and is close to monthly highs.
- The price increase has been supported by Spot buying, not just leveraged Longs. This is positive for price action.
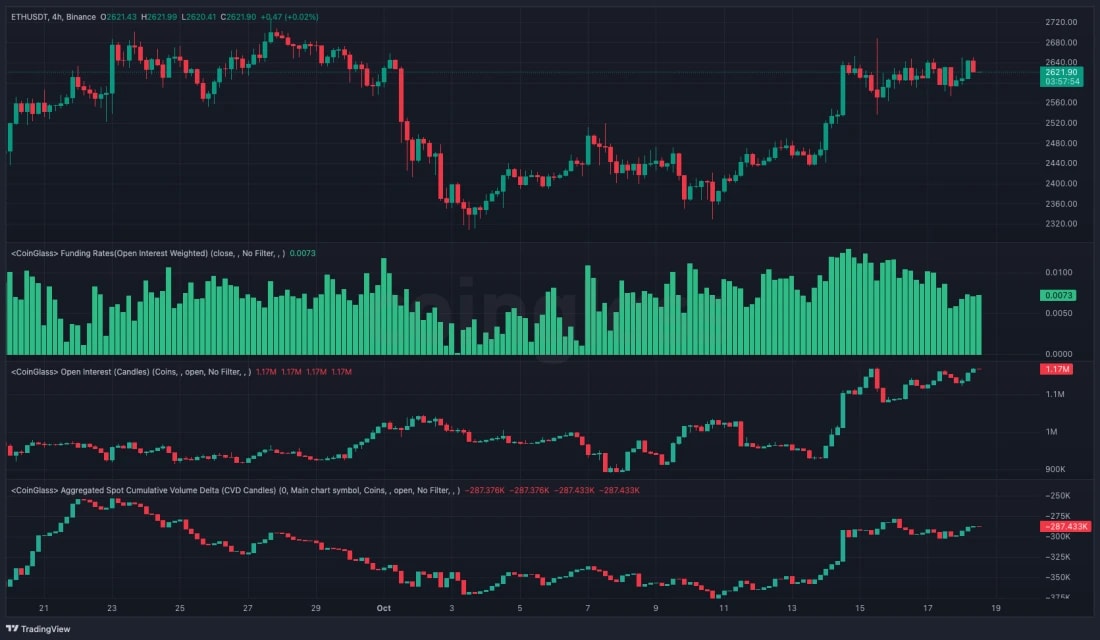
Technical analysis
- Price has reclaimed the local uptrend line and is now above the local horizontal level of $2,557.
- Price is now also butting in to the main downtrend line and forming a bullish pennant. The breakout target of this would be $2,725.
- The main resistance above price is at $2,875, although there is a local level at $2,725.
- To the downside, we'd expect the range between $2,420 and $2,557 to provide ample support.
- The RSI is still relatively in the middle territory at 59, so it is not yet close to being overbought.
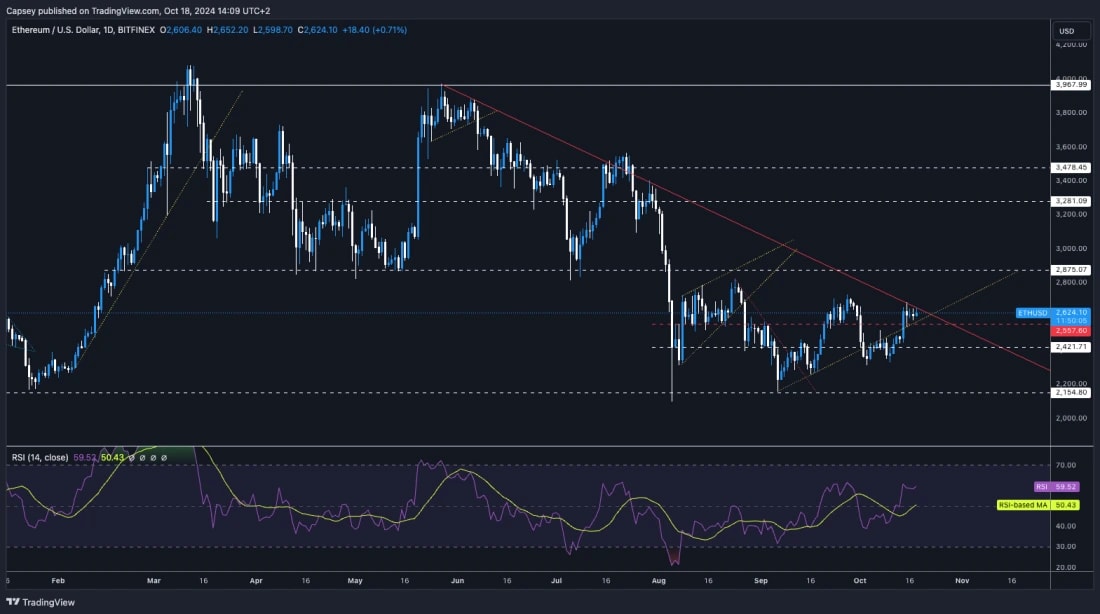
- Next Support: $2,557
- Next Resistance: $2,725
- Direction: Bullish
- Upside Target: $2,875
- Downside Target: $2,557
Cryptonary's take
From both a mechanics and TA perspective, ETH looks great here. If BTC holds up, we would expect ETH to break out of its main downtrend line and potentially swiftly head higher to $2,875.Ethereum fights to reclaim $2,557 amid resistance
14 October 2024ETH is fighting to reclaim $2,557 support, targeting a potential breakout to $2,700. Let’s explore Ethereum’s price outlook for today.
Disclaimer: This is not financial or investment advice. You are responsible for any capital-related decisions you make, and only you are accountable for the results.
- We're seeing a large Spot bid come in (seen in increasing CVD). However, Open Interest has increased substantially, with Funding Rates quite positive, suggesting Longs have also piled in over the last 24 hours.
- Overall, this is a positive setup, particularly due to the Spot buying we've seen come in.
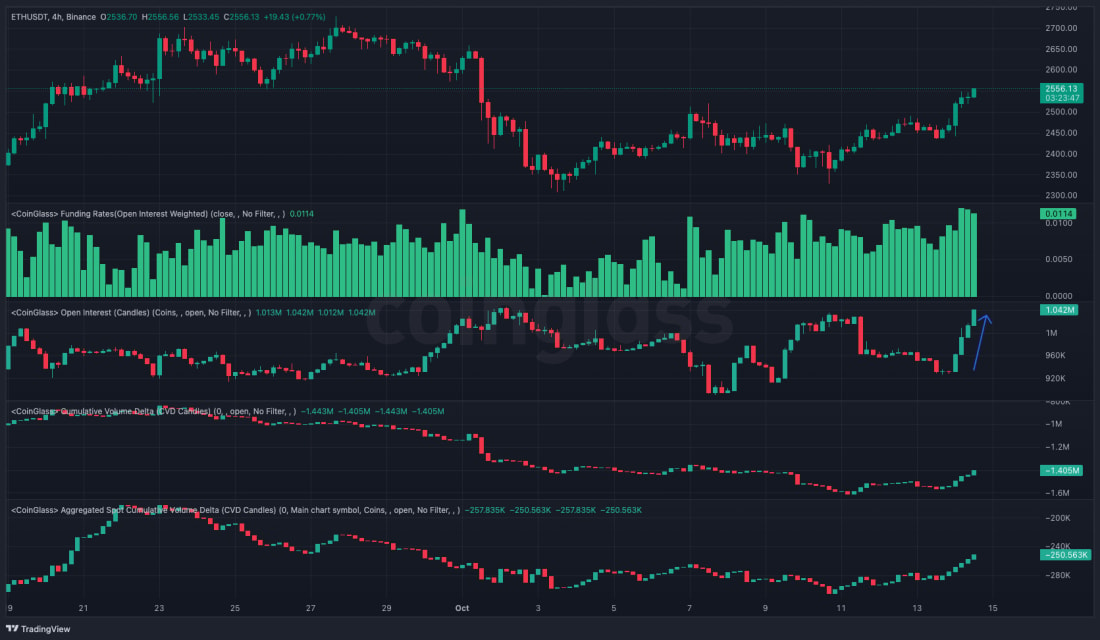
Technical analysis
- Price is currently trying to reclaim back above the local uptrend line and the horizontal resistance of $2,557.
- The resistances for price will be the horizontal level of $2,557 and the main downtrend line.
- On the downside, the support will be $2,420 locally, and if there is a harder breakdown, $2,150 is the ultimate level.
- The RSI is breaking out higher, but it's still in the middle territory and nowhere near overbought territory - positive.
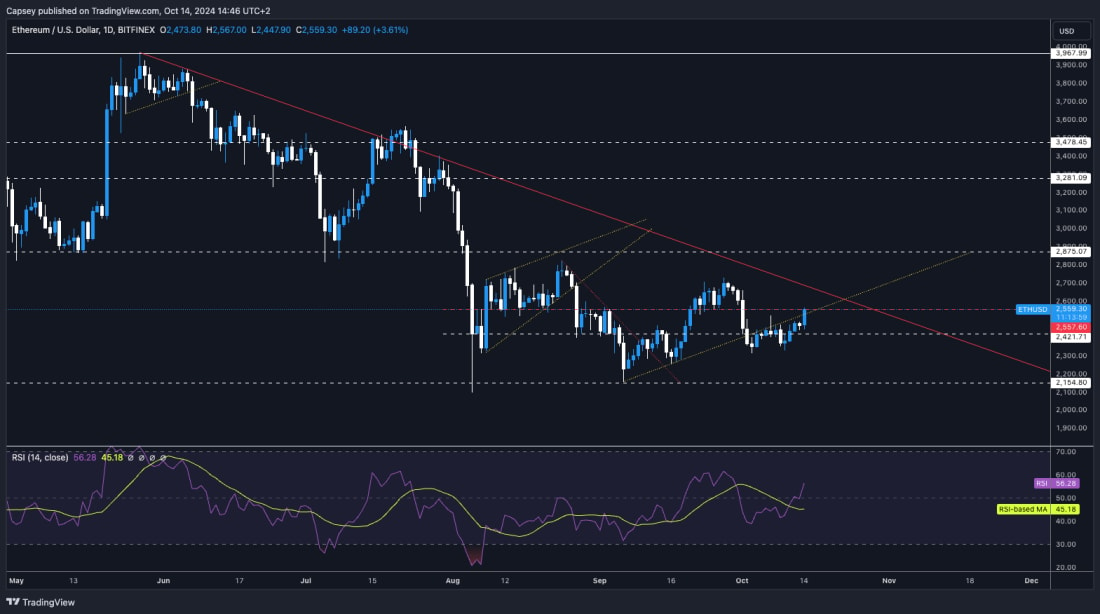
- Next Support: $2,557
- Next Resistance: $2,700
- Direction: Neutral
- Upside Target: $2,700
- Downside Target: $2,557
Cryptonary's take
ETH has a number of resistances that are just above the current price. However, we've seen good strength so far in today's move. We will now have to see if this has been followed through further. Over the coming days, it's possible we will see the price range bound between $2,420 and $2,600. If the price can hold above $2,557, that would be positive if the price can hold above the resistance line. This might also potentially set for a stronger move higher that could see a price breakout from the downtrend line.Can EThereum break $2,557 today?
11 October 2024Ethereum is stuck between $2,300 support and $2,557 resistance. Will ETH break above or remain neutral today? Check out the latest price forecast and analysis.
Disclaimer: This is not financial or investment advice. You are responsible for any capital-related decisions you make, and only you are accountable for the results.
- Interestingly, ETH's Open Interest has soared to a new high.
- And whilst both BTC and SOL currently have negative funding rates (Short bias amongst traders), ETH's is positive at 0.01%.
- Perhaps we're beginning to see traders position bullishly for ETH.

Technical analysis
- ETH remains below its local uptrend line, whilst price is currently battling at the $2,420 horizontal level.
- If ETH can break out to the upside, it will need to reclaim the uptrend line, the main horizontal resistance at $2,557 and now potentially also the main downtrend line (red line).
- To the downside, we expect $2,300 to be local support, with the major support at $2,150.
- The RSI is in the middle territory but is not potentially running into resistance to its moving average.
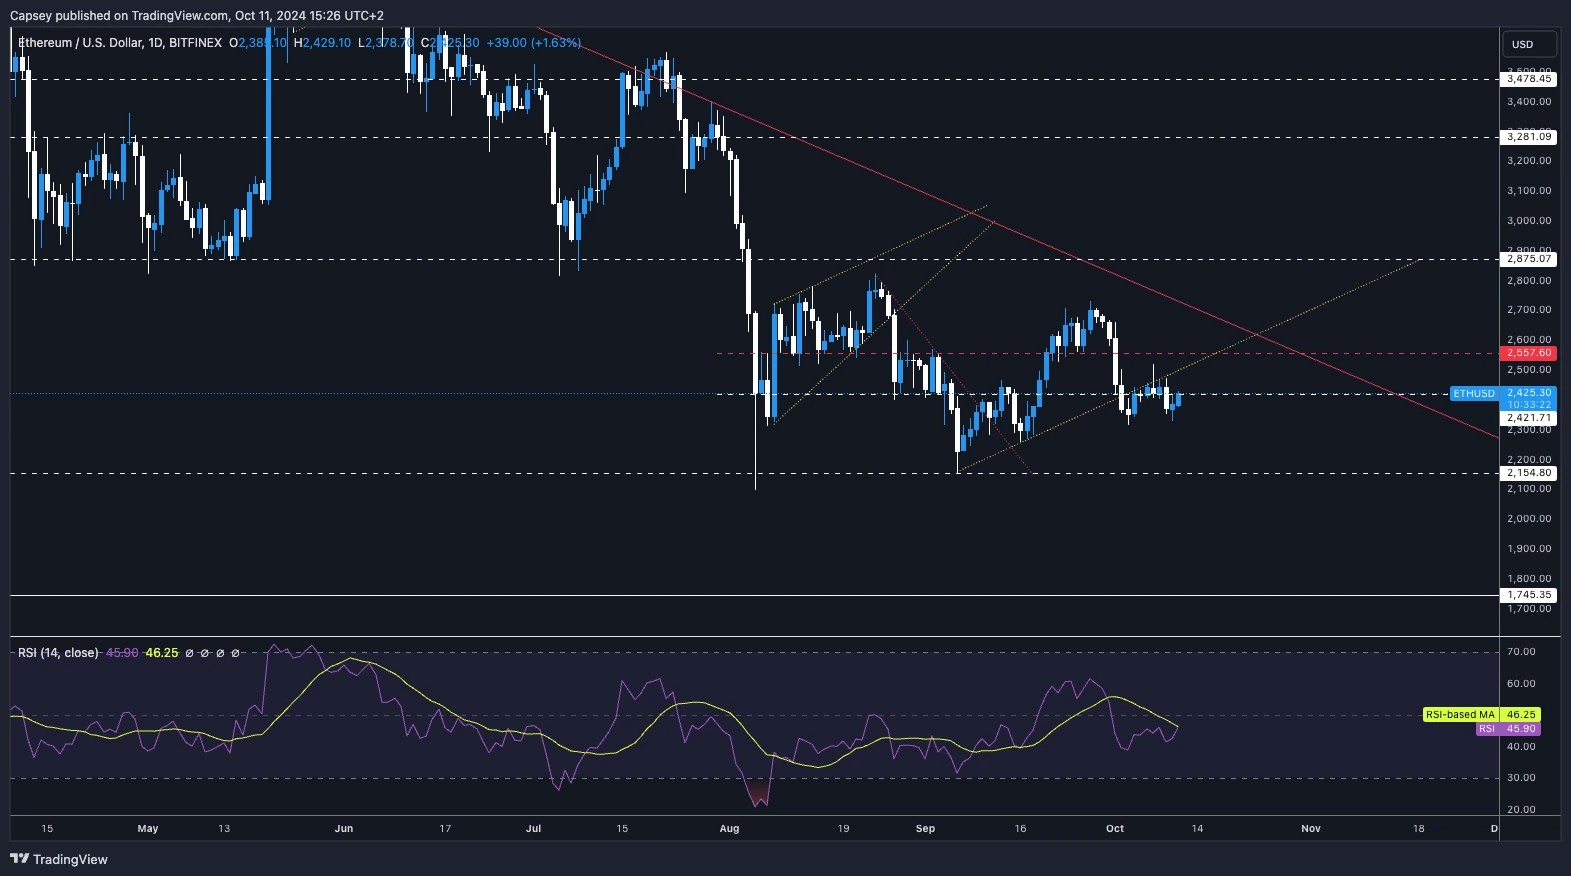
- Next Support: $2,300
- Next Resistance: $2,557
- Direction: Neutral
- Upside Target: $2,557
- Downside Target: $2,300
Cryptonary's take
Chart-wise, ETH still looks to be struggling as it's currently beneath a few key resistances. If we're right and Crypto in general can grind slightly higher over the weekend, then this may help ETH to move up to $2,557.However, we still expect the market to be somewhat subdued, so over the coming week, we'd expect the price to be range-bound between $2,300 and $2,557. A breakout of $2,557 we'd take as the bullish signal and the potential sign of a larger timeframe bullish reversal.
ETH faces strong resistance as market data looms
07 October 2024ETH's price remains below $2,557, and it struggles to show strength against other assets. With support at $2,420, Ethereum looks to reclaim higher levels. Can positive market data help ETH break out and target $2,700 soon?
Disclaimer: This is not financial or investment advice. You are responsible for any capital-related decisions you make, and only you are accountable for the results.
- Like BTC, ETH's Funding Rate has been positive but fluctuated.
- Open Interest kicked up a week ago, but it has downtrended slightly since ETH dropped from $2,700.
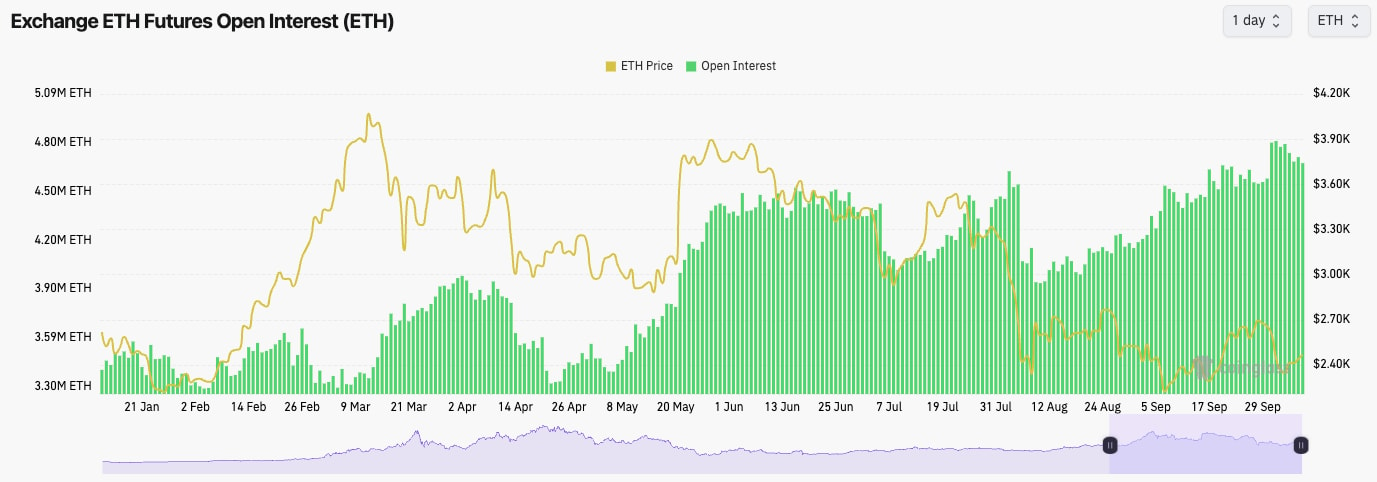
Technical analysis
- Price-wise, ETH continues to struggle and is not showing strength against other assets.
- Having lost the horizontal level of $2,557, ETH broke below its local uptrend and is now battling to reclaim it.
- To the downside, there is local support at $2,420 that we expect to hold. The major support is at $2,150; we don't expect that to be retested.
- To the upside, the clear level to reclaim back above is $2,557, with the major resistance beyond that at $2,875.
- The RSI is back to middle territory but beneath the Moving Average.
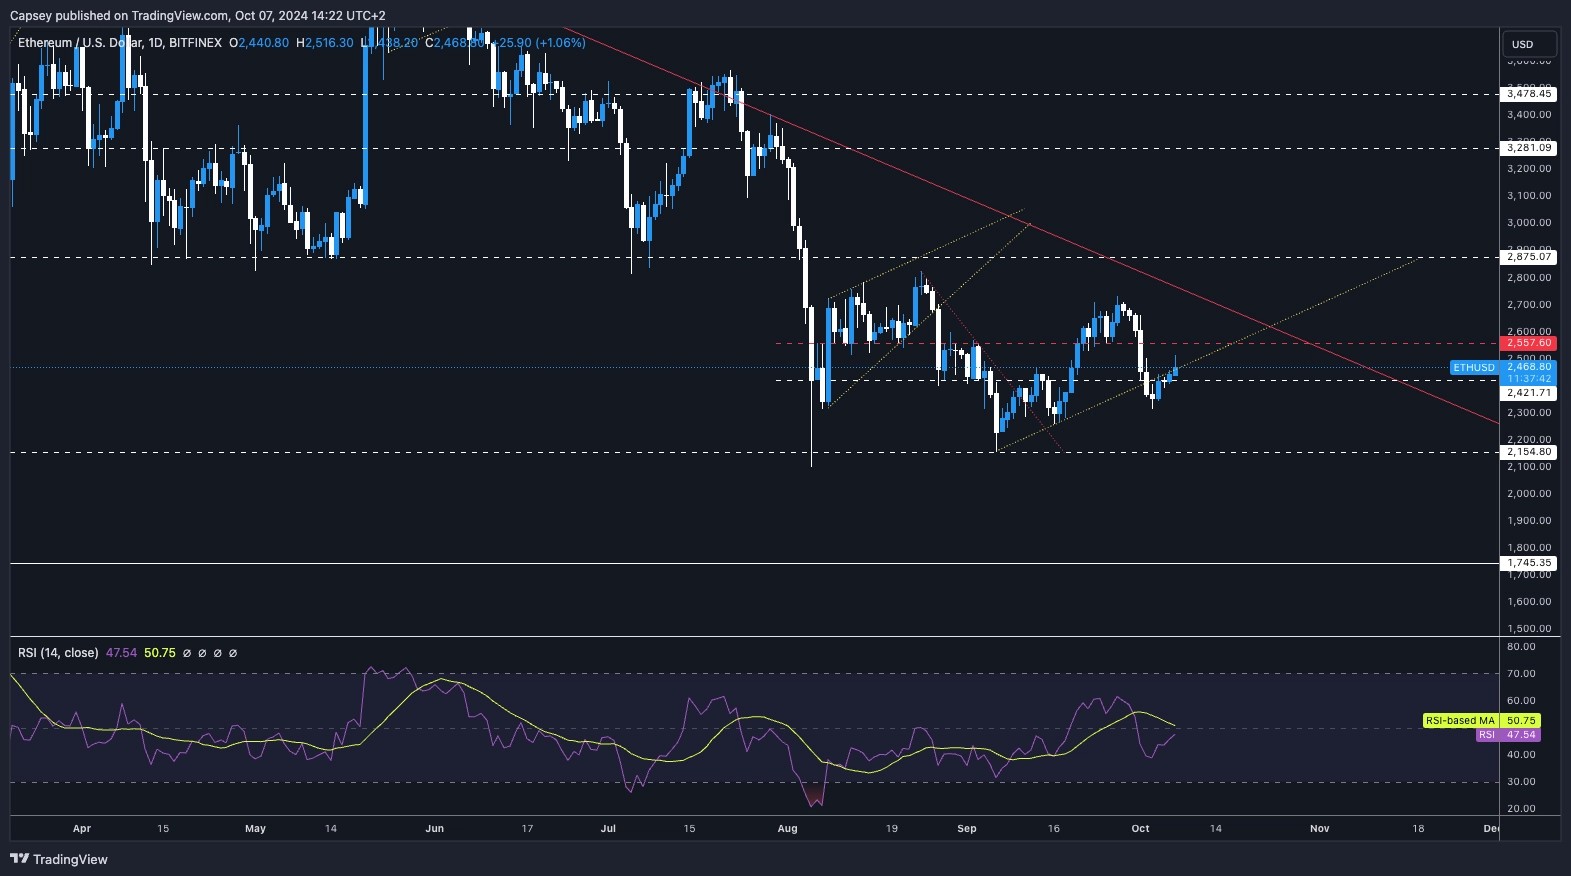
- Next few days prediction: Neutral ($2,300 to $2,557 range)
- Next 7 days prediction: Neutral-to-bullish
- Next 7 days price target: $2,557 to $2,700 range reclaim
Cryptonary's take
ETH just continues to underperform, and with other Majors (BTC and SOL) having reclaimed some supports and now in better areas of their price ranges, ETH still struggles beneath $2,557, with its better/upper range being between $2,557 and $2,875.Until ETH can break out of $2,557 and also break out of the main downtrend line (red line), the case for continuing to hold ETH against other assets is becoming a harder argument. We expect ETH to chop between $2,300 and $2,557 over the next few days. If we see positive inflation data on Thursday, this may help ETH break out above $2,557.
ETH eyes $2,557 breakout attempt
02 October 2024ETH's open interest rose as the price holds $2,420 support and $2,557 resistance.
Disclaimer: This is not financial or investment advice. You are responsible for any capital-related decisions you make, and only you are accountable for the results.
- Interestingly, ETH's Open Interest increased over the past few days as prices declined, and the Funding Rate remained positive.
- This suggests that the selling came from Spot rather than Perps, and more leverage went on as the price declined, likely new Longs.
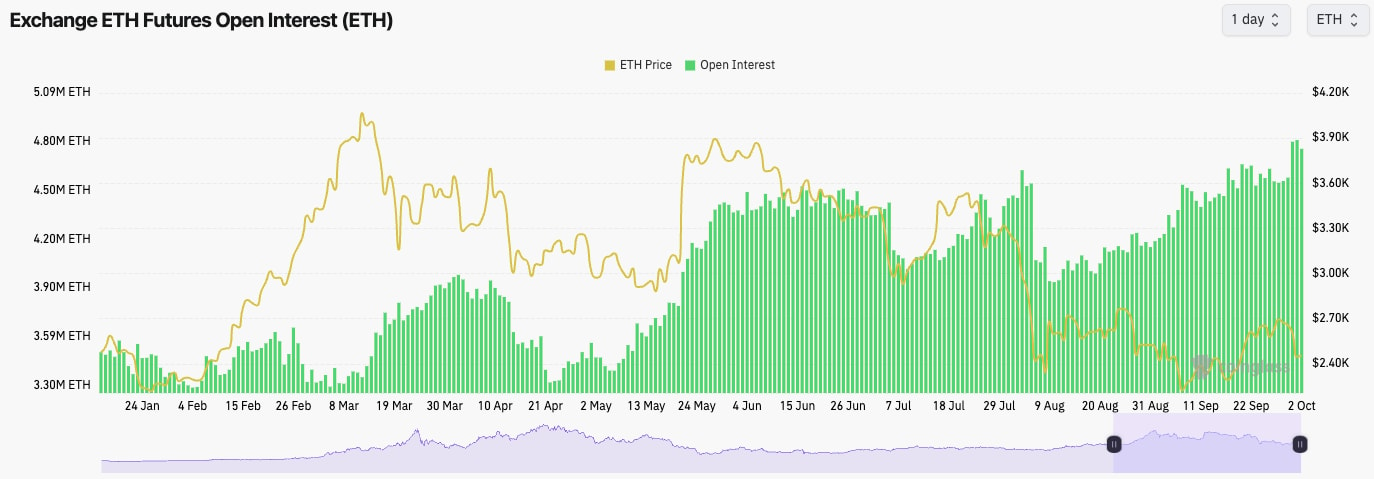
Technical analysis
- ETH was rejected from the $2,700 and was not able to hold above the local horizontal support of $2,557.
- Price has since fallen in to the $2,400's although it is still holding above it's local uptrend line.
- The $2,420 line could be considered local support.
- On this price pullback, the RSI has meaningfully reset, which is positive.
- Price is slowly moving closer to the main downtrend line, although it does now have the horizontal level of $2,557 above the current price which may act as a resistance in the short-term.
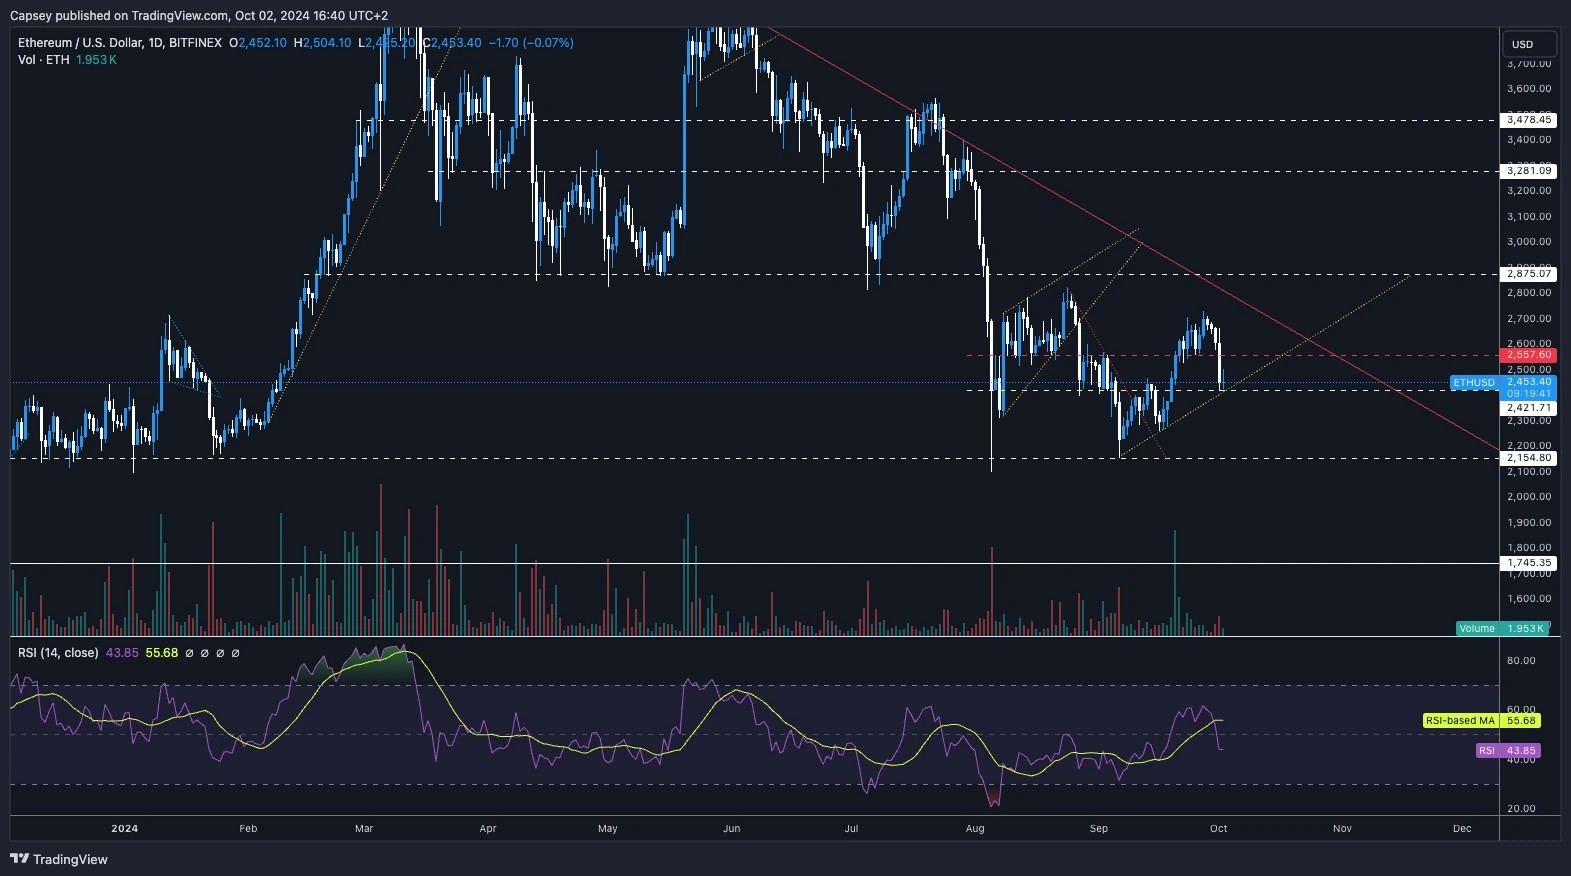
Cryptonary's take
It's possible that ETH remains subdued and just range-bound at this lower range between $2,400 and $2,557, although we wouldn't rule out a deviation into the $2,300's before potentially a quick recovery back to the upside. We still believe that the ETH lows were most likely in the back when we saw the $2,105 print in early August.ETH targets $2,875 resistance soon
01 October 2024ETH has reclaimed the $2,557 level with strong support and is now aiming for resistance between $2,800 and $2,875.
- ETH's Funding Rate has remained positive, but it hasn't overheated at all, whilst the Open Interest has stayed relatively high.
- Overall, this is a healthy setup.
Disclaimer: This is not financial or investment advice. You are responsible for any capital-related decisions you make, and only you are accountable for the results.
ETH's open interest:
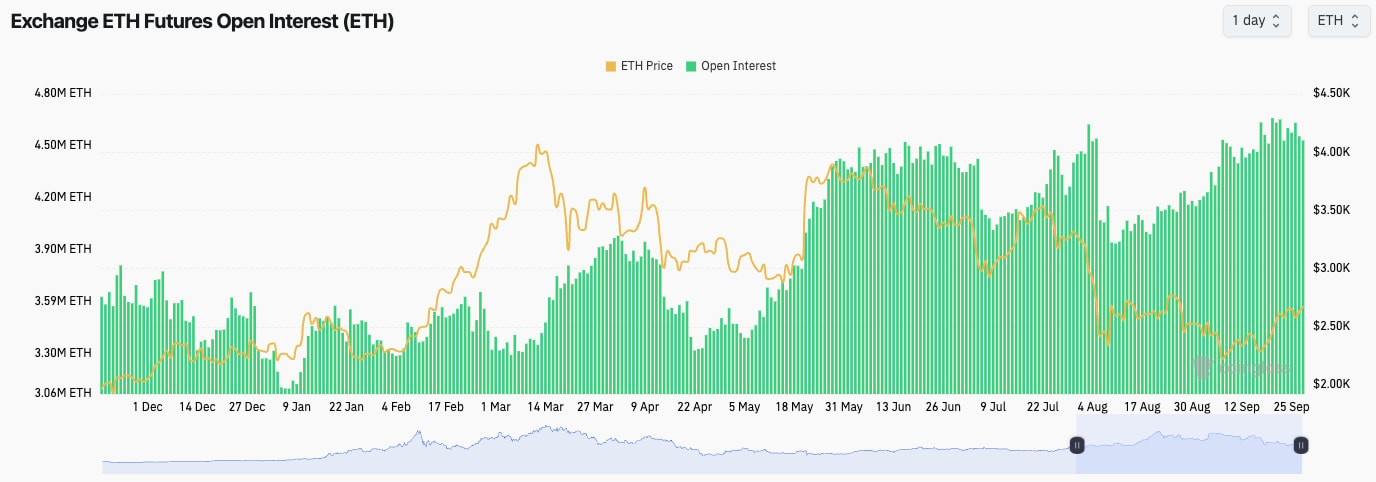
Technical analysis
- ETH has bounced from the $2,300 lows, as we predicted.
- ETH has now reclaimed back above the key horizontal level of $2,557 and price has now built support on top of this level. Positive.
- The RSI is high at 60 but not really anywhere close to overbought levels. Therefore, this opens the door for more upside for ETH in the short term.
- If the price does move higher, it may find resistance between the $2,800 (downtrend line) and $2,875 (the horizontal resistance).
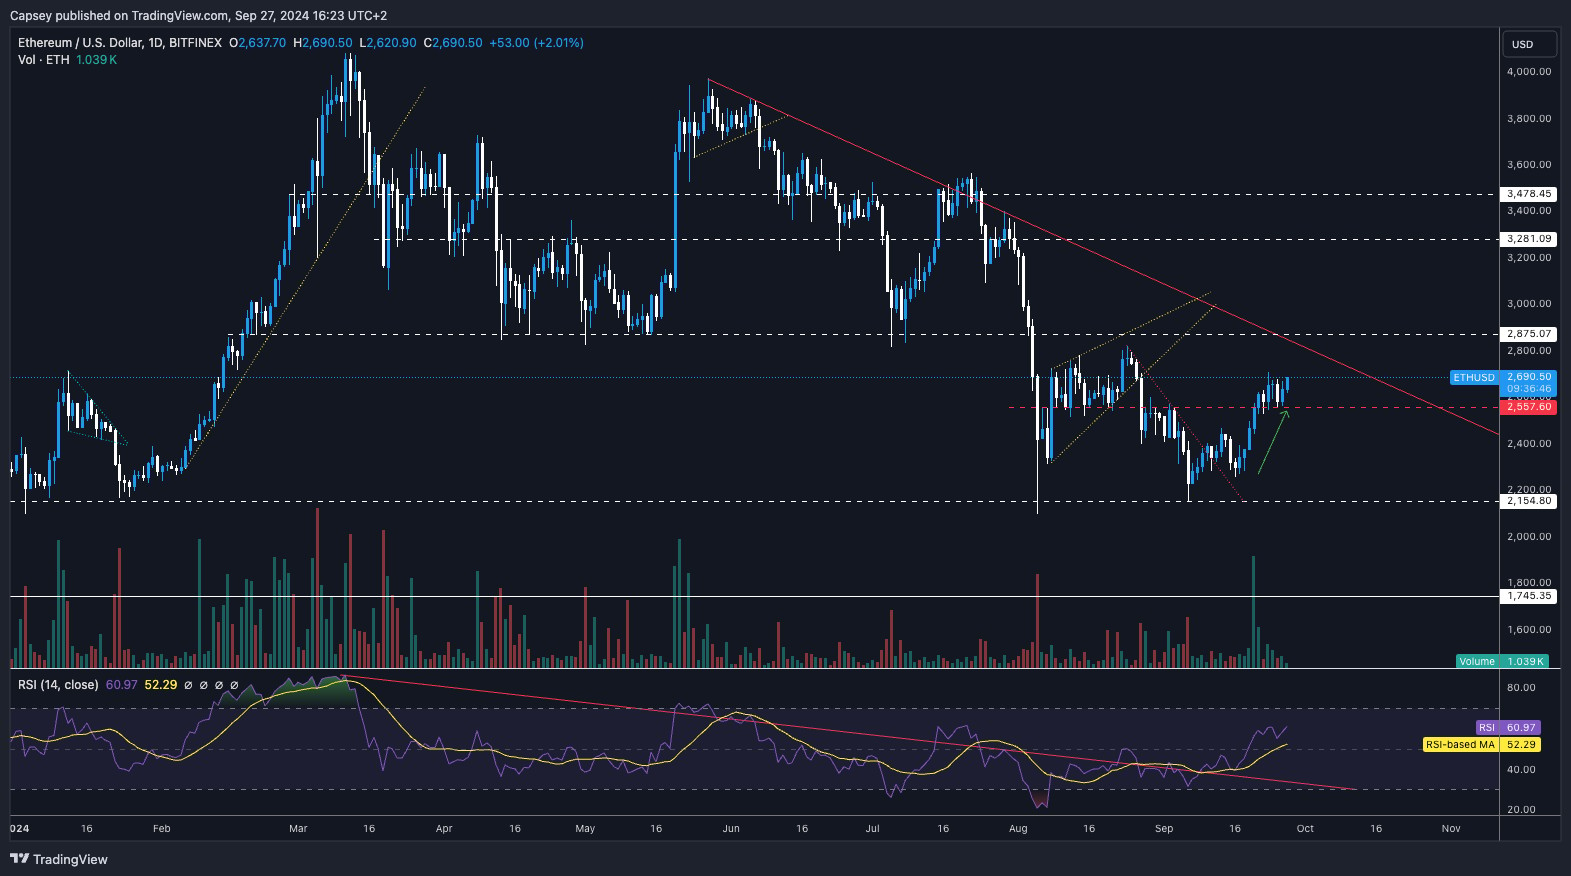
Cryptonary's take
ETH is looking really clean here to potentially go higher, and to go higher quickly. If there isn't a major pullback from BTC, we think ETH can get a tailwind from this and drive up higher in the short term, potentially retesting the $2,800 to $2,875 levels.Ethereum (ETH) price prediction today: Is $2,875 within reach?
27 September 2024- ETH's Funding Rate has remained positive, but it hasn't overheated at all, whilst the Open Interest has stayed relatively high.
- Overall, this is a healthy setup.
Disclaimer: This is not financial or investment advice. You are responsible for any capital-related decisions you make, and only you are accountable for the results.
ETH's open interest:
Technical analysis
- ETH has bounced from the $2,300 lows, as we predicted.
- ETH has now reclaimed back above the key horizontal level of $2,557 and price has now built support on top of this level. Positive.
- The RSI is high at 60 but not really anywhere close to overbought levels. Therefore, this opens the door for more upside for ETH in the short-term.
- If price does move higher, it may find resistance between the $2,800 (downtrend line) and $2,875 (the horizontal resistance).
Cryptonary's take
ETH is looking really clean here to potentially go higher, and to go higher quickly. If there isn't a major pullback from BTC, we think ETH can get a tailwind from this and drive up higher in the short-term, potentially retesting the $2,800 to $2,875 levels.What is Ethereum: Ethereum (ETH) is a groundbreaking decentralized platform that facilitates the creation and execution of smart contracts and decentralized applications (dApps) without the need for intermediaries. Launched by Vitalik Buterin in 2015, Ethereum's innovative blockchain technology enables a wide range of applications and has become a cornerstone of the decentralized finance (DeFi) space. Ethereum's ATH is $4,868.
How to buy ETH:
- Via Centralized Exchange (CEX):
- Select a CEX like Binance, Coinbase, or Kraken.
- Sign up and complete any verification processes.
- Deposit funds into your account.
- Go to the ETH trading section and purchase ETH.
ETH/BTC ratio today: Can ETH break the key 0.046 resistance?
26 September 2024Current state: In our previous report, ETH/BTC was caught in a choppy sideways range, with price action hovering around the 0.046 resistance. We mentioned that a break above this level would be a signal for a reversal, but at the time, a reversal seemed unlikely. Since then, ETH/BTC has moved lower, finding strong support at a major level marked by the grey box.
Key observations
- Support: The grey support zone has proven to be a solid foundation for ETH/BTC, helping to stabilise the pair. Price has adhered to this level, showing strength after the recent bottoming-out process.
- Resistance: The 0.046 resistance remains the key level to watch. ETH/BTC will need to reclaim this level to confirm a reversal and signal further strength in Ethereum.
- Potential scenario: With the pair now showing signs of recovery from its support, we can expect a move back toward the 0.046 level in the coming weeks. A successful break above this resistance could lead to ETH/BTC regaining strength, with more capital flowing into Ethereum and potentially kick-starting a broader altcoin rally.
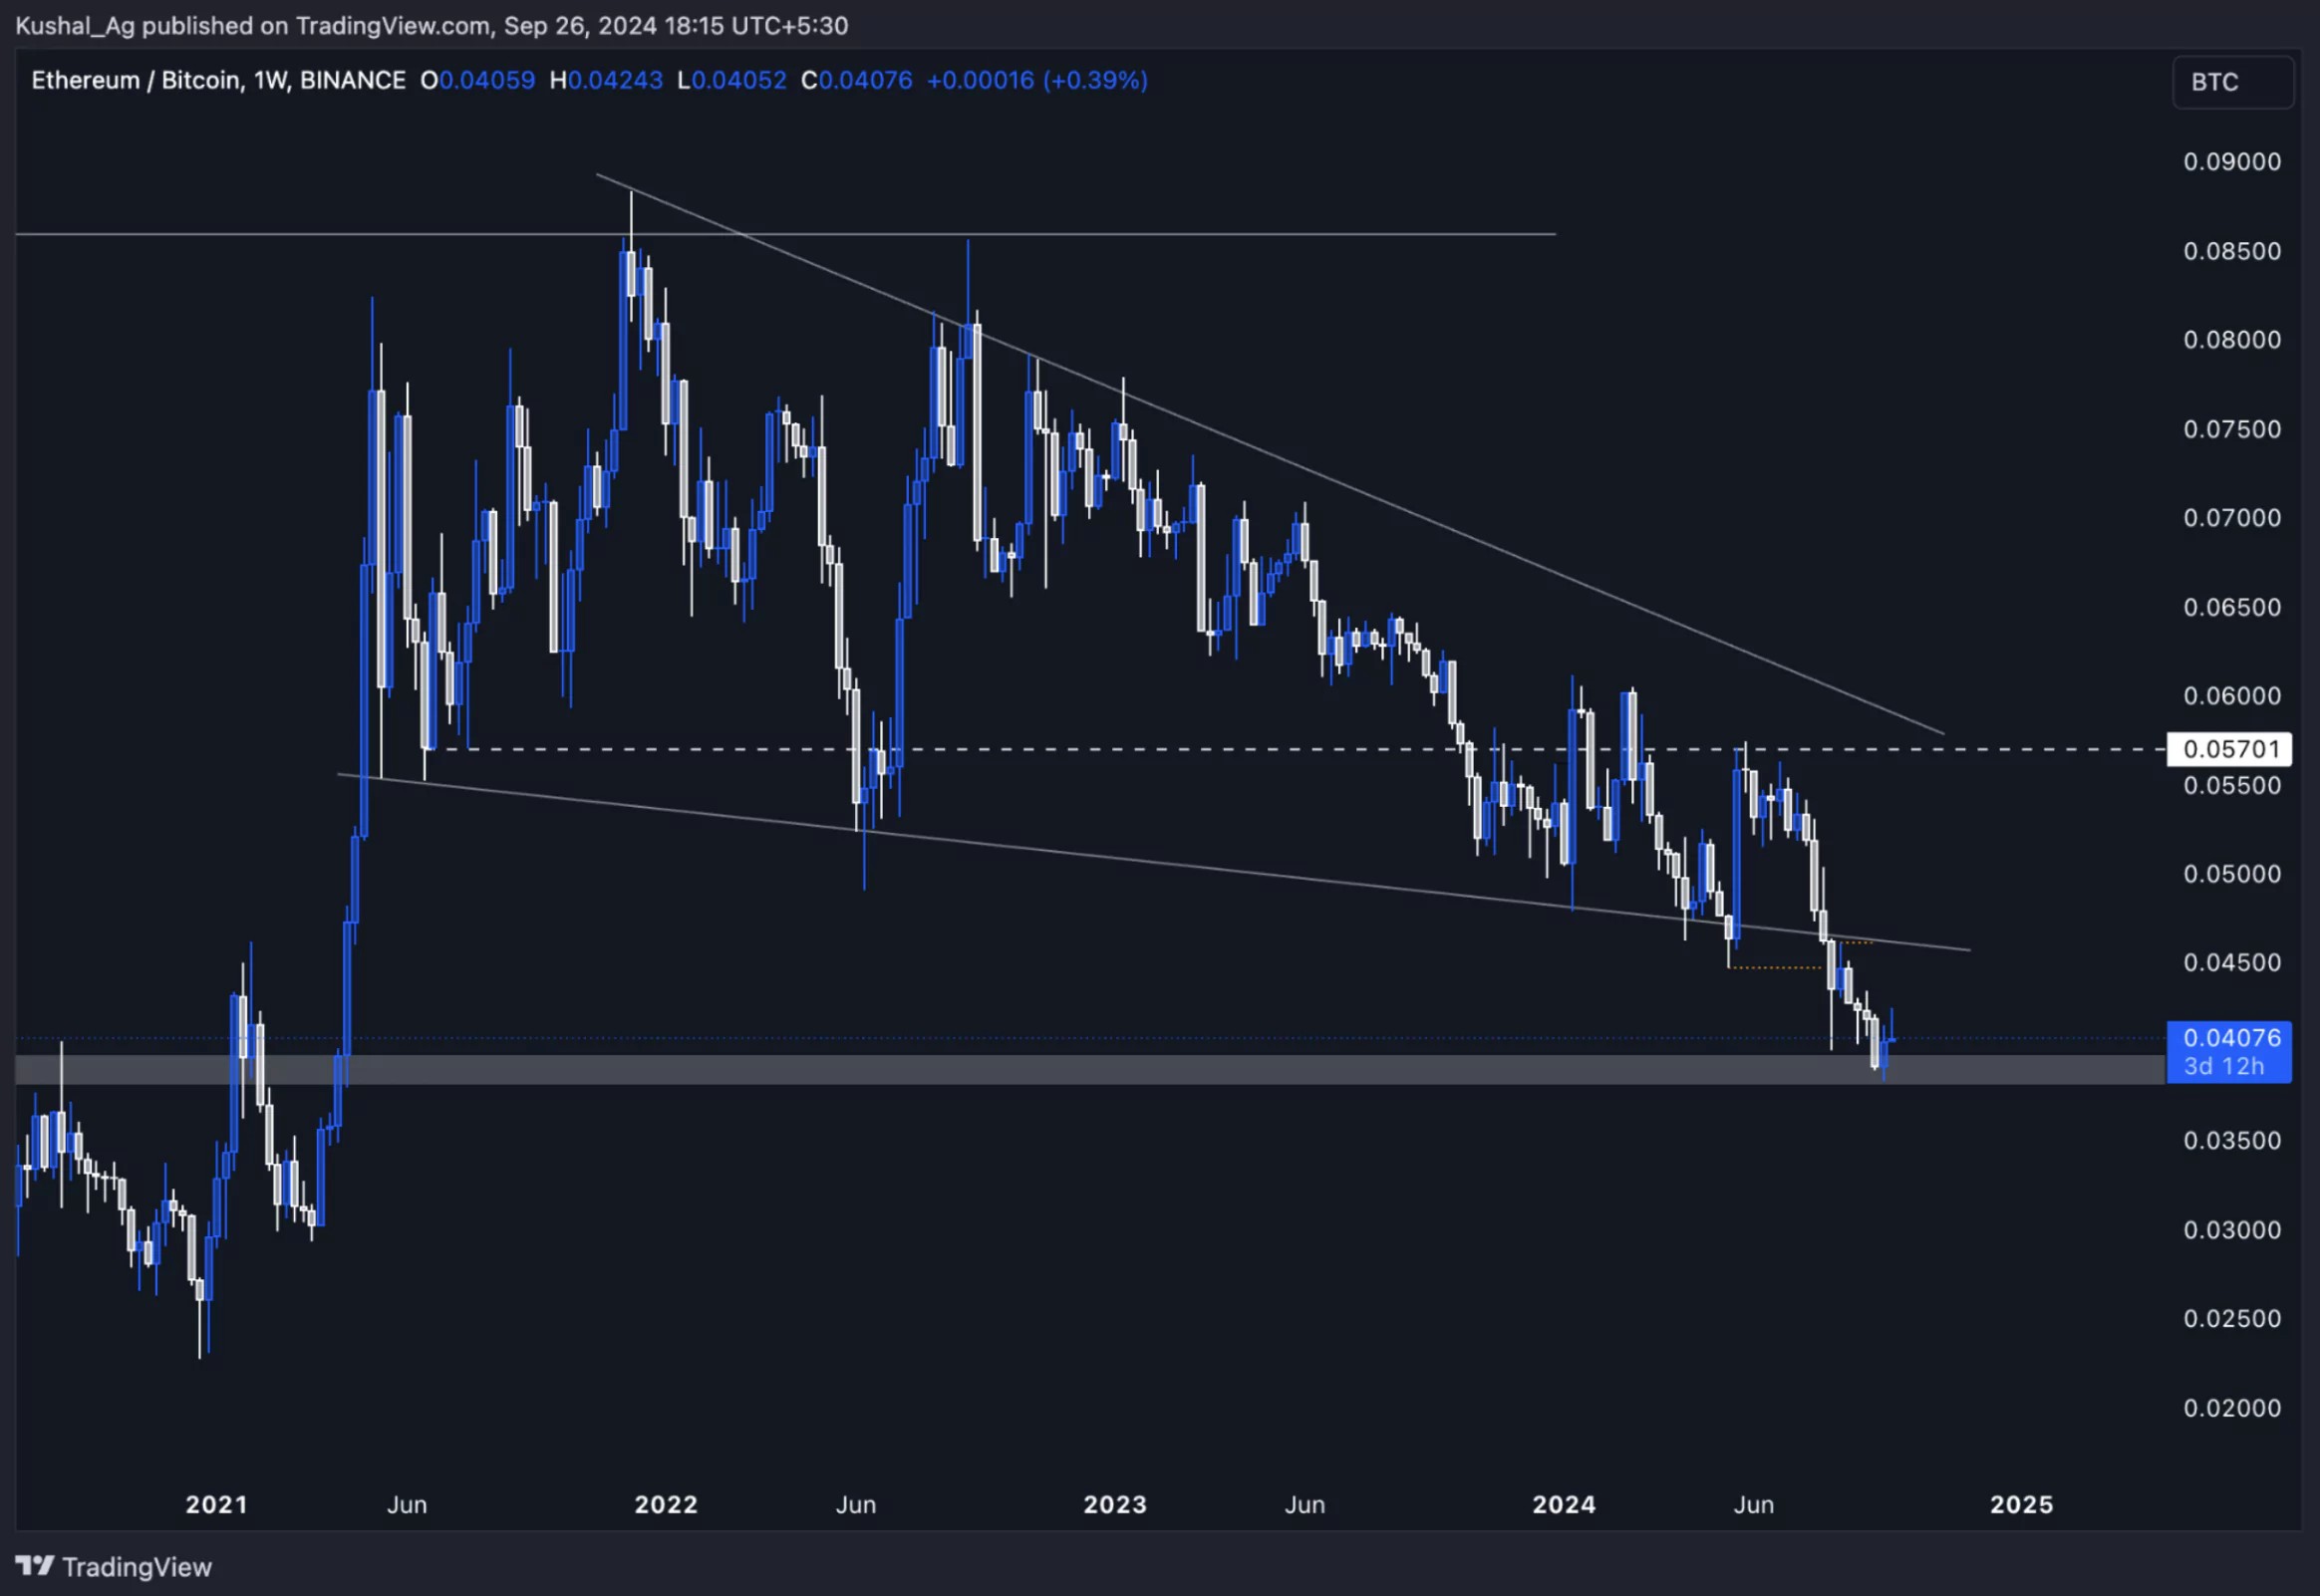
Disclaimer: This is not financial or investment advice. You are responsible for any capital-related decisions you make, and only you are accountable for the results.
Conclusion
ETH/BTC appears to have found a bottom at the grey support zone, and a move toward the 0.046 resistance is on the horizon. The pair is looking stronger than before, and a breakout could lead to a shift in market dynamics, driving Ethereum's outperformance.SOL ETH ratio today: Can Solana hit 0.075 and outperform ETH?
26 September 2024Current state: SOL/ETH continues to show strength, holding above the 2021 highs with price action respecting the 0.0533 dotted white line as support. Price has been trading sideways for some time but remains in a bullish structure. As we look toward the coming months, the potential for Solana to break higher against Ethereum is becoming increasingly apparent.
Key observations
- Support: The 0.0533 level has acted as a strong base, with prices repeatedly bouncing from this zone. The inclusion of the 20 EMA as an indicator highlights the consistency of higher lows, reinforcing the idea that Solana's bullish trend is well intact.
- Resistance: Price is primed to test upper resistance zones soon. Once it breaks above the current range, we anticipate SOL/ETH will move towards higher targets, driven by increased capital flow into Solana.

Disclaimer: This is not financial or investment advice. You are responsible for any capital-related decisions you make, and only you are accountable for the results.
Price Projection
- SOL/ETH ratio: Currently, the SOL/ETH ratio stands at approximately 0.057, near its previous all-time highs. We expect Solana to outperform Ethereum in the coming months, targeting a ratio of 0.075.
- ETH performance: Assuming ETH reaches $3,250 by Q4 2024 and SOL achieves a SOL/ETH ratio of 0.075, we estimate Solana's price to be around $244 per SOL.
Conclusion
SOL/ETH remains in a strong upward consolidation phase, with the potential to break higher in the coming months. The chart indicates a clear trend of higher lows, and as Solana gains more market share, it is well-positioned to outperform Ethereum. A breakout would likely lead to SOL reaching the projected price range of $244 - $256 per SOL.Ethereum price prediction & trading strategy: Key levels to watch
25 September 2024Market context
We're currently holding a long-term Ethereum position, which has developed into a winning trade. It's a daily trend rather than an intraday move, which presents multiple opportunities to scale in and adjust our risk management accordingly. We’re looking at risk-free zones and areas of strength as the price action continues to unfold.Disclaimer: This is not financial or investment advice. You are responsible for any capital-related decisions you make, and only you are accountable for the results.
Current trade position
We’re riding this uptrend with a clear swing high and lower high, followed by a breakout. It's critical to manage this trade effectively by reducing risk when possible. I tend to go risk-free as soon as possible, but the timing is essential—you don't want to do it too early and get shaken out of the position. Let’s break down why this matters.We’re approaching a major resistance level at $2,700. Historically, this price point has seen a lot of selling pressure, dating back to key resistance in January and August. Buyers push prices up, but if they hit exhaustion or shorts enter, it creates resistance. That’s exactly what we're facing now.
If Ethereum breaks above $2,700, we’ll shift our bias more bullishly, as that means sellers have been beaten. This could signal the start of stronger buying pressure at that level. Once we have a clean break with a retest and consolidation above this point, we can move our stop loss to break even, locking in the trade’s gains.
 Playbook
- Key level: $2,700 is the critical checkpoint. A clean break and retest here signal that sellers have stepped aside.
- Risk-free approach: Upon breaking $2,700 with conviction (multiple daily closes above), move the stop loss to entry to go risk-free.
- Next target: If we see daily closes above this level, we can aim for $2,900, potentially adding to the position.
Risk management
Don’t move your stop-loss to break even prematurely. Sellers are still strong at $2,700, so moving your stop right now could cause you to get stopped out unnecessarily. Once we see buyers take control, then it’s safe to reduce risk. Until then, maintain conviction in this trade.Is $2,875 the next stop for Ethereum?
24 September 2024- ETH's Open Interest continues to grind higher, whilst Funding remains relatively positive, indicating that there is a slight bias amongst traders to be Long.
Disclaimer: This is not financial or investment advice. You are responsible for any capital-related decisions you make, and only you are accountable for the results.
ETH open interest:
Continues the grind higher. 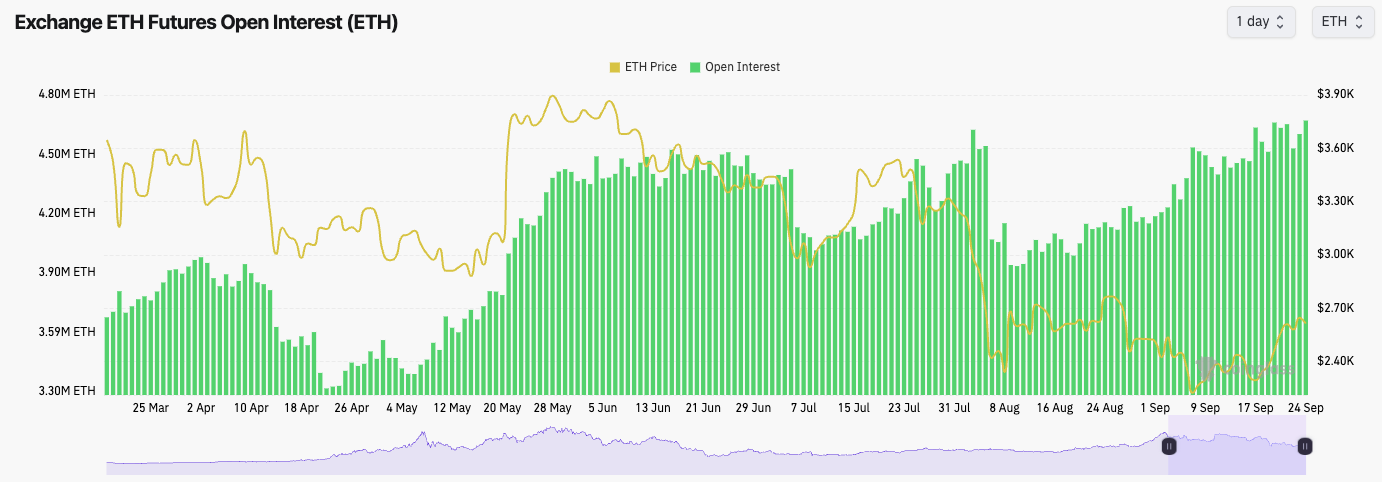
Technical analysis
- We thought that price might not have enough strength to get beyond the local resistance of $2,557, but price was able to get a clean break above - positive.
- We're now looking for a price to pull back slightly and use the $2,557 horizontal level as new support. If there is a price deviation below, this is fine, assuming it's quickly recovered.
- ETH is still in a longer term downtrend beyond this local move. A breakout of the downtrend line (red line) and the horizontal resistance of $2,875 would likely bring the full bull reversal. This may take more weeks.
- On the downside, the major support remains at the $2,150 level.
- The RSI is at 56, so it is middle territory. We don't take much of a signal from this here.
- On the 3D RSI, we have had a clean breakout of the downtrend line, so this should be positive for price going in to the next few weeks.
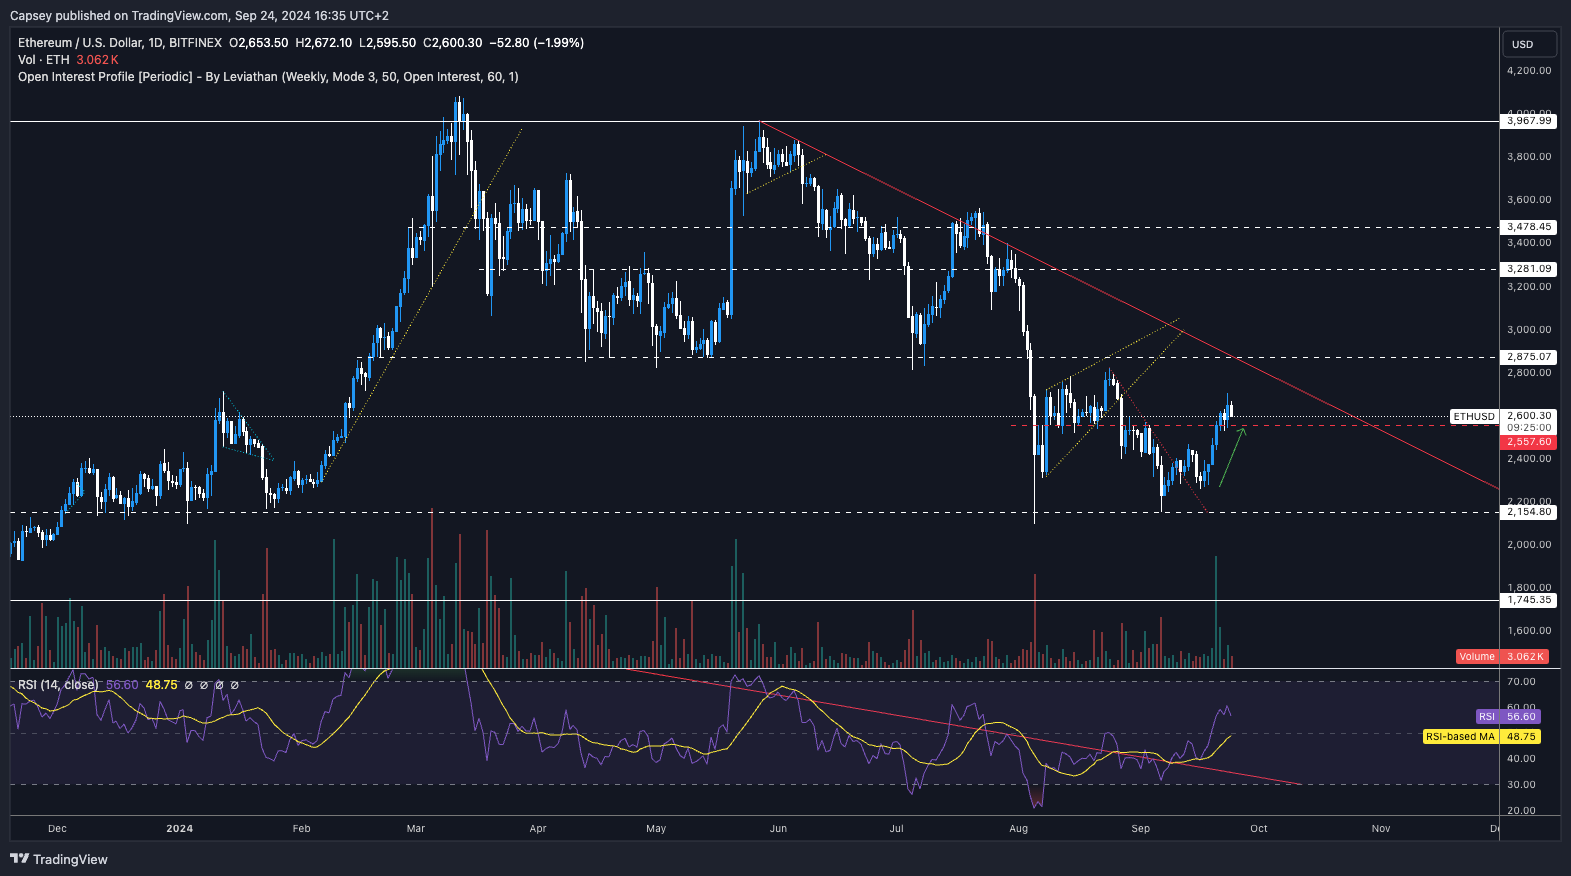
Cryptonary's take
Like Bitcoin, ETH probably needs a 3-5 day period where price pulls back a tad and consolidates, as this might then fuel a healthy, next leg higher. We're looking for ETH to hold above $2,557, but if the price does fall below, we'd be looking for a quick recovery. If there is no quick recovery upon the price falling below, that would concern us in the short term. We're looking for ETH to consolidate here over the coming days and use the $2,557 horizontal level as a support base to move higher over the coming 1-2 weeks, with the price eventually being able to break out of the main downtrend line and retest the major horizontal resistance at $2,875.What is Ethereum: Ethereum (ETH) is a groundbreaking decentralized platform that facilitates the creation and execution of smart contracts and decentralized applications (dApps) without the need for intermediaries. Launched by Vitalik Buterin in 2015, Ethereum's innovative blockchain technology enables a wide range of applications and has become a cornerstone of the decentralized finance (DeFi) space.
Ethereum's ATH is $4,868.
How to buy ETH:
- Via Centralized Exchange (CEX):
- Select a CEX like Binance, Coinbase, or Kraken.
- Sign up and complete any verification processes.
- Deposit funds into your account.
- Go to the ETH trading section and purchase ETH.
Will ETH consolidate below $2,557?
20 September 2024- ETH's Open Interest has been in a relatively steep uptrend, with Funding Rates positive over the last few days, indicating that the leverage that has gone on is long.
- This is a potential setup for a small flush to the downside, again wiping out late Longs, although the price could likely rebound following a small flush out.
Disclaimer: This is not financial or investment advice. You are responsible for any capital-related decisions you make, and only you are accountable for the results.
ETH Open Interest:
Note: ETH's OI is gradually increasing.
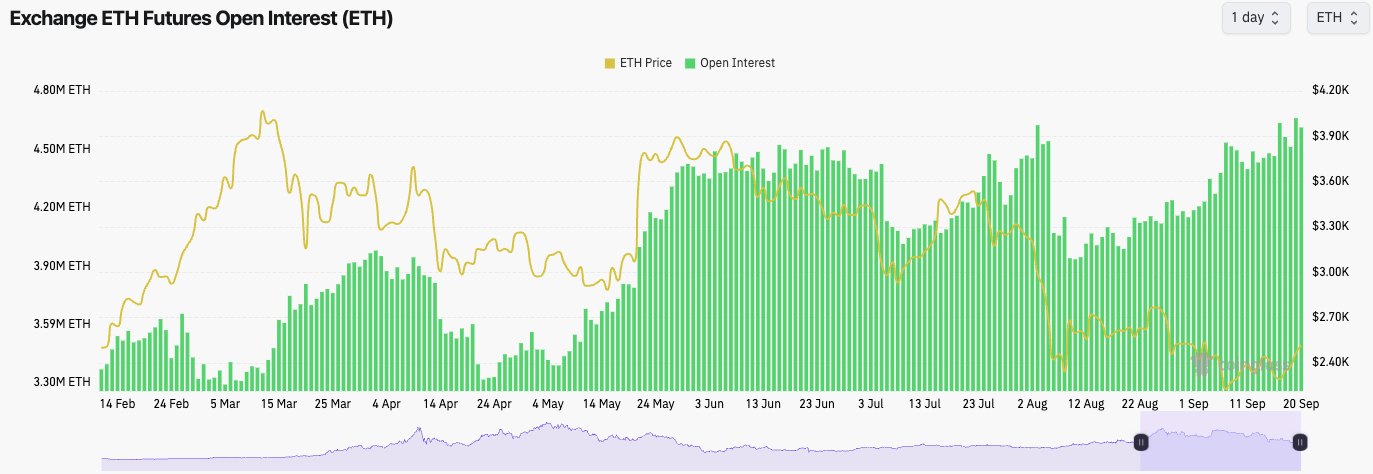
Technical analysis
- For ETH, our focus has been on the 3D timeframe/chart, so for now, that's where we'll stay.
- ETH has found support on the horizontal support of $2,150 and has been able to bounce from there.
- Price is now retesting the underside of the local horizontal resistance of $2,557. We think this can be a short-term stopping zone for ETH.
- It's possible that a short-term retest of $2,450 is on the cards first before ETH can break out above $2,557 and potentially then head up to $2,800.
- The RSI on the 3D chart is really clean, showing a breakout of the downtrend that has been the trend since March.
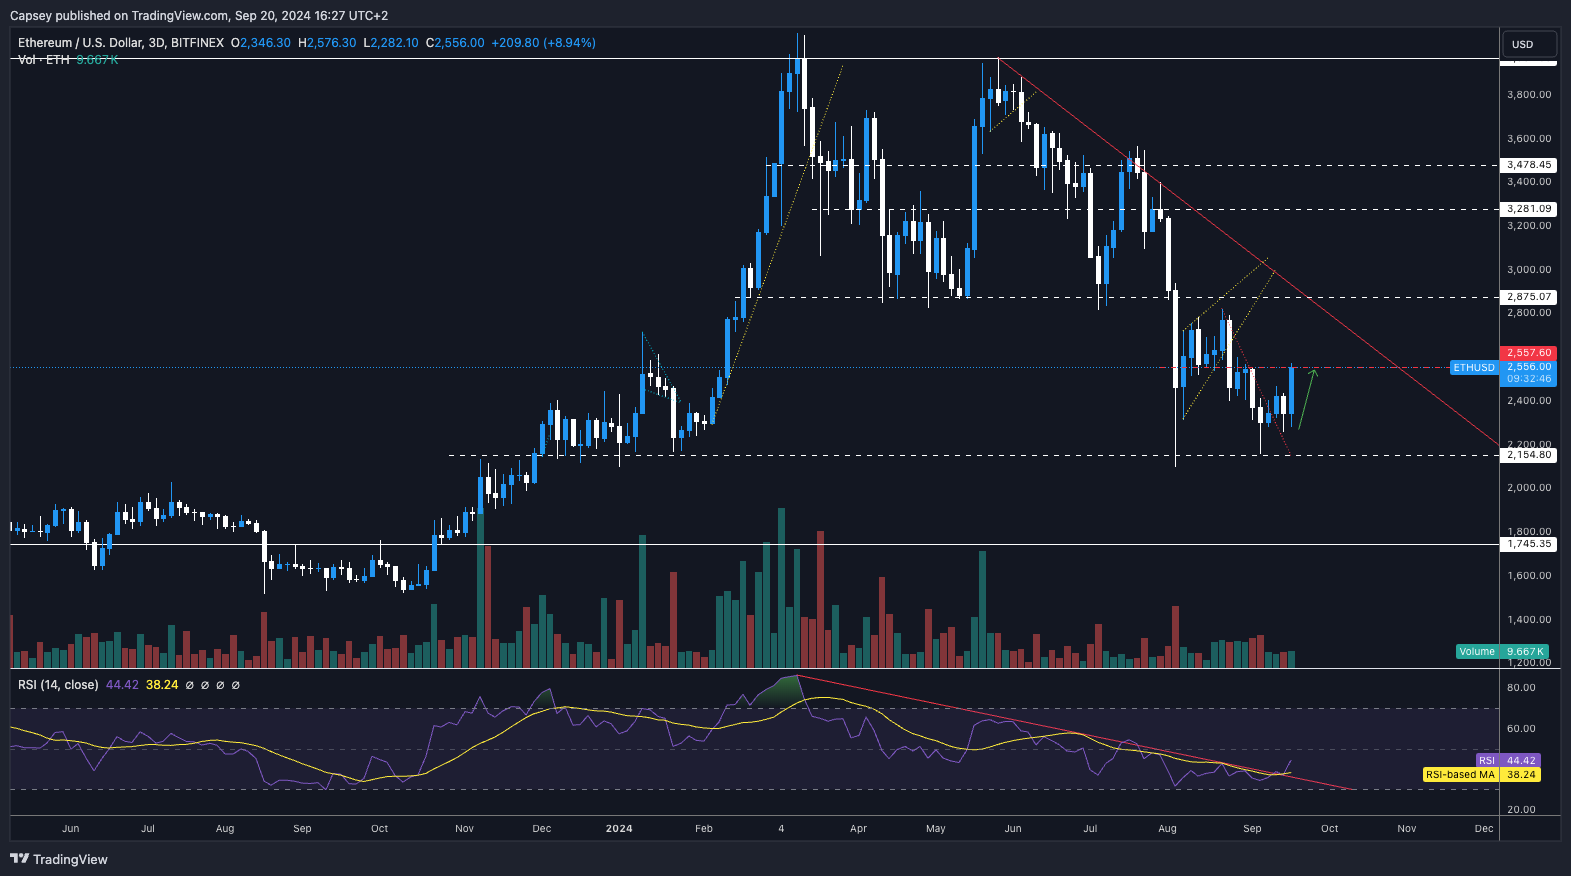
Cryptonary's take
ETH has lacked momentum and it may therefore take more days to consolidate under $2,557 before it breaks above it. But, that's our expectation for ETH to break back above $2,557 and possibly push up to $2,800 in the upcoming weeks. In the immediate term (next 2-4 days), it's possible ETH will remain between $2,400 and $2,550 - consolidate below the local horizontal resistance of $2,557.What is Ethereum: Ethereum (ETH) is a groundbreaking decentralized platform that facilitates the creation and execution of smart contracts and decentralized applications (dApps) without the need for intermediaries. Launched by Vitalik Buterin in 2015, Ethereum's innovative blockchain technology enables a wide range of applications and has become a cornerstone of the decentralized finance (DeFi) space. Ethereum's ATH is $4,868.
How to buy ETH:
- Via Centralized Exchange (CEX):
- Select a CEX like Binance, Coinbase, or Kraken.
- Sign up and complete any verification processes.
- Deposit funds into your account.
- Go to the ETH trading section and purchase ETH.
Will ETH rally from $2,150 support?
16 September 2024- ETH's Funding Rate has turn negative in the last 16 hours whilst Open Interest has substantially increased.
- This indicates that more traders are Shorting ETH here, and they may become vulnerable to a Short-squeeze, especially if bid returns to ETH here.
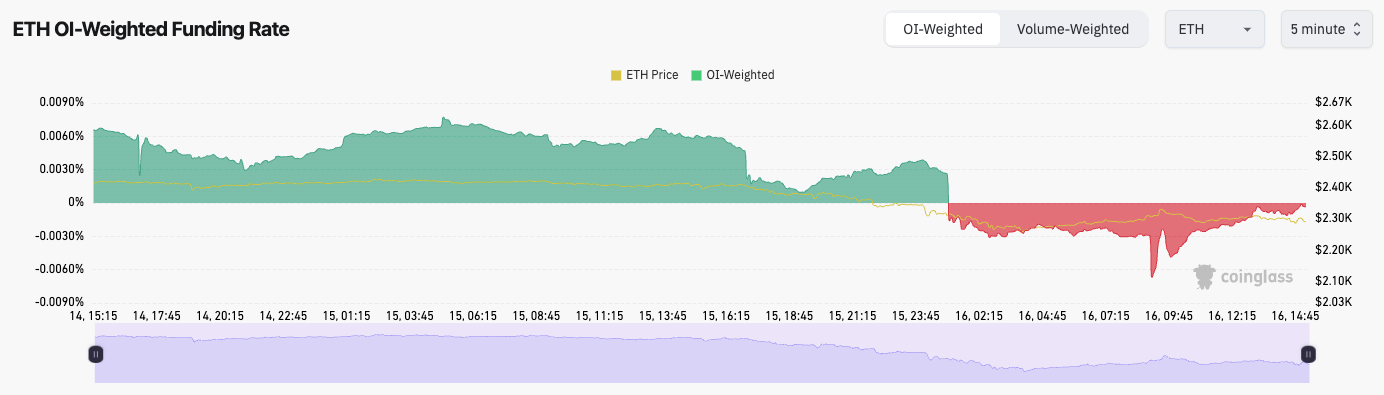
- For ETH, we're using a more zoomed out chart to highlight the significance of the $2,150 horizontal support. We're viewing ETH on the 3D chart.
- If ETH were to lose the $2,150 horizontal support, this would likely open the door to a swift move down to $1,745. We're not expecting this level to be lost though, at least for now.
- ETH has broken out of it's local downtrend line, but so far price wasn't able to retest the underside of the local resistance at $2,557, which we initially thought would be very achievable.
- One positive is that the 3D RSI is close to breaking a downtrend that has been in place since the price cycle high in March, and close to oversold territory, indicating a bounce could be on the cards soon even if it takes more time to play out.
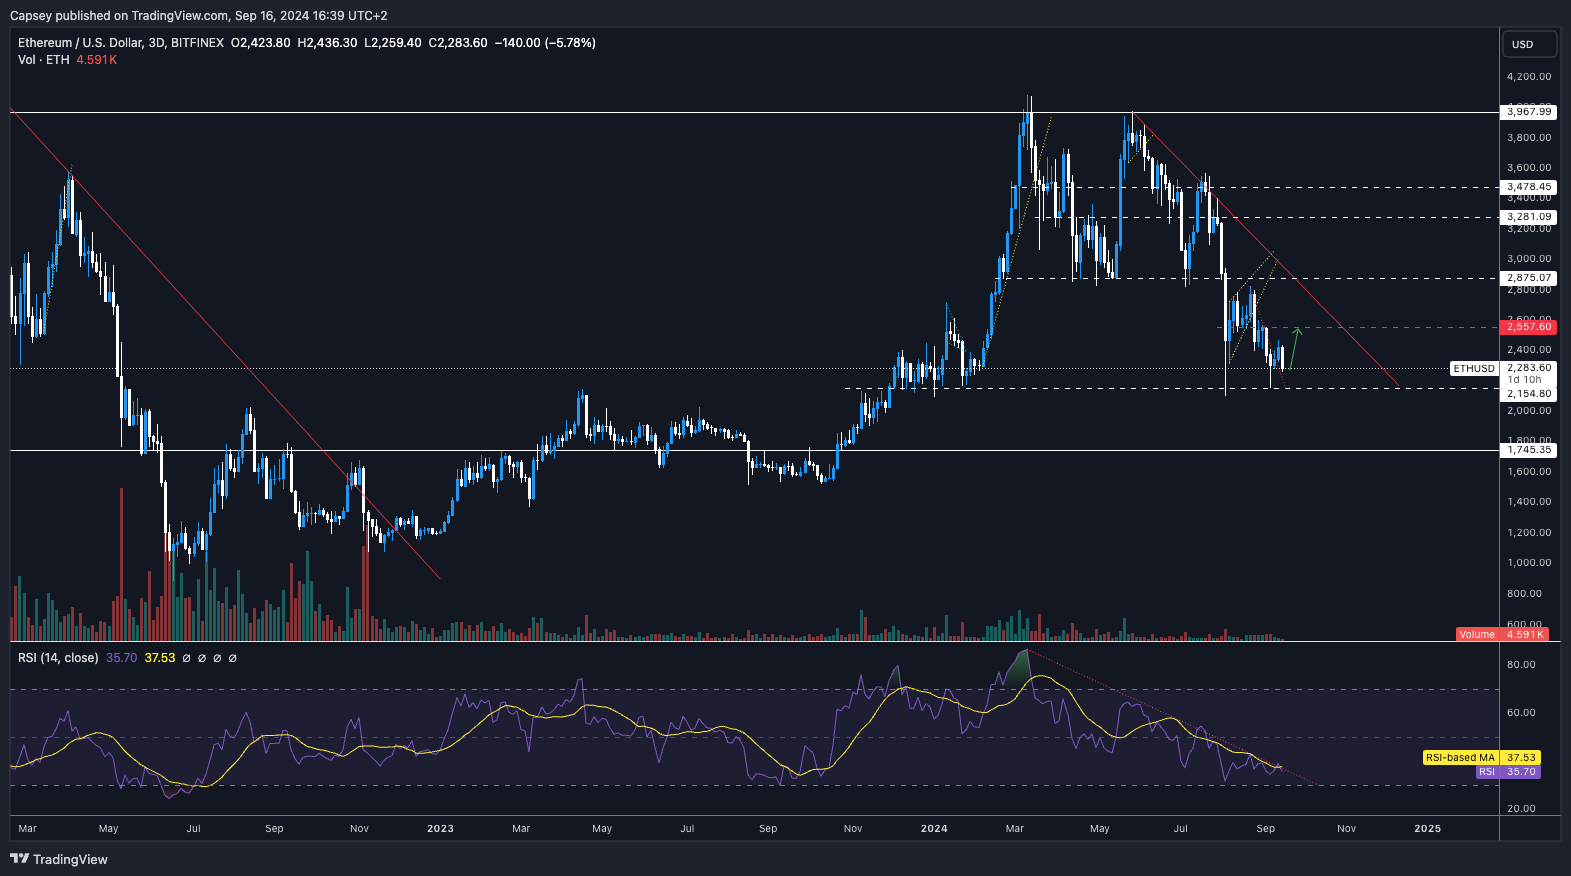
Cryptonary's take
Hard to call ETH here. The current structure has points that suggest price could currently be close to a mid-cycle low, however, we have seen weakness for a long while now, where ETH has struggled to put in any meaningful bounces. Whilst we believe the $2,150 horizontal support can hold, we do have to be open to the idea that ETH could see $1,745 again.But our expectation is that $2,150 holds and that this can be a local bottom for ETH before we head in to Q4. We are expecting a more positive week this week as we're expecting J Powell to be dovish for markets. If this is the case, then this might be the catalyst needed for ETH to retest $2,557.
Disclaimer: This is not financial or investment advice. You are responsible for any capital-related decisions you make, and only you are accountable for the results.
What is Ethereum: Ethereum (ETH) is a groundbreaking decentralized platform that facilitates the creation and execution of smart contracts and decentralized applications (dApps) without the need for intermediaries. Launched by Vitalik Buterin in 2015, Ethereum's innovative blockchain technology enables a wide range of applications and has become a cornerstone of the decentralized finance (DeFi) space. Ethereum's ATH is $4,868. How to buy ETH:
- Via Centralized Exchange (CEX):
- Select a CEX like Binance, Coinbase, or Kraken.
- Sign up and complete any verification processes.
- Deposit funds into your account.
- Go to the ETH trading section and purchase ETH.
Is ETH heading for $2,550 or testing $2,150?
11 September 2024- ETH's Open Interest has remained relatively flat, suggesting that traders aren't looking to aggressively trade ETH here.
- ETH's Funding Rate flip-flops between slightly positive and slightly negative, indicating indecision amongst traders.
- Overall, this is a healthier setup. ETH's Funding Rate is less negative than BTC's, and Open Interest hasn't ramped up. From a mechanics perspective, ETH is arguably an attractive Long at these prices, while the leverage market has seen a major flushing out.
Disclaimer: This is not financial or investment advice. You are responsible for any capital-related decisions you make, and only you are accountable for the results.
ETH's funding rate:
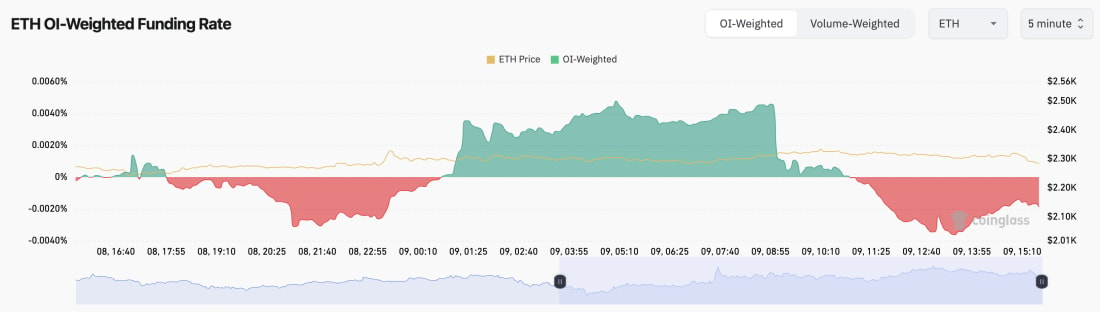
Technical analysis
- ETH has also fallen below its grey support box (between $2,330 and $2,470).
- ETH did find support at our major horizontal support line of $2,150, though.
- ETH has also put in a bullish divergence (lower low in price and higher low on the oscillator), with the higher low being put in just above oversold territory.
- If ETH can break out from its local downtrend line, it's possible ETH could retest the $2,550 local horizontal resistance.
- Beyond $2,550, the major horizontal resistance is at $2,875.
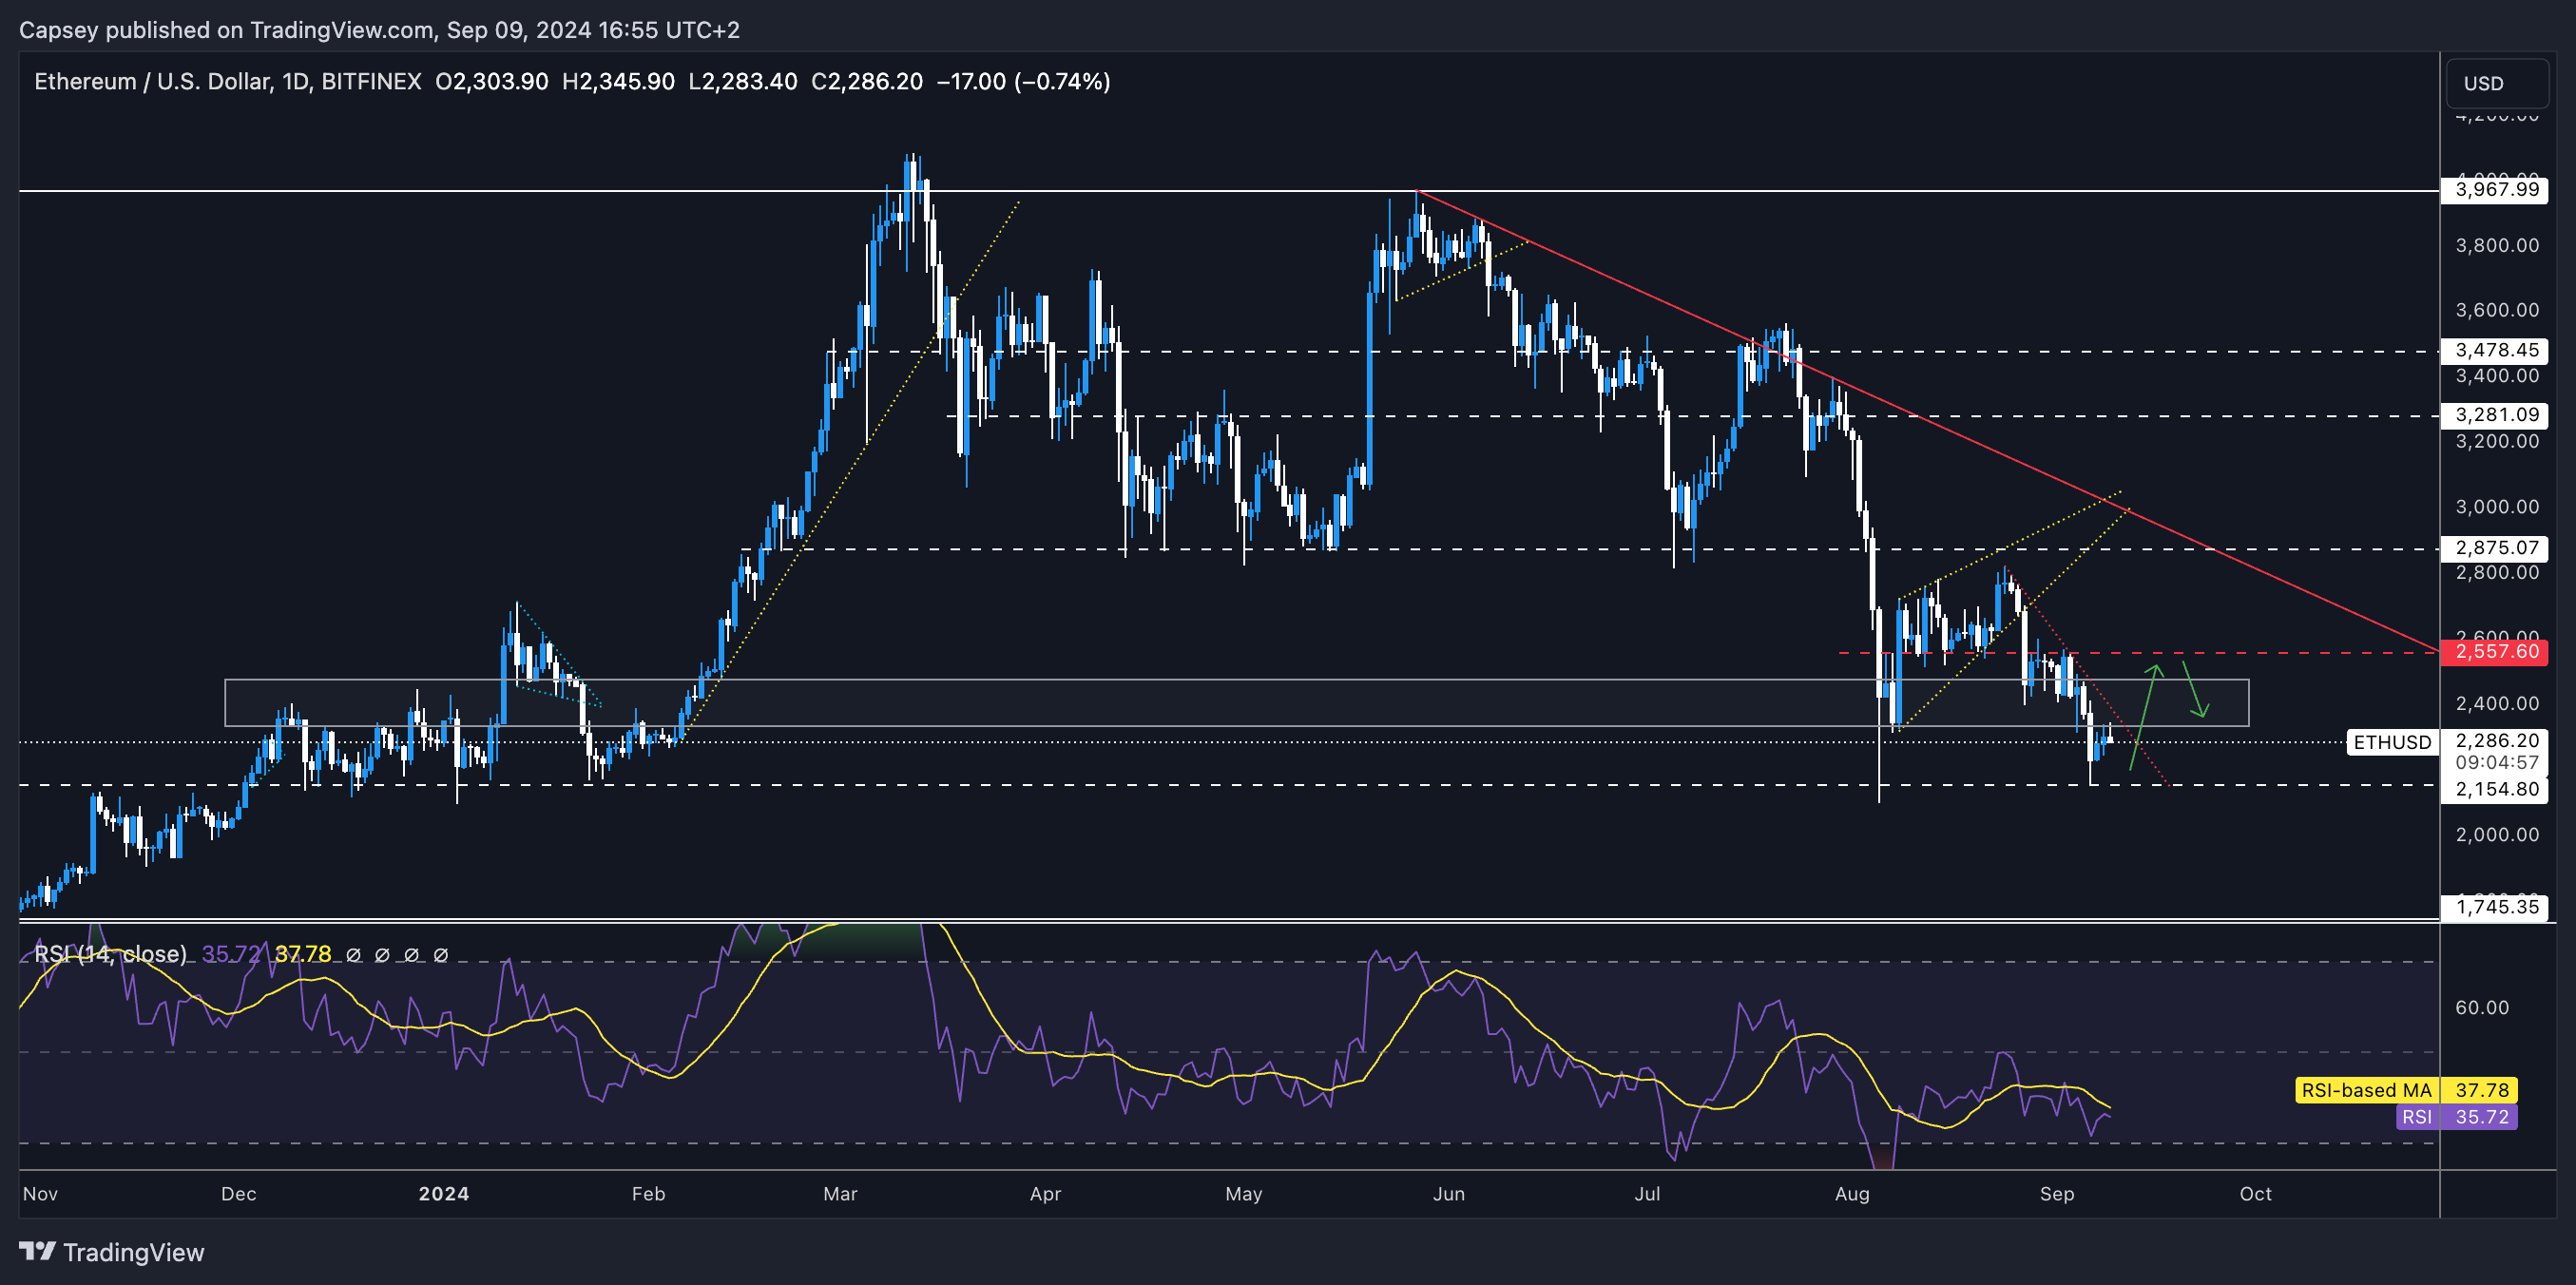
Cryptonary's take
Despite the fact we're still relatively wary of the market over the coming weeks, ETH looks as if it's either at or close to a bottom here. ETH has been down just shy of 50% from its highs this cycle, whilst we've also seen a major resetting in the leverage market. Price is currently sitting on top of a major support zone between $1,900 and $2,150. If ETH does revisit this area, this is likely a good price to bid with a 12-month view.Is ETH heading for $2,550 or testing $2,150?
09 September 2024- ETH's Open Interest has remained relatively flat, suggesting that traders aren't looking to aggressively trade ETH here.
- ETH's Funding Rate flip-flops between slightly positive and slightly negative, indicating indecision amongst traders.
- Overall, this is a healthier setup. ETH's Funding Rate is less negative than BTC's whilst Open Interest hasn't ramped up. From a mechanics perspective, ETH is arguably an attractive Long at these prices whilst the leverage market has seen a major flushing out.
Technical analysis:
- ETH has also fallen below it's grey support box (between $2,330 and $2,470).
- ETH did find support at our major horizontal support line of $2,150 though.
- ETH has also put in a bullish divergence (lower low in price and higher low on the oscillator), with the higher low being put in just above oversold territory.
- If ETH can break out from it's local downtrend line, it's possible ETH could retest the $2,550 local horizontal resistance.
- Beyond $2,550, the major horizontal resistance is at $2,875.
Disclaimer: This is not financial or investment advice. You are responsible for any capital-related decisions you make, and only you are accountable for the results.
Cryptonary's take
Despite the fact we're still relatively wary of the market over the coming weeks, ETH looks as if it's either at or close to a bottom here. ETH has been down just shy of 50% from it's highs this cycle, whilst we've also seen a major resetting in the leverage market. Price is currently sitting on top of a major support zone between $1,900 and $2,150. If ETH does revisit this area, this is likely a good price to bid with a 12 month view.
What is Ethereum: Ethereum (ETH) is a groundbreaking decentralized platform that facilitates the creation and execution of smart contracts and decentralized applications (dApps) without the need for intermediaries. Launched by Vitalik Buterin in 2015, Ethereum's innovative blockchain technology enables a wide range of applications and has become a cornerstone of the decentralized finance (DeFi) space. Ethereum's ATH is $4,868.
How to buy ETH:
- Via Centralized Exchange (CEX):
- Select a CEX like Binance, Coinbase, or Kraken.
- Sign up and complete any verification processes.
- Deposit funds into your account.
- Go to the ETH trading section and purchase ETH.
Is a bullish reversal coming?
04 September 2024- ETH’s Funding Rate is positive and meaningfully positive, so there isn’t the short interest built up in ETH like in BTC.
- ETH’s Open Interest has increased over the last few days, and with ETH’s Funding Rate going from negative to meaningfully positive, that suggests that longs have gone on here and in a relatively healthy manner.
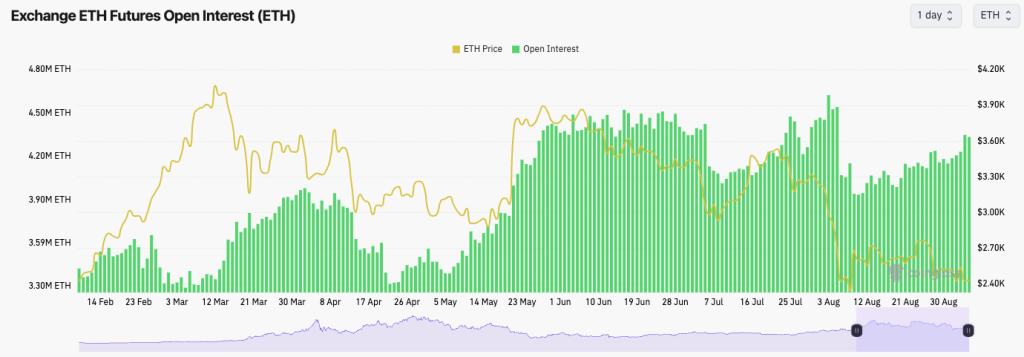
Disclaimer: This is not financial or investment advice. You are responsible for any capital-related decisions you make, and only you are accountable for the results.
Technical analysis
- ETH has found strong support in the support box we outlined so far; however, for price to see a bullish reversal, it will need to reclaim above $2,557.
- Beyond $2,557, the next major horizontal resistance is at $2,875, although we don’t see ETH reclaiming this in the immediate term.
- To the downside, we’d expect the grey box to continue holding as local support. However, the major horizontal support is at $2,150.
- The RSI is not in oversold territory, but it’s at 39, which is low, so there is room to bounce here.
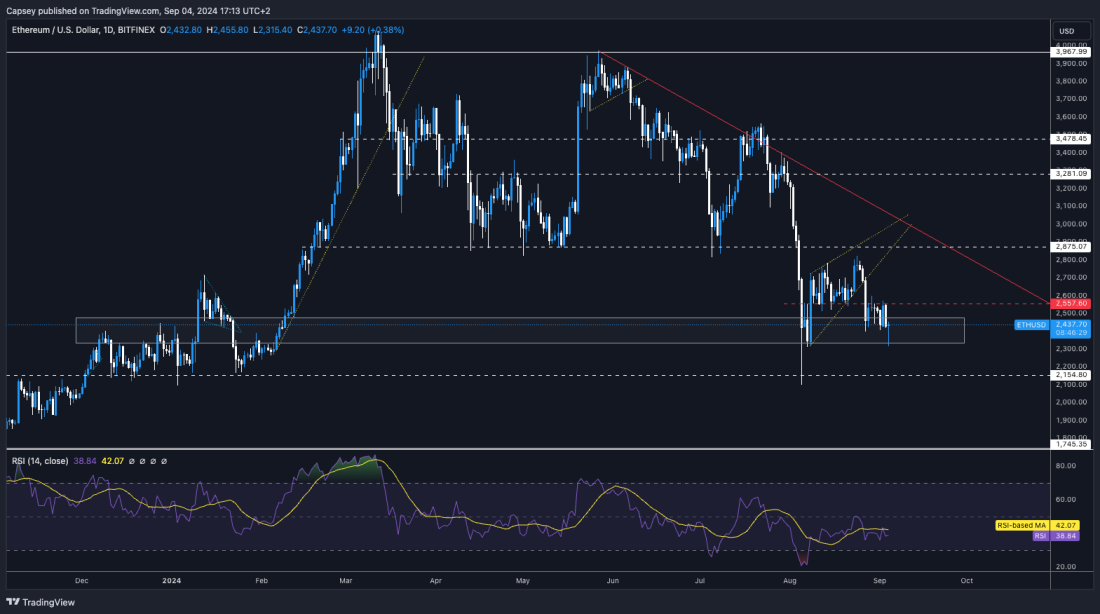
Cryptonary’s take
In terms of the majors, ETH looks the most attractive for a higher trade. It has broken down from its higher range and then found support at an old range (between $2,150 and $2,400).We still like ETH for a bounce play here, potentially to as high as $2,875, although we don’t expect it immediately, and it might take a few weeks. But, overall, the setup is nice here, and ETH from a technical structure is attractive.
Alongside this, ETH has seen a flushing out in its leverage market, also making it an attractive trade from that perspective.
What is Ethereum: Ethereum (ETH) is a groundbreaking decentralized platform that facilitates the creation and execution of smart contracts and decentralized applications (dApps) without the need for intermediaries. Launched by Vitalik Buterin in 2015, Ethereum's innovative blockchain technology enables a wide range of applications and has become a cornerstone of the decentralized finance (DeFi) space. Ethereum's ATH is $4,868.
How to buy ETH:
- Via Centralized Exchange (CEX):
- Select a CEX like Binance, Coinbase, or Kraken.
- Sign up and complete any verification processes.
- Deposit funds into your account.
- Go to the ETH trading section and purchase ETH.
Will Ethereum test $2,875 resistance soon?
29 August 2024- ETH's Open Interest remains much more subdued, meaning severe leverage flush-outs are much less likely to occur.
- ETH's Funding Rate is flat at 0.00%, once again showing that traders are undecided about whether to be Long or Short.
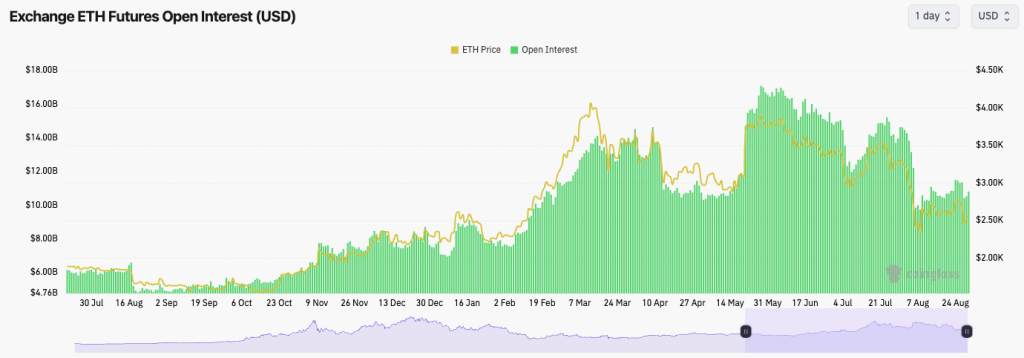
Technical analysis
- ETH broke down from its ascending wedge, which we perfectly predicted and called for in the last Market Direction.
- However, price did drop slightly further than we initially expected, testing $2,400.
- We have inserted another box of support between $2,330 and $2,470, and we expect the price to continue finding support in that range.
- Price is currently facing local resistance at $2,555. To reclaim this level and build support above it, price needs to see a retest of $2,800.
- The RSI is relatively low at 42, so there is plenty of room for price to move higher.
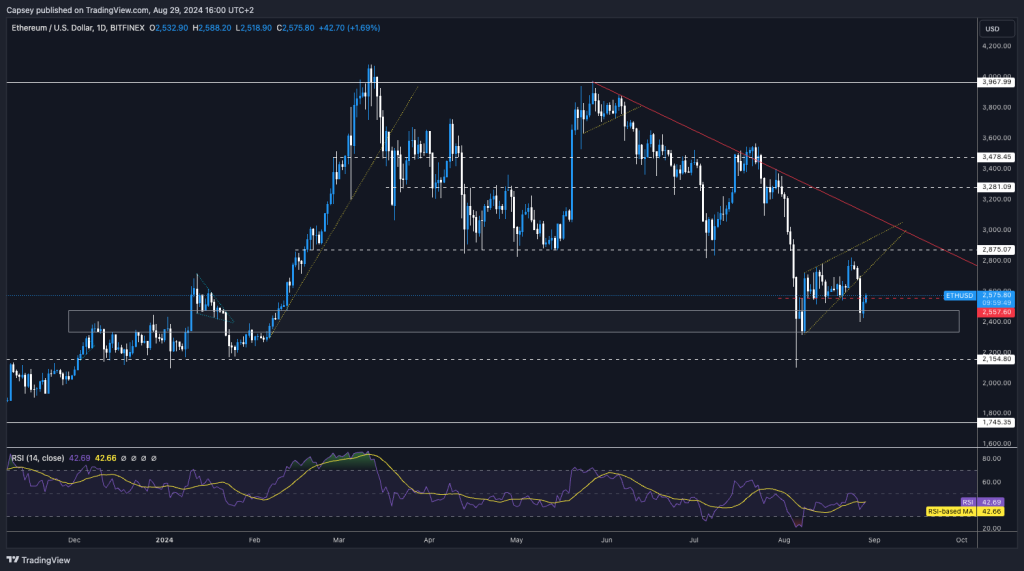
Disclaimer: This is not financial or investment advice. You are responsible for any capital-related decisions you make, and only you are accountable for the results.
Cryptonary's take
Generally speaking, we expect ETH to grind higher from here, even if it's sideways in the coming days. We would bid the grey box (between $2,330 and $2,470) with a view to holding this longer term. I am personally (Tom), in an ETH Long with an entry in the $2,500's. ETH may grind higher in September to test the $2,875 horizontal resistance and that main downtrend line. A breakout of these converging resistances would be bullish for ETH's price.SOL/ETH ratio today: Can Solana sustain this bullish trend?
27 August 2024Current state
The SOL/ETH chart is one of the most impressive upward-trending charts, both on lower and higher time frames. This chart perfectly illustrates what we at Cryptonary have been emphasising for a long time: Solana is set to outperform. The pair has once again reclaimed its 2021 all-time high (ATH) and is holding strong at this level.Key observations:
Support: The 2021 ATH has been reclaimed, and SOL/ETH is currently holding this level with strength. I've also included the 20 EMA in today's analysis, which serves as an excellent indicator for identifying higher lows in a strong bullish trend. We can see how beautifully 0.055 acted as a higher low, supported by the 20 EMA.Trend Confirmation: This support from the 20 EMA has been confirmed twice, as marked by the red circles on the chart. Each time, the price took solid support from the 20 EMA before moving higher, indicating that this trend is likely to continue.
Resistance: On the downside, 0.053 has now emerged as a new support level for SOL/ETH, while the 0.064 level (ATH) serves as the key resistance on the upside.
Market Dynamics: This chart strongly suggests that Solana is poised to outperform Ethereum in the coming months. The consistent strength and support from key levels highlight the bullish outlook for this pair.

Conclusion
SOL/ETH is displaying a textbook bullish trend, with strong support levels and a consistent upward trajectory. As Solana continues to outperform Ethereum, this pair remains one of the most promising indicators of Solana's potential dominance in the crypto market.ETH/BTC ratio today: Will it break the 0.0046 resistance?
27 August 2024Current state
ETH/BTC has been trading within a longstanding falling wedge on the weekly timeframe. The pair tested and liquidated zones below the lower end of the wedge around the 0.04 level, which has acted as significant support. However, ETH/BTC is yet to show clear signs of reversal from this point.Key observations:
Support: The price is heading back towards the grey support zone, indicating that ETH/BTC may continue to consolidate within this area before attempting a move higher.Resistance: Flipping above the 0.0046 level is crucial for ETH/BTC to get back into the weekly wedge and regain bullish momentum. This level serves as a key resistance that must be overcome for ETH to start moving higher.
Potential scenario: Until ETH/BTC flips the 0.0046 level and re-enters the wedge, the pair is likely to remain in a choppy range. However, once ETH/BTC begins to reverse, we can expect a good inflow of capital into ETH, which will likely be accompanied by a broader altcoin rally.
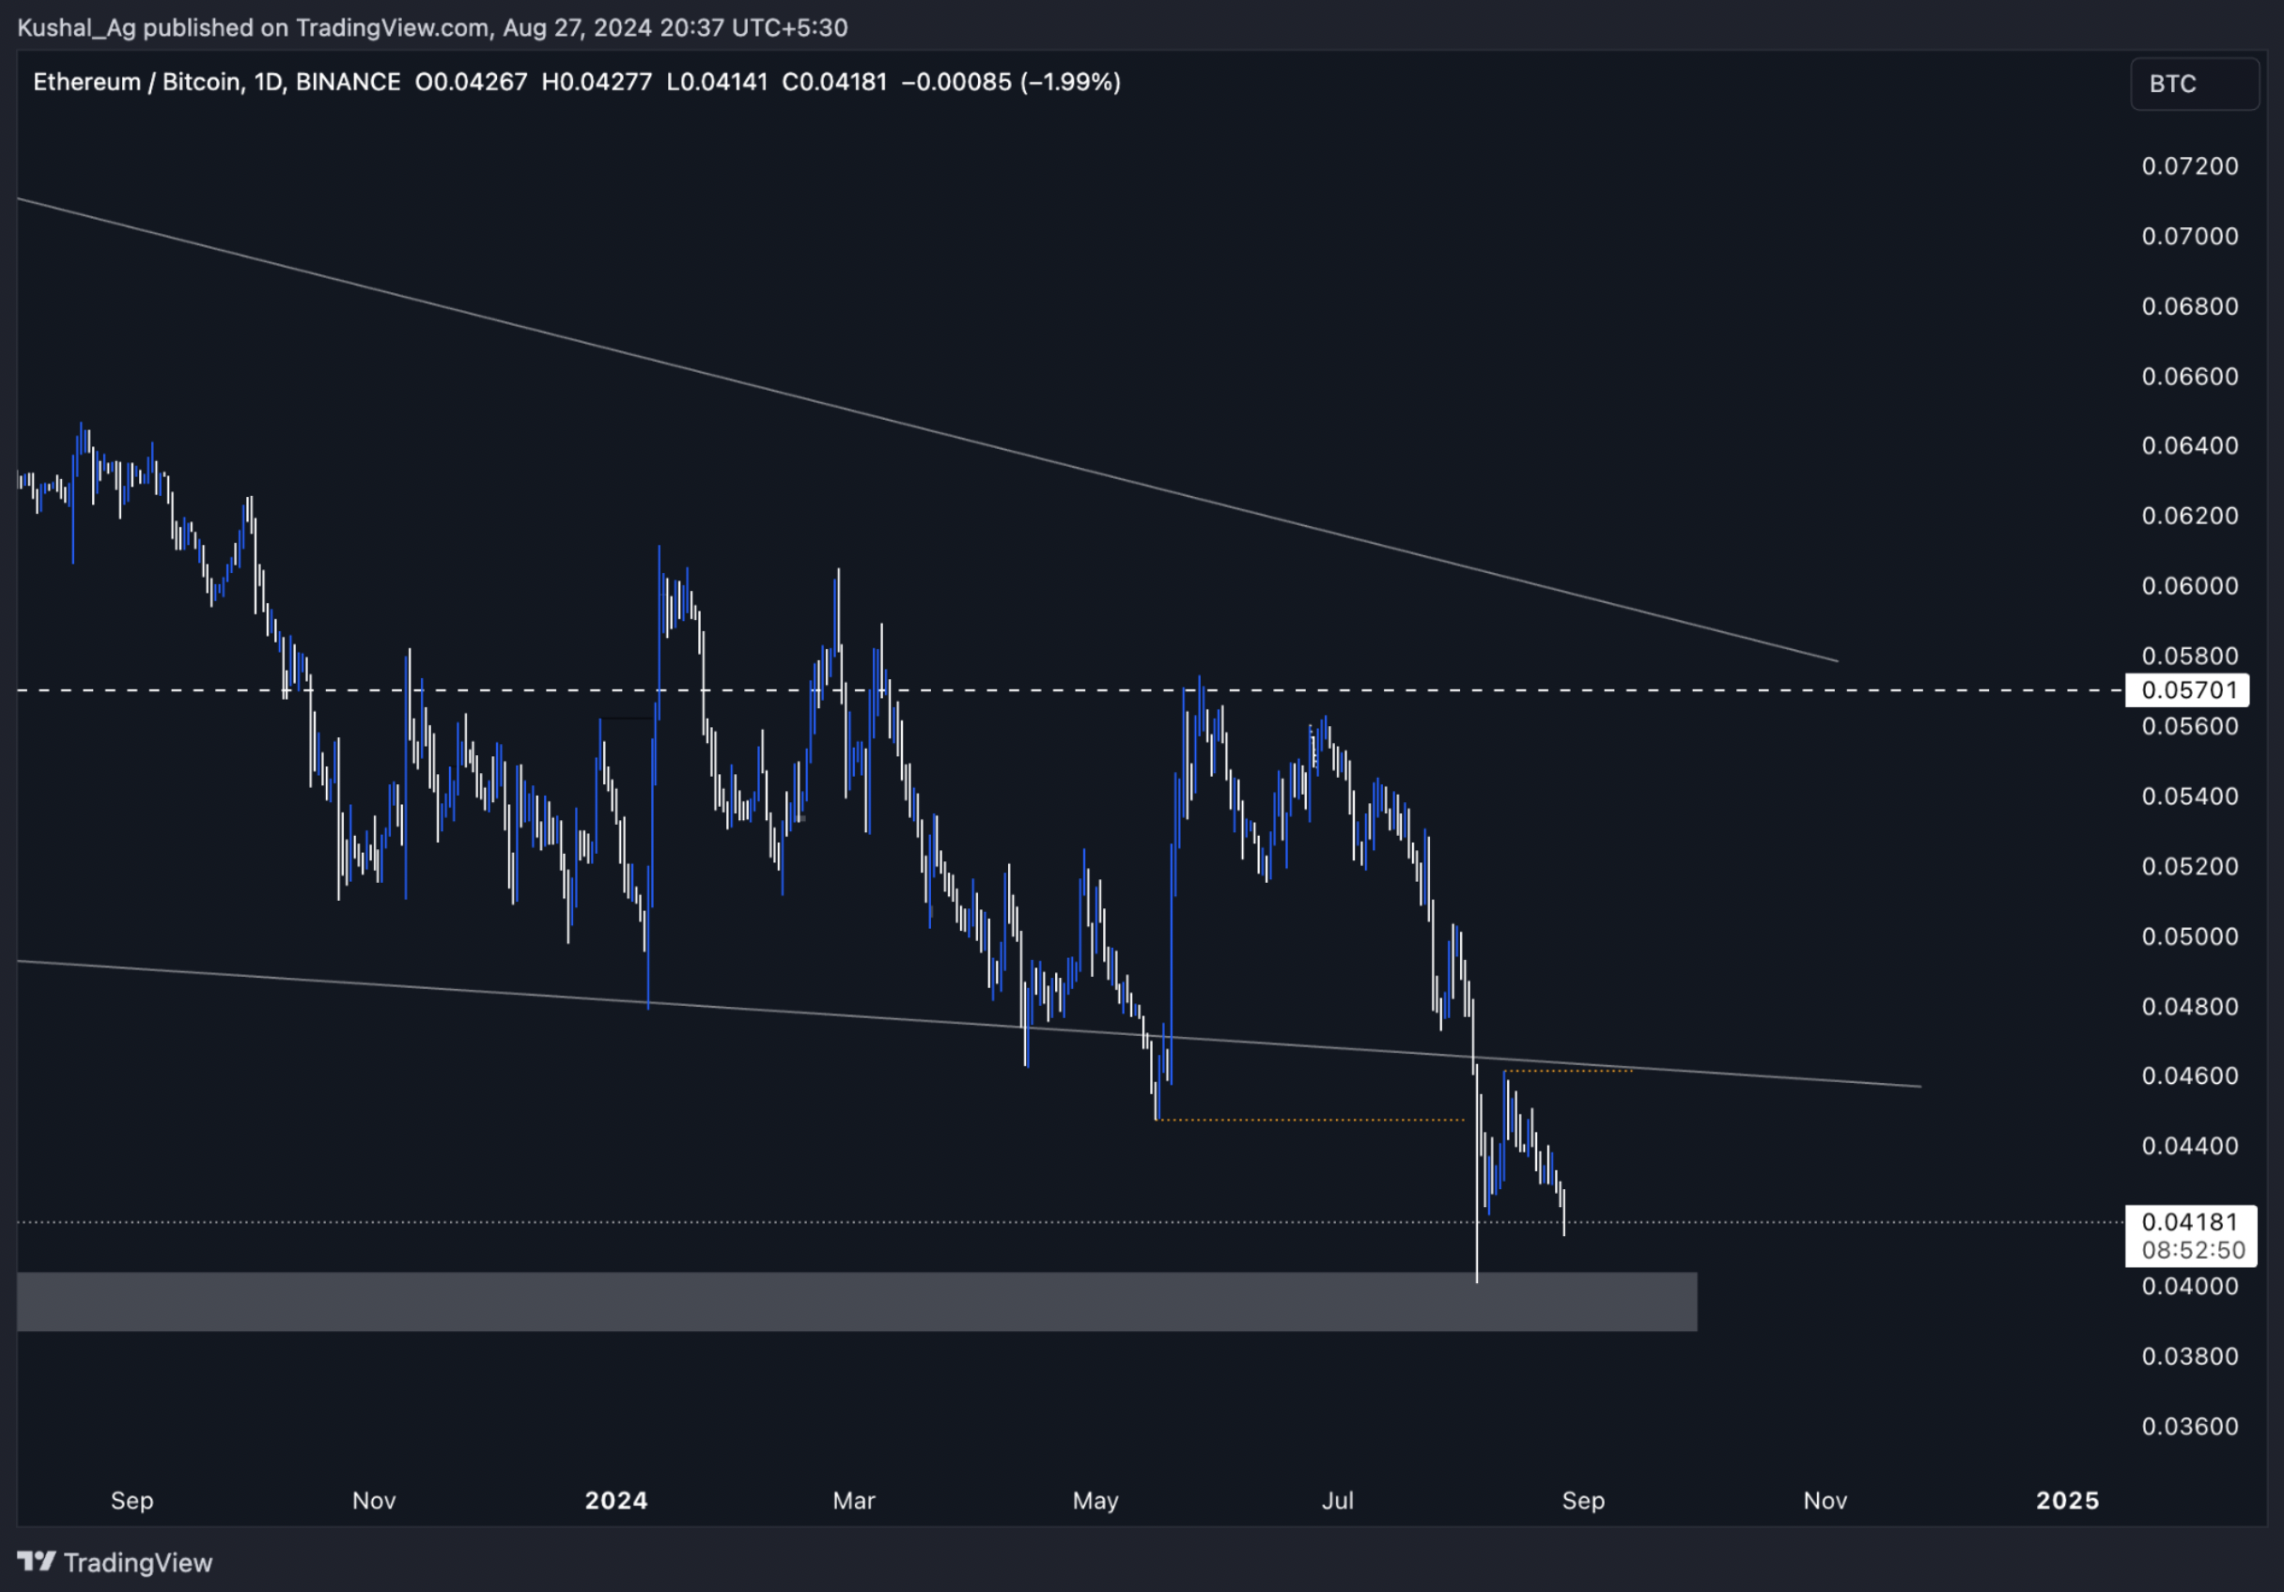
Conclusion
ETH/BTC remains in a critical consolidation phase, with the 0.0046 level acting as a pivotal resistance. A break above this level would signal the end of the current choppy price action and could lead to significant capital inflows into ETH, driving a broader altcoin market rally.Can ETH reach above $2,875 soon?
26 August 2024ETH's Open Interest has increased over the last few weeks but remains well below its highs in late May.
The Funding Rate is also relatively flat, suggesting that traders lack the conviction to take a meaningful position in betting on ETH.
This is a positive leverage setup, as excesses have been flushed out, and new leverage has yet to pile back on.
ETH Open Interest:
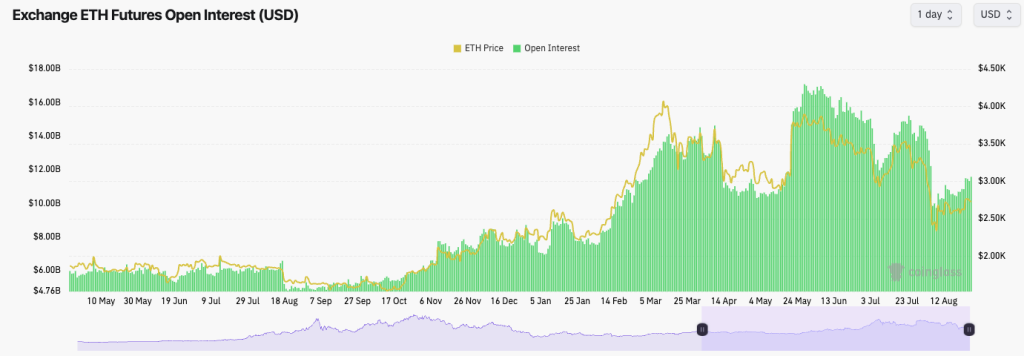
Technical analysis
- ETH is currently in an ascending triangle. These patterns tend to have a bias to break to the downside.
- If the ascending wedge breaks down, ETH has support between $2,540 and $2,640. We would expect this zone to act as support if the price retests lower.
- To the upside, there is a major horizontal resistance at $2,875. If ETH can reclaim above this level, we'd consider that very positive.
- The RSI is at 48, so ETH is not currently anywhere near being overbought.
- If ETH were to clear above $2,875, the next main resistance would be the main downtrend line (red line).
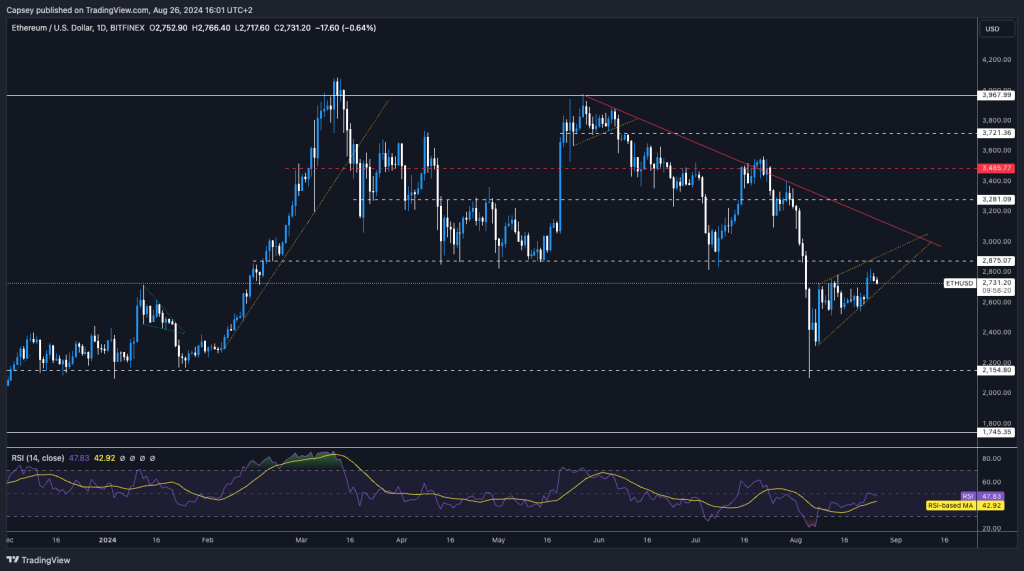
Cryptonary's take
If ETH were to dip back into the $2,400 to $2,600 range, I (Tom) personally would see that as an attractive area to add to Spot bags. We've seen that ETH can still run in this market; look back to February, when it ran from $2,300 to $4,000 in five weeks.In the immediate term, we think ETH can pull back very slightly and maybe retest between $2,500 and $2,600. A clean break above $2,875 would be a bullish signal for us.
Disclaimer: This is not financial or investment advice. You are responsible for any capital-related decisions you make, and only you are accountable for the results.
What is Ethereum: Ethereum (ETH) is a groundbreaking decentralized platform that facilitates the creation and execution of smart contracts and decentralized applications (dApps) without the need for intermediaries. Launched by Vitalik Buterin in 2015, Ethereum's innovative blockchain technology enables a wide range of applications and has become a cornerstone of the decentralized finance (DeFi) space. Ethereum's ATH is $4,868.
How to buy ETH:
- Via Centralized Exchange (CEX):
- Select a CEX like Binance, Coinbase, or Kraken.
- Sign up and complete any verification processes.
- Deposit funds into your account.
- Go to the ETH trading section and purchase ETH.
Is $2,875 the key to Q4 2024 breakout?
20 August 2024ETH's funding rate is similar to that of Bitcoin. It's ranged between slightly positive and negative for the last 10 days, indicating indecision amongst traders.
ETH's Open Interest has also remained more subdued following the flush out, indicating that traders are not rushing back to leverage Long or Short ETH here. This is a really healthy resetting in leverage, which is usually positive for prices going higher in the following weeks and months.
ETH's Open Interest:
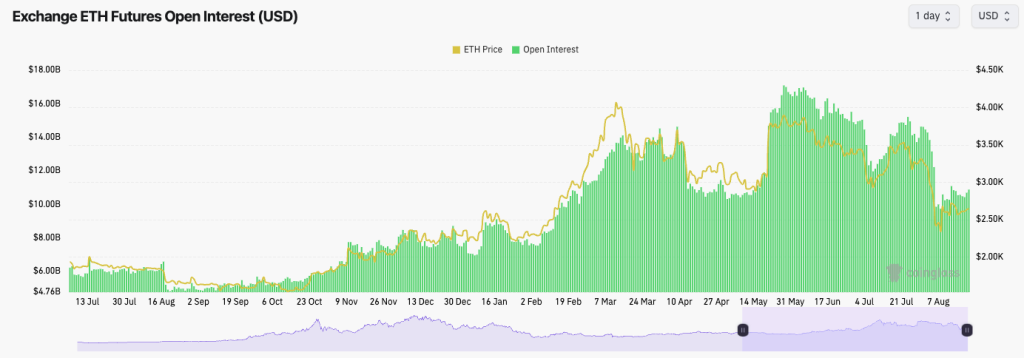
Technical analysis
- Like Bitcoin, ETH remains in the lower range between the major horizontal support of $2,150 and the horizontal resistance of $2,875.
- Locally, ETH is range-bound between $2,400 and $2,750. These are the levels to watch for a more material breakout.
- ETH is in an ascending wedge, which tends to have a bias to break out to the downside; however, this isn't a clean wedge in terms of its formation.
- A breakdown from the wedge would likely send ETH to $2,400 to $2,500, which we would see as a buying zone for ETH.
- The RSI is at 42, so it is middle territory, but there is more upside to be had.
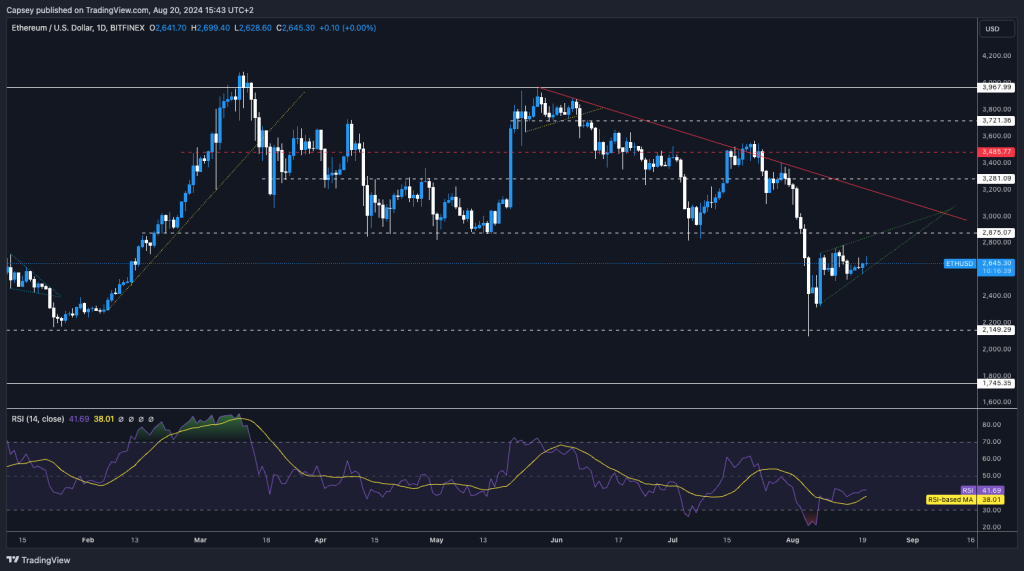
Cryptonary's take
We're expecting more range-bound price action in this tighter range over the coming week. Ultimately, we'd need to see ETH reclaim and clear comfortably back above $2,875 to get us excited. We're not expecting this to happen in the coming days, but as we move into September, we believe that level will be reclaimed. ETH can grind higher from there into Q4, where we expect ETH to test its all-time highs and likely break above them by year-end.Will it break $2.7k or drop to $2.4k?
16 August 2024- On most Exchanges, ETH's Funding Rate is more positive than BTC's, indicating a stronger bias amongst traders to be Long rather than Short. This is healthy after leverage resetting, which is what we saw last week.
- - Following ETH's Open Interest flush out, we haven't seen leverage pile back on which is a positive sign.
Disclaimer: This is not financial or investment advice. You are responsible for any capital-related decisions you make, and only you are accountable for the results.
ETH's Open Interest:
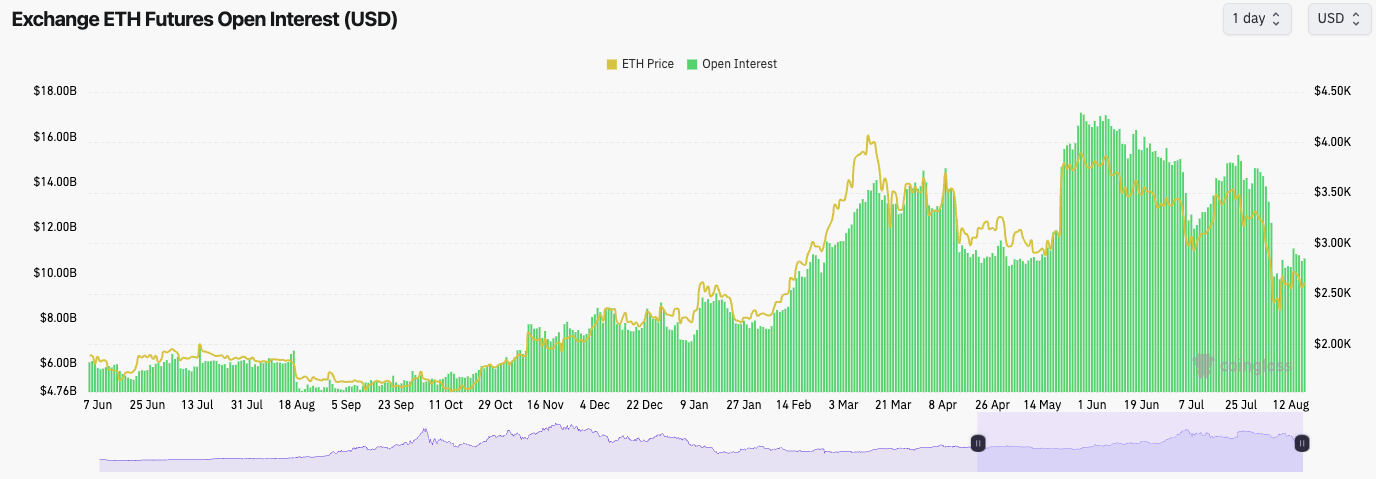
Technical analysis
- ETH bounced well from the major support of $2,150 but now remains in this lower price range between $2,300 and $2,700, with the price still not convincingly being able to progress up to the major horizontal level of $2,875.
- ETH didn't quite pull back to the red arrow level we had previously identified
- In terms of price formations, ETH currently looks like it's in an ascending wedge on the local timeframe. These have a bias to break down.
- If the ascending wedge were to break down, the target area would be $2,330 to $2,400. However, this would be an area that would strongly consider bidding ETH.
Cryptonary's take
We're expecting ETH to remain range-bound between $2,330 and $2,700 over the weekend and the first few days of next week.Whilst it's also possible ETH sees some downside in the coming weeks, we do believe any retest of the $2,150 to $2,400 area we would be strong buyers of ETH if we're given the opportunity at those price points. The target would be to sell at some point in 2025 at considerably higher prices.
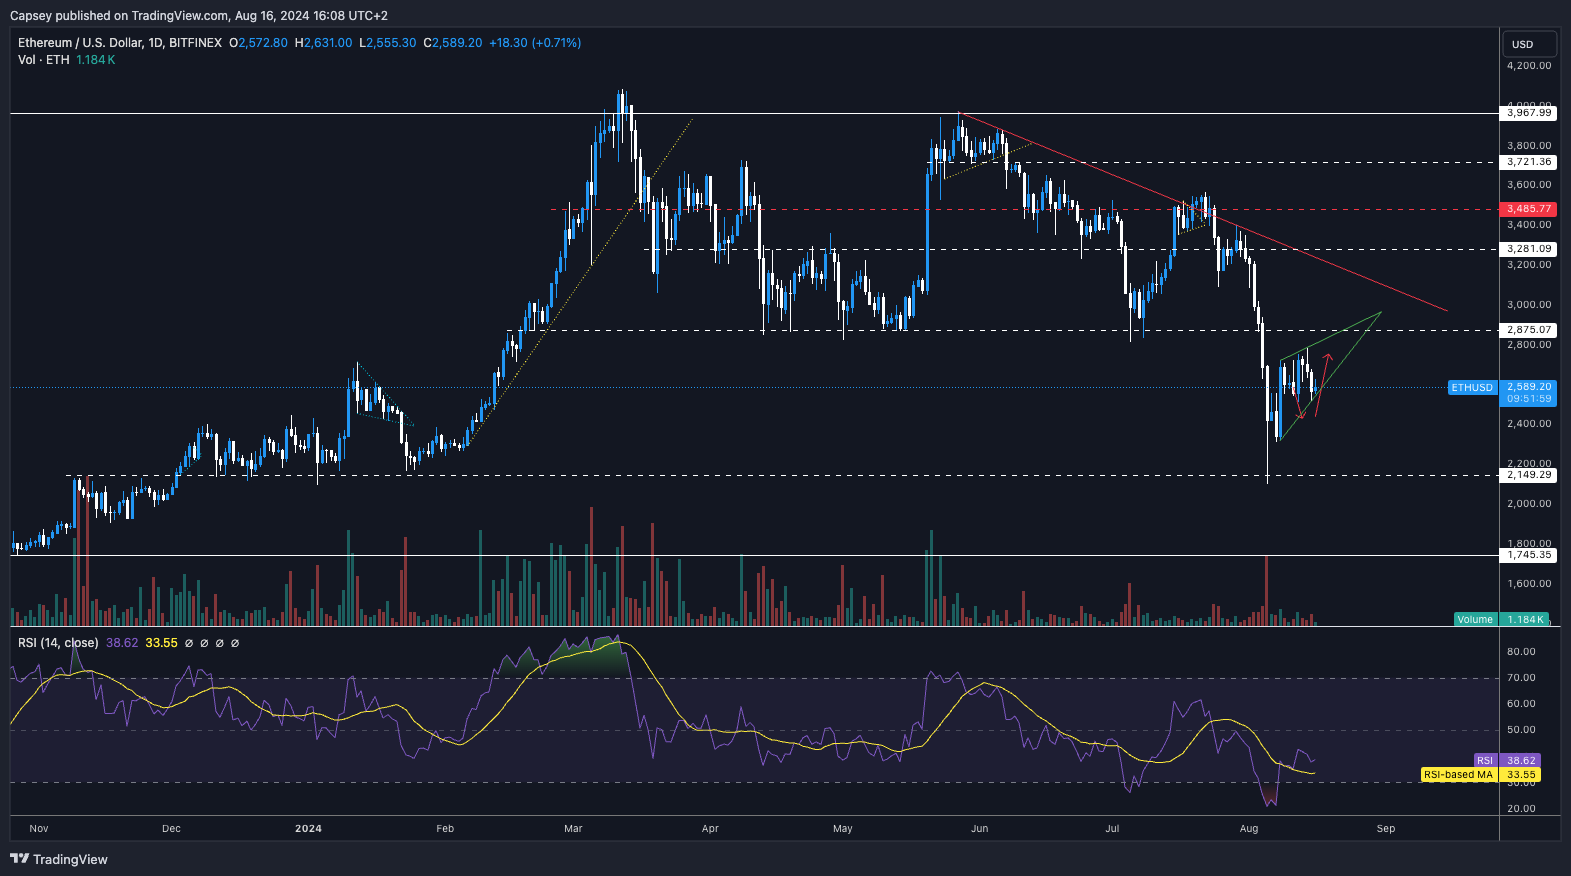
What is Ethereum: Ethereum (ETH) is a groundbreaking decentralized platform that facilitates the creation and execution of smart contracts and decentralized applications (dApps) without the need for intermediaries. Launched by Vitalik Buterin in 2015, Ethereum's innovative blockchain technology enables a wide range of applications and has become a cornerstone of the decentralized finance (DeFi) space. Ethereum's ATH is $4,868.
How to buy ETH:
- Via Centralized Exchange (CEX):
- Select a CEX like Binance, Coinbase, or Kraken.
- Sign up and complete any verification processes.
- Deposit funds into your account.
- Go to the ETH trading section and purchase ETH.
SOL ETH ratio today: Is the 0.058 resistance about to break?
14 August 2024SOL/ETH
Current state: SOL/ETH has recently broken past its all-time high (ATH) of 0.058, which it first established in 2021. The pair is currently facing short-term resistance around this level and is pulling back into the 0.055 region. This pullback appears to be a preparation for another leg up into price discovery.Key observations
- Support: The price has formed a solid and lengthy base around the 200 EMA, maintaining this range for over 200 days.
- Resistance: The 0.058 level, being the previous ATH, is currently acting as resistance.
- Potential scenario: A break above this new high in SOL/ETH would significantly push SOL closer to its 0.1 target, potentially reaching four digits if ETH hits the 10k mark.
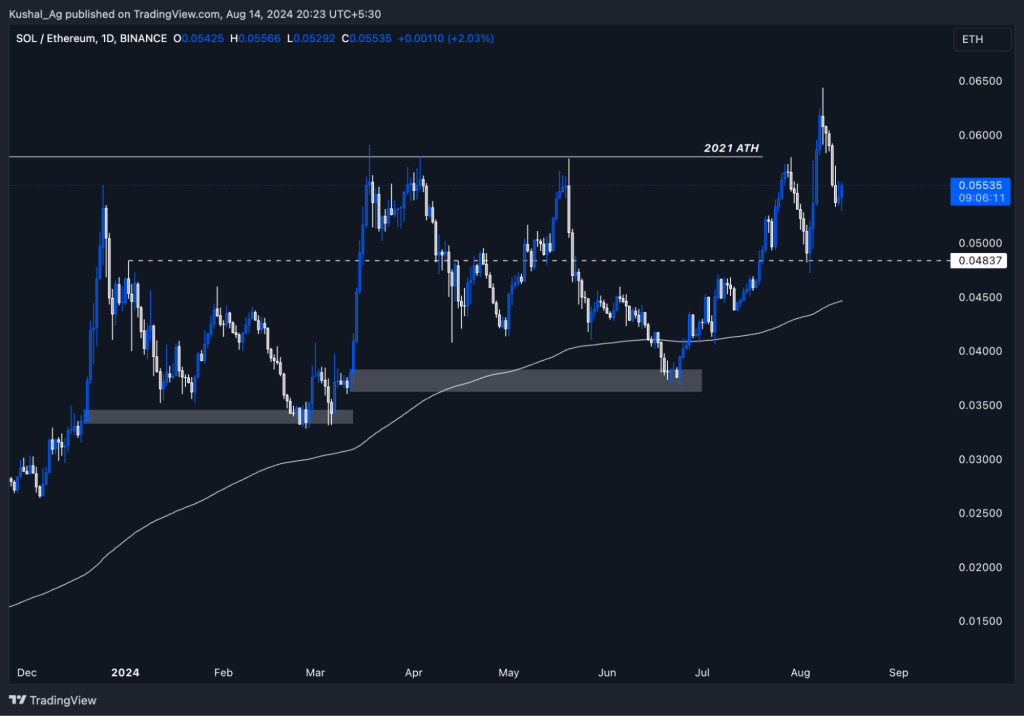
Conclusion
SOL/ETH is on the verge of a significant breakout, with a strong base at 0.05 and resistance at 0.058. A successful breach of this resistance could trigger a substantial rally, positioning SOL to achieve new highs.Disclaimer: This is not financial or investment advice. You are responsible for any capital-related decisions you make, and only you are accountable for the results.
What is Ethereum: Ethereum (ETH) is a groundbreaking decentralized platform that facilitates the creation and execution of smart contracts and decentralized applications (dApps) without the need for intermediaries. Launched by Vitalik Buterin in 2015, Ethereum's innovative blockchain technology enables a wide range of applications and has become a cornerstone of the decentralized finance (DeFi) space. Ethereum's ATH is $4,868.
How to buy ETH:
- Via Centralized Exchange (CEX):
- Select a CEX like Binance, Coinbase, or Kraken.
- Sign up and complete any verification processes.
- Deposit funds into your account.
- Go to the ETH trading section and purchase ETH.
ETH BTC ratio today: 0.057 resistance in focus, what's next?
14 August 2024ETH/BTC
Current state: On the weekly timeframe, ETH/BTC has been trading within a longstanding falling wedge, a pattern that typically precedes a reversal. Recently, the price has tested and liquidated zones below the lower end of the wedge, around the 0.04 level. This zone has acted as a significant support, but we have yet to see a clear reversal in this script.Key observations
- Support: The 0.04 area has provided substantial support, with liquidity being tested and absorbed in this region.
- Resistance: A break into the 0.045 area and a move back into the wedge would be a strong signal for ETH and the broader altcoin market.
- Potential scenario: Should ETH/BTC break back into the wedge, the 0.057 level is the next significant resistance that needs to be tested. A quick move to this level could indicate the first liftoff phase for meme coins and altcoins.
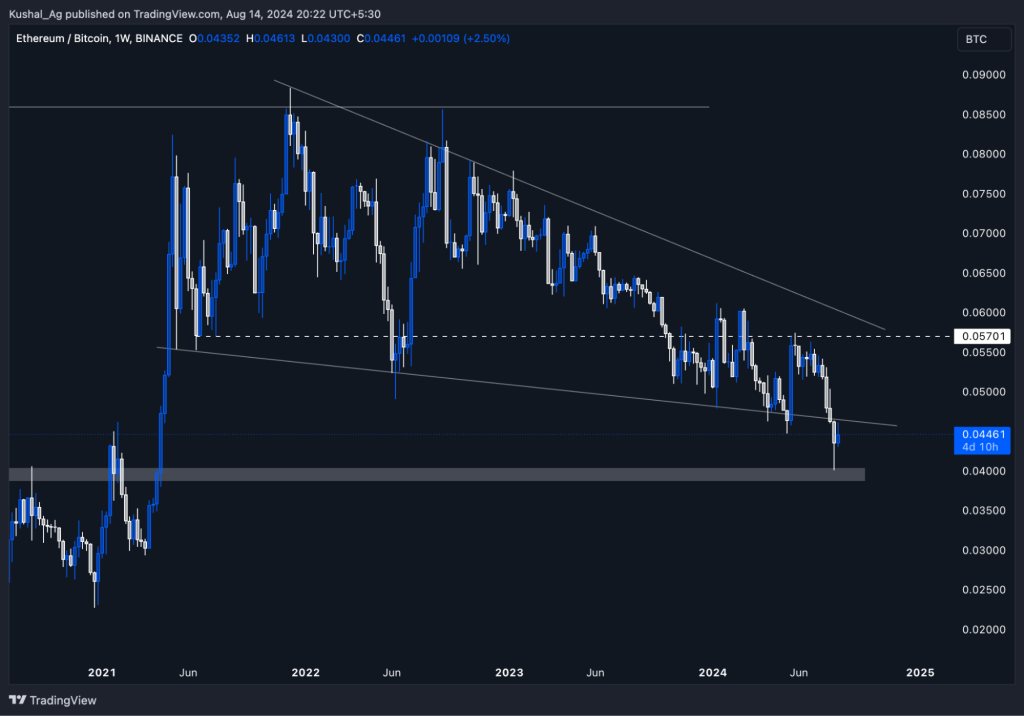
Conclusion
ETH/BTC is at a critical juncture, where a move back into the wedge and a test of the 0.057 level could ignite a broader rally across altcoins. This script serves as a key indicator of altcoin performance against BTC, and its movements will be essential to monitor in the coming days.Disclaimer: This is not financial or investment advice. You are responsible for any capital-related decisions you make, and only you are accountable for the results.
What is Bitcoin: Bitcoin (BTC) is the pioneering cryptocurrency introduced by the enigmatic Satoshi Nakamoto in 2008. It operates on a revolutionary decentralized ledger known as the blockchain and is widely regarded as digital gold due to its finite supply and secure, transparent nature. As the first and most recognized cryptocurrency, Bitcoin remains a cornerstone of the digital asset world.
Bitcoin's all-time high (ATH) is $75,757.
How to Buy:
- Via Centralized Exchange (CEX):
- Choose a CEX like Binance, Coinbase, or Kraken.
- Create and verify your account.
- Deposit fiat or other cryptocurrencies.
- Navigate to the BTC trading section and complete your purchase.
Is a $2,800 breakout or a $2,500 pullback next?
13 August 2024- Current State: ETH has been gradually pushing up, although it continues to underperform relative to BTC and other major alts. Currently, ETH is hovering around the 2650 level, showing some signs of stability but lacking the momentum to make a significant move higher.
- Key Observations:
- Resistance: The 2800 level remains a crucial resistance on the upside. Despite ETH's slow push upward, it has yet to break through this key level, which continues to act as a barrier to further gains.
- Potential Scenarios:
- Bullish Continuation: If ETH manages to gather momentum and break above 2800, it could signal the beginning of a stronger upward trend. However, given its current performance, this might require a significant catalyst.
- Bearish Scenario: A flush to the 2500 region could be on the cards if ETH decides to fuel in for another leg down anytime soon. This level would likely provide strong support, offering a potential buying opportunity for those looking to accumulate at lower levels.
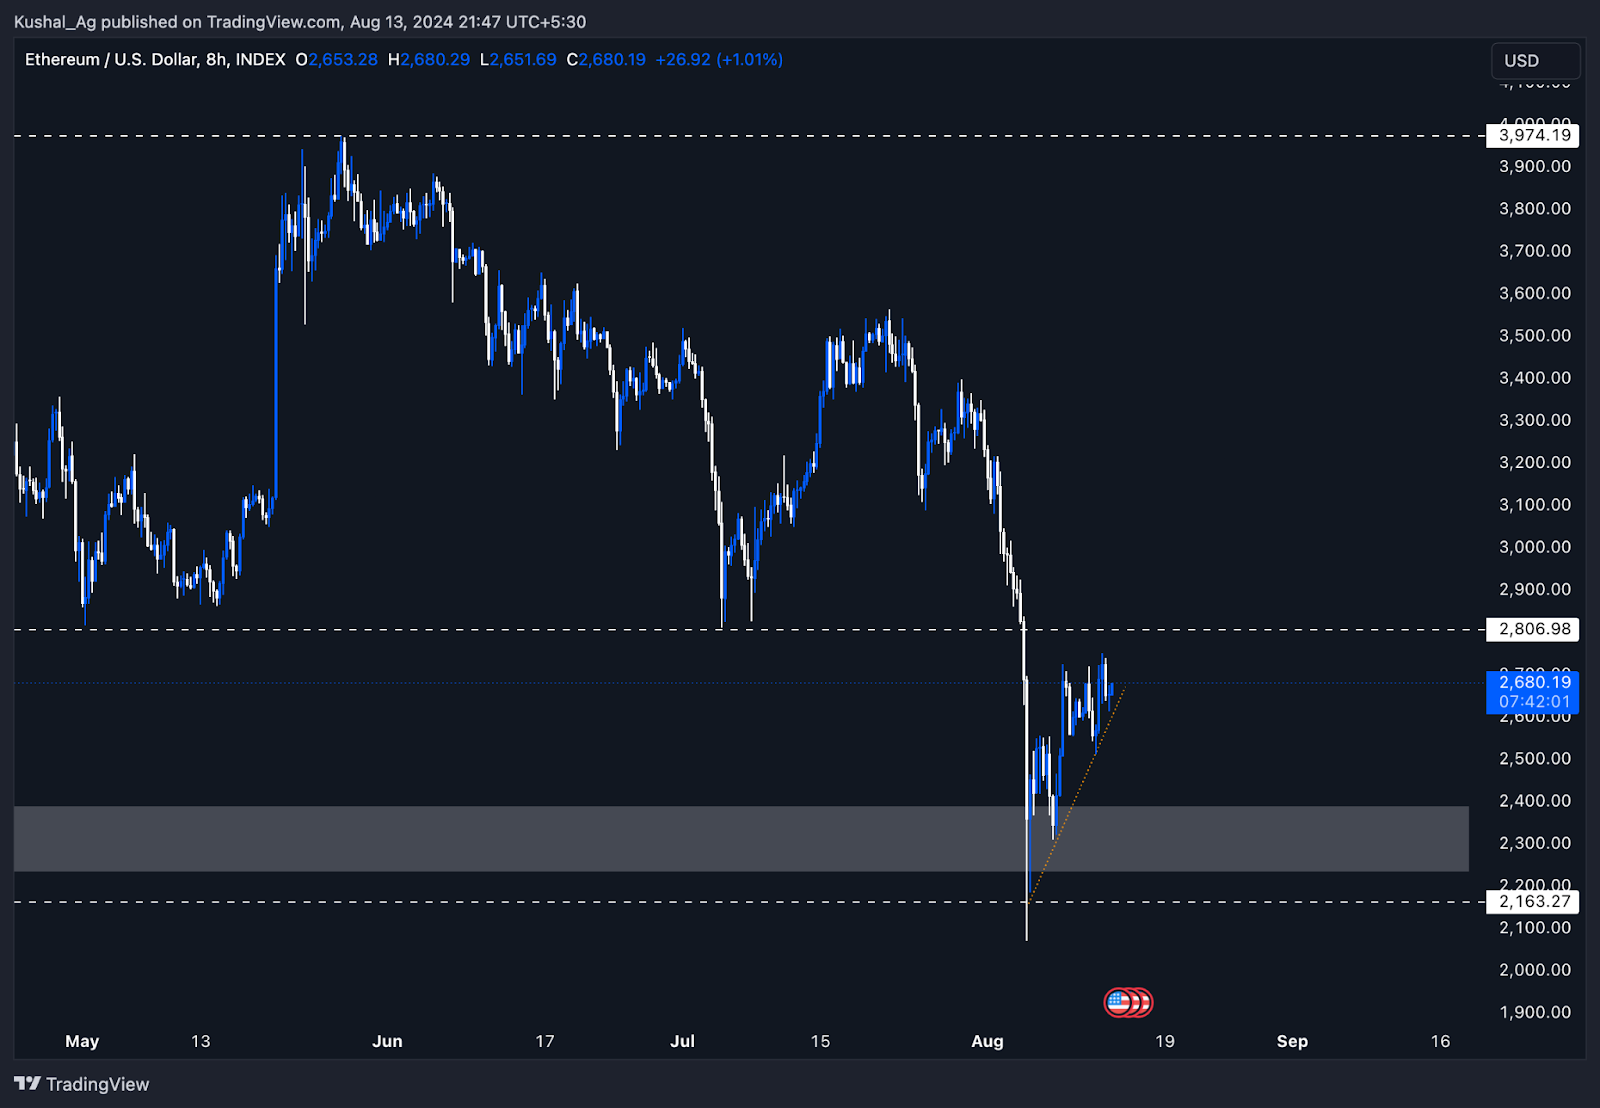
Can it surge past $2,875 resistance?
12 August 2024ETH's Funding Rate has essentially performed similarly to BTC, fluctuating between slightly negative to slightly positive over the last few days, indicating indecision amongst traders to go Long or Short.
ETH's Open Interest has also kicked up in the last 24 hours, however, it remains well below its highs. The excess leverage that was here has been flushed out and is reluctant to go back on - this is a positive sign.
ETH Open Interest:
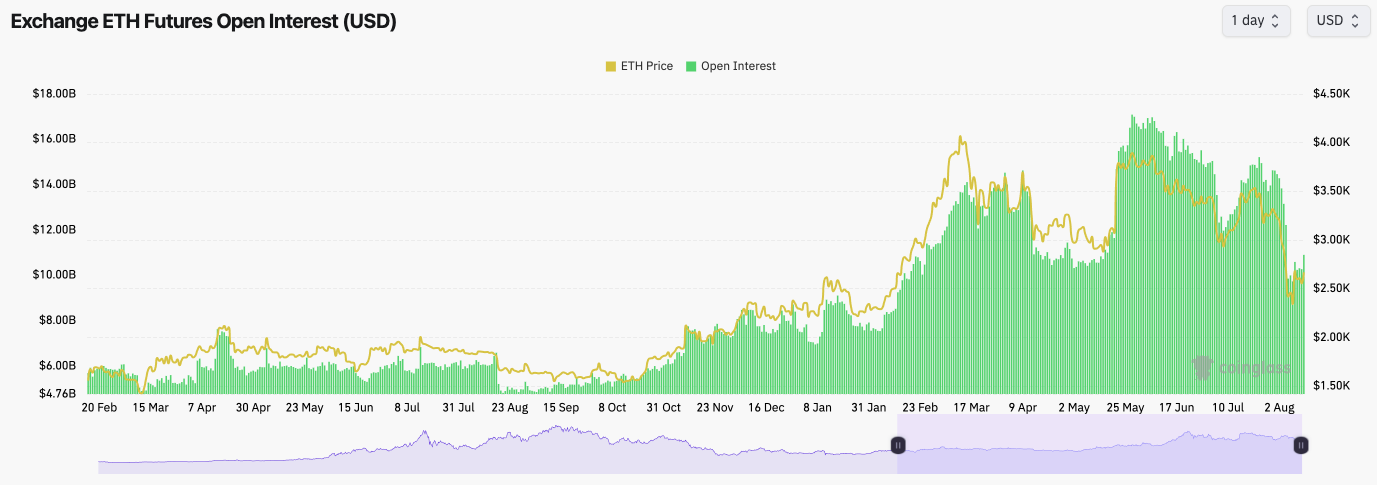
Disclaimer: This is not financial or investment advice. You are responsible for any capital-related decisions you make, and only you are accountable for the results.
Technical analysis
- ETH rejected at the local level of $2,700 but buyers stepped in at $2,500 and price is now squeezing back against $2,700.
- If ETH can break above $2,700, the short-term target is for price to retest the underside of the major horizontal resistance of $2,875. This resistance may prove too strong in the very short term.
- The RSI is at 40, meaning it's still quite low, so there is room for further upside in price.
- If ETH were to dip back to $2,400 we would expect that area to hold as support, and that price is likely to be a good entry for longer-term buys.
Cryptonary's take
The key for ETH here is to show some strength, push on, and retest $2,875, which we believe price can do in the coming days. The real signal will then be if ETH can break above $2,875. In the short term, we don't expect it to.Out of all the majors, ETH has sold off the most. With the introduction of the ETF and the potential for new buyers, ETH is quite attractively priced. Therefore, we would expect ETH to move higher here and retest $2,875 in the coming days.
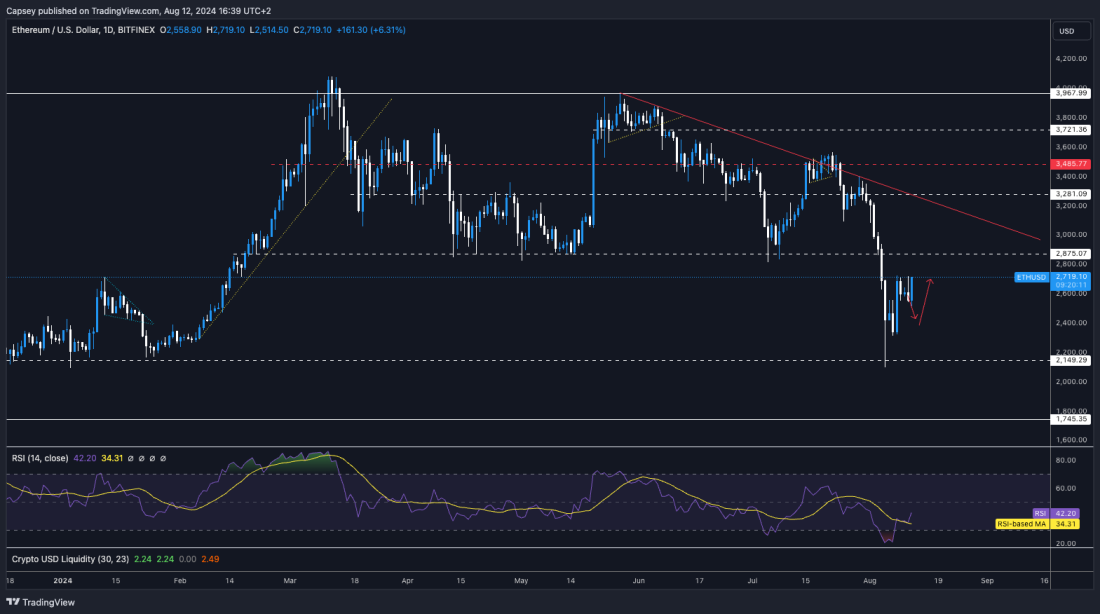
Will Ethereum surge past $2,200?
12 August 2024This article explores Ethereum's current price action and presents a strategic approach for long-term swing trading.
Please note: The video above is set to start at 02:02, featuring an in-depth technical analysis of Ethereum (ETH).
- Hypothesis: Ethereum is nicely positioned for a long-term swing trade. The price is currently magnetised around the 61.8% Fibonacci retracement of the recent bull market swing from the October lows to the recent highs. At the $2,200 level, we see a strong opportunity to build a position, as ETH could be undervalued at this point, especially considering its institutional interest and the ongoing competition with Solana.
- Key level: $2,200
- The play: Begin building a position within this price region. This could be done through spot buys or even using light leverage (e.g., 2x) to capitalise on this perceived undervaluation. Setting limit orders around this key level is also a viable strategy.

Will ETH hit a new high?
12 August 2024Ethereum presents a slightly different scenario compared to Bitcoin and Solana.
Please note: The video above is set to start at the 9-minute 52-second mark, featuring an in-depth technical analysis of Ethereum (ETH).
The asset has maintained a solid bullish structure, characterised by a series of higher highs and higher lows. This pattern suggests that Ethereum is poised for a significant move, potentially setting up for a new high in the coming months. We are particularly interested in the potential formation of a double bottom, which could serve as a strong entry point for a long-term swing trade.
Ethereum has shown resilience in the monthly time frame, holding above key support levels despite market-wide volatility. The asset's ability to sustain these levels reinforces our bullish outlook. We are closely monitoring Ethereum's price action, especially in the context of broader market conditions, as we believe it could offer substantial opportunities for traders in the near future.
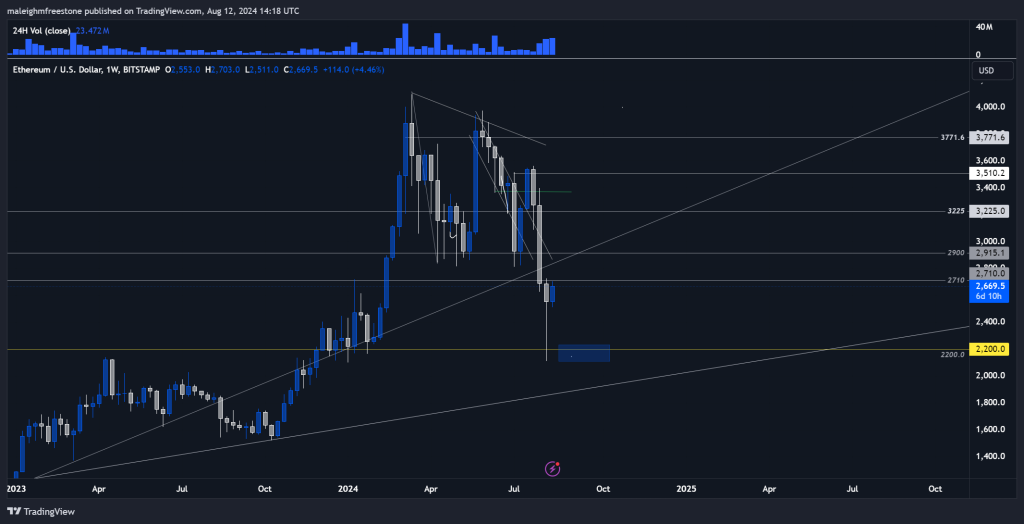
$2,400 bounce or pullback?
09 August 2024- ETH's Funding Rate is flat here, indicating there is a more even balance between Longs and Shorts.
- ETH's Open Interest significantly reset from $17.1b in late May to $9.7b yesterday. This is really healthy and needed resetting.
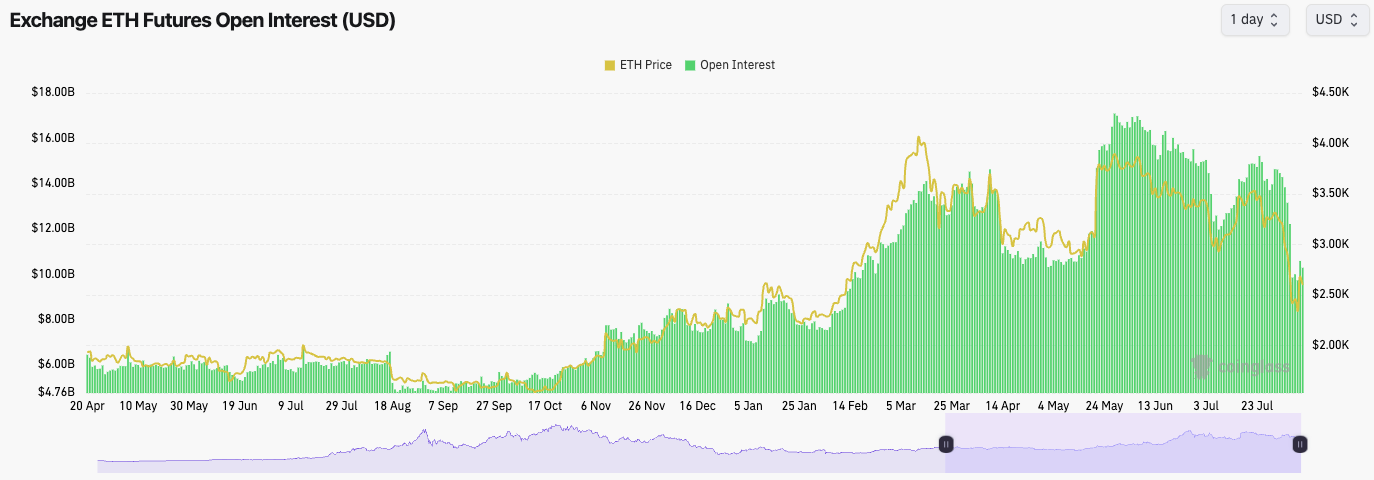
Technical analysis
- Having bounced off the horizontal support of $2,150, ETH isn't clearly forming a price formation yet.
- Price has bounced, having been majorly oversold, at 20 on the RSI, and we were right to call for a more significant bounce for ETH in our last Market Direction update because of this.
- Price has now hit the RSI-based moving average and has been seemingly rejected for now.
- Price also lies well below what's likely to be it's next major horizontal resistance of $2,875.
- If price were to pull back from here, and we think it can, then $2,400 is the area we'd eye to bid again.
Disclaimer: This is not financial or investment advice. You are responsible for any capital-related decisions you make,and only you are accountable for the results.
Cryptonary's take
So far, the recovery has been good in percent terms, but price still lies well below the levels it was trading at just weeks ago.The bounce play for ETH that we put out on Monday has played out well. However, it's now likely that price might pull back and retest $2,400 in the coming 2-4 days.
Anything under $2,400 is likely to be an area to bid on with the view of buying for a longer-term hold. We expect that over the next week or so, price will remain range-bound between $2,300 and $2,700.
We'd be surprised if price can claim back above $2,875 before Powell speaks at Jackson Hole towards the end of the month.

Is $2,200 the next ETH bounce?
09 August 2024Ethereum shows resilience after a sell-off, with key support at $2,200 offering a potential swing opportunity for traders.
Please note: The video above is set to start at the 06:39 minute mark, featuring an in-depth technical analysis of Ethereum (ETH). Ethereum has shown resilience after a significant sell-off, bouncing back within its established range. While this bounce is encouraging, it doesn't negate the possibility of further downside.
Our focus is on a key support level at $2,200, where we see a high probability swing opportunity. A small position with 2x or 3x leverage could be beneficial, particularly if ETH re-enters this lower range. The goal here would be to capitalise on a potential rebound back into the higher liquidity zones, offering a favourable risk-to-reward setup.
Disclaimer: This is not financial or investment advice. You are responsible for any capital-related decisions you make, and only you are accountable for the results.
Educationally, it's essential to recognise the importance of understanding market behaviour patterns. Ethereum's retracement to the 61.8% Fibonacci level, for example, is a classic technical setup that often leads to strong recoveries. By studying past price action and correlating it with current movements, traders can better anticipate future moves and make more informed decisions. Ethereum's previous retracement levels have led to substantial rallies, and if history repeats itself, there could be significant upside from the $2,200 level.
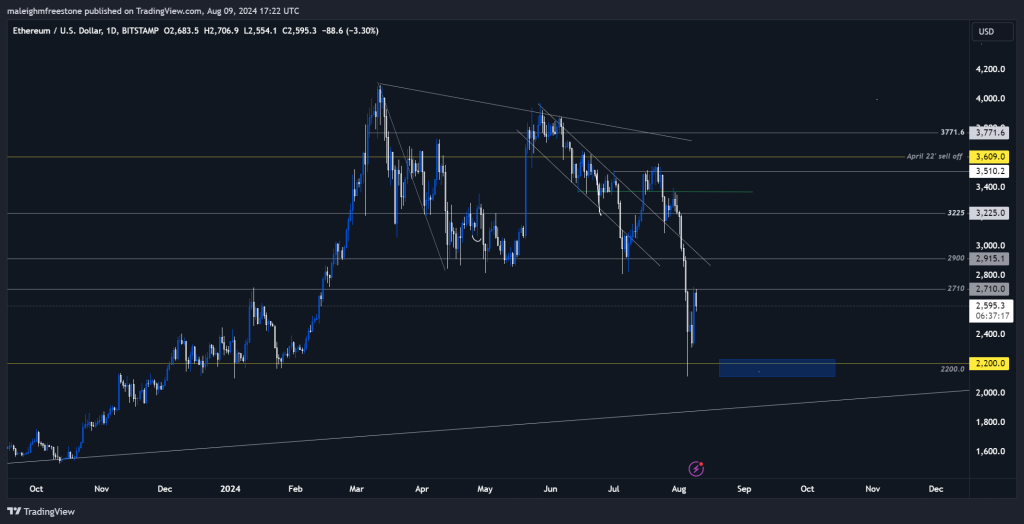
Is $2,200 the breakout level?
08 August 2024This article provides a comprehensive technical analysis of the current Ethereum (ETH) market trends.
Please note: The video above is set to start at the 8:32 minute mark, featuring an in-depth technical analysis of Ethereum (ETH).
Ethereum presents a compelling opportunity. It is currently trading at an attractive price point of around $2,200. This level falls within the 61.8% Fibonacci retracement, a key area for potential price reversals in bullish markets. With significant institutional backing and ongoing development, ETH remains a robust long-term investment.
Disclaimer: This is not financial or investment advice. You are responsible for any capital-related decisions you make, and only you are accountable for the results.
Our strategy for Ethereum involves considering a small leverage position to capitalise on the potential upside. Given the current market sentiment and ETH's historical performance, this approach could yield a substantial return as the market recovers. Monitoring liquidation levels and overall market health will be crucial in managing this position effectively.
Educational insight: Fibonacci retracement levels are essential technical analysis tools, helping identify potential reversal points during price corrections. The 61.8% retracement level, in particular, is often viewed as a strong support or resistance area. By incorporating these levels into our analysis, we can better anticipate market movements and structure our trades for optimal risk-reward outcomes.
Can ETH reclaim $2,875 and surge 25%?
06 August 2024A potential short squeeze for Ethereum (ETH) is suggested, with strong support levels identified between $2,150 and $2,380 and resistance at $2,875
Please note: The video above is set to start at the 07:03 timestamp, featuring an in-depth technical analysis of Ethereum (ETH) assets.
- Let’s start with ETH’s funding Rate. It’s currently negative, indicating that traders are paying a premium to be Short.
- Considering the RSI is the most oversold it’s been since August 2023; this looks ripe for a Short squeeze straightaway.
- The Open Interest has also substantially reset; again, this is another healthy sign.
- From the mechanics perspective, we’d steer clear of Shorting ETH. If anything, on any retests of the lows, we’d be strong buyers.
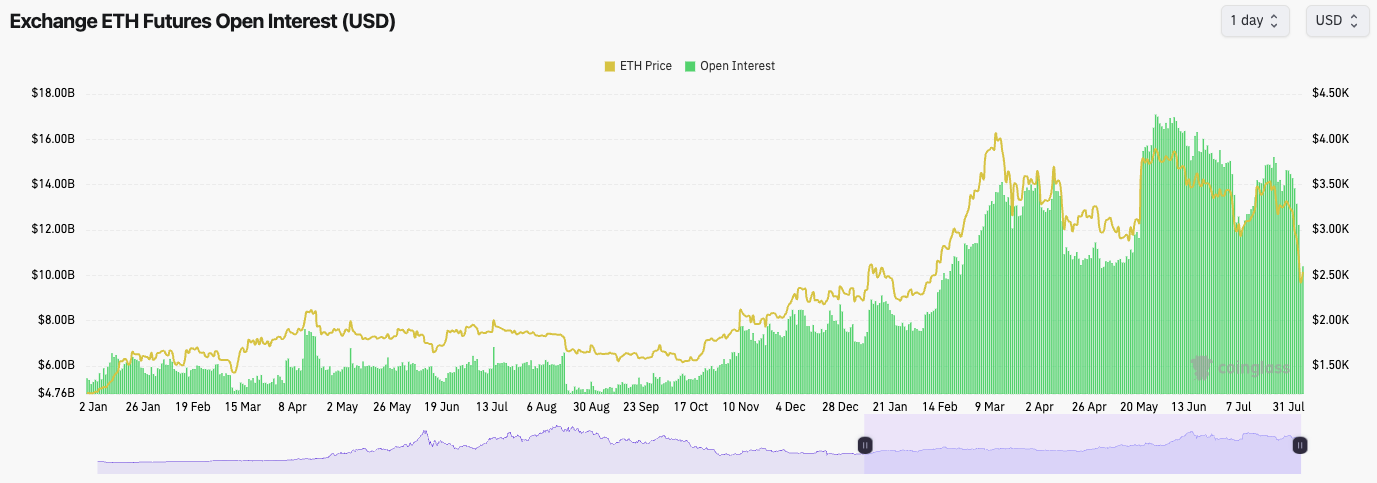
Technical analysis
- ETH smashed below the key $2,875 horizontal support, potentially aided by Jump Trading dumping their ETH.
- Price did find support at the old horizontal level of $2,150.
- We do note that the price is very oversold here, having printed at 21 on the RSI.
- Between $2,150 and $2,380 is likely to act as a strong support zone for ETH going forward.
- The major horizontal resistance and the key level ETH will need to reclaim is $2,875.
- Like BTC, we’ll need to see what kind of formation price forms. We will get more info on this as more days go by.
Cryptonary’s take
ETH, like BTC, will potentially be in a wider range between $2,150 and $2,875.ETH is very oversold here, and we’ve seen a significant leverage flush out that has now seen Shorts pile in and look quite offside. The potential outcome of this is a Short Squeeze in the near term. We do, however, expect the price to be range-bound (between $2,150 and $2,875) for some weeks, even if we get a Short Squeeze.
We would be aggressive buyers of ETH if it managed to retest the zone of support between $2,150 and $2,380. We’d even consider a low-leverage Long trade from that area. Ultimately, if the price were to pull back further (possibly to $2,150 to $2,380), we would see this as a big opportunity to buy ETH/add to ETH bags.
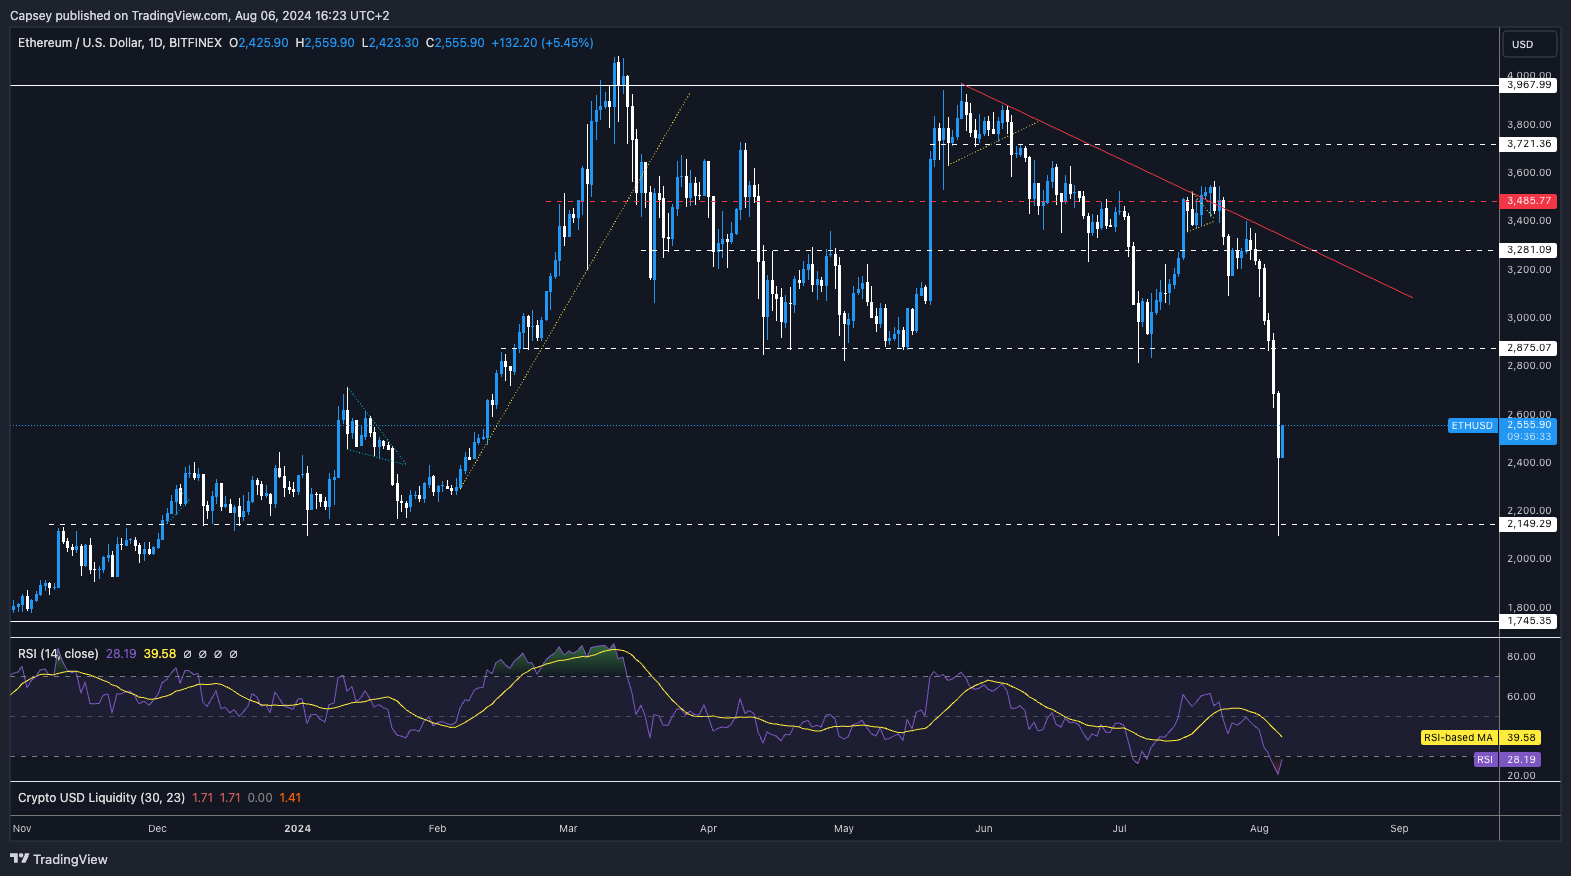
Will ETH surge to $3,500?
29 July 2024Ethereum enthusiasts, brace yourselves for a pivotal moment. While ETH might seem to be playing second fiddle to Bitcoin's recent surge, our analysis reveals a compelling narrative of tension and opportunity. With key resistance levels in sight and the Grayscale supply overhang nearing its end, is ETH coiling up for a spectacular breakout?
Market mechanics
ETH's Open Interest also increased on the last day from $13.9b to $14.9b; however, it remains well below the late May highs of $17.1b. This suggests that leverage traders are mostly looking elsewhere for trades rather than ETH.ETH's funding rate is also flat at 0.01%, indicating that the bias amongst traders is mostly long, but there is some short interest.
Expect volatility this week, with both sides likely to have turns at being flushed out/whipsawed.
Disclaimer: This is not financial or investment advice. You are responsible for any capital-related decisions you make, and only you are accountable for the results. "One Glance" by Cryptonary sometimes uses the RR trading tool to help you quickly understand our analysis. These are not signals, and they are not financial advice.
ETH Open Interest: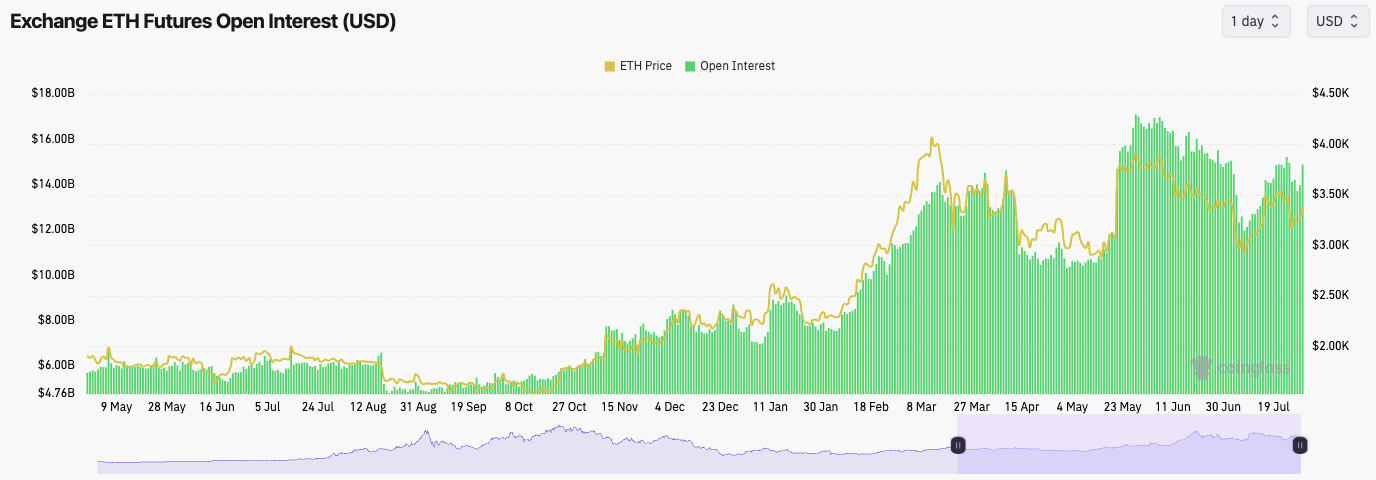
Technical analysis
- ETH was rejected at the horizontal resistance of $3,485 and the main downtrend line.
- However, price found support at $3,100, swiftly climbing back up and reclaiming the local horizontal support of $3,280.
- Price is now once again retesting the main downtrend line, but it remains below the main horizontal resistance of $3,485.
- ETH is at a key inflexion point. A Bitcoin breakout this week could finally help ETH get the major breakout it's been looking for.
- The RSI is in the middle territory, so this doesn't provide any headwinds for price in the short term.
Cryptonary's take
In terms of risk/reward for a trade, ETH perhaps looks better than Bitcoin here simply because its price hasn't increased like that of BTC. However, we do note ETH's general weakness, as it seems to be outperformed by the other majors. However, we do expect that once the Grayscale supply overhang ends, ETH can grind higher.We wouldn't look to scale into any big Long trades here, but we're happy to sit on our ETH Spot positions, and we expect to substantially increase in value over the coming months. We're just staying patient on ETH here.
If we were looking for a degen play, a potential Long from $3,280 (assuming we get a retest) could be the play. But we'd keep the Stop Loss wide and give the trade room to allow for volatility.
Ethereum ETF: Key resistance levels and market dynamics
24 July 2024Ethereum faces its own challenges as it battles key resistance levels amid the launch of spot ETFs.
Market mechanics
Like Bitcoin's Open Interest (amount of leverage), ETH's Open Interest has also risen since the price lows in early July.Unlike Bitcoin's, ETH's funding rate is quite positive, meaning that most of the Open Interest that has gone on is long. This potentially opens the door for a flush out in price = price lower.
Technical analysis
- ETH is still battling to break out from the downtrend line; however, it is also battling at the horizontal resistance of $3,485. These two levels together provide a sticking point for ETH here.
- To the upside, the $3,720 is the main resistance to clear in the short term.
- To the downside, the level to hold for price is the horizontal support at $3,280. We're expecting a move down to retest this level.
- The RSI is still in clean territory at 54, neither overbought nor oversold. From this perspective, there are no worries.
Cryptonary's take
With the ETH ETF going live and with Open Interest ramping up going into it, especially with the majority of this being Longs, ETH could be vulnerable to a pullback here unless the ETF inflows are super strong.The overall setup here isn't as positive today as it was a week ago, given we've had a potential breakout of the downtrend line, which is struggling to see momentum, and now we have a large buildup of Open Interest.
The most likely outcome in the short term is a retest of $3,280, but we think the price could bounce from that level.
ETH has broken to the downside. What's next?
23 January 2024Mechanics-wise, ETH has reset in the last few days.
The Funding Rate has remained at 0.01%, indicating that there isn't an overweighting in positioning between Longs and Shorts, so the problem wasn't here.
The issue (or the aspect) we didn't like was in the Open Interest, which still remained high.
However, in the past three days, OI has gone from $7.95b down to $7.34b, having put a high in a week ago at $8.44b.
For ETH to have a healthy leverage market, it was important to see this OI come down, which it has now done as price has moved lower.
Technical analysis
- Price initially rejected at the horizontal resistance of $2,700.
- Price then formed a descending wedge, which usually has a bias to break to the upside. However, this one didn't, seeing a severe breakdown.
- Unfortunately, the $2,340 horizontal level that was prior resistance, we had hoped that it would hold as new support. However, price has fallen straight through it, now fitting a local support at $2,200.
- There is another horizontal support at $2,133.
- The RSI on the 4hr is heavily oversold, while the 12hr has also entered oversold territory.
- The yellow box between $1,979 and $2,053 would be the place to add Long orders again.
Cryptonary's take
ETH has lost some key levels on the way down, the $2,340 level being the key one.We may see a short-term relief bounce here because ETH is quite oversold.
However, now that key structures are broken, ETH's price will likely head to the yellow box in the coming weeks.
That's where we'd be interested in adding long-term buy orders again.
ETH needs to hold $2,340 to prevent a slide lower
19 January 2024Looking at the mechanics, ETH presents another healthy setup, similar to BTC.
The Funding rate is at 0.01%, and Open Interest is down from its highs.
There is no heavy overweighting here or too much leverage, so it is all good from this point of view.
Technical analysis
- For a long time, we had identified the $2,340 horizontal level as a key level of resistance, and if broken to the upside, ETH would flip it into new support.
- Price broke above $2,340 and immediately tested the $2,640 horizontal level we had outlined for weeks as a possible major resistance.
- Price was then rejected at $2,640, as we predicted.
- ETH is now forming a descending triangle, which usually has a bias to break to the upside.
- If price does break down more meaningfully, this is where the $2,340 level will become important again. Ideally, to maintain a continued bullish structure (from a zoomed-out viewpoint), $2,340 would need to hold as new support.
Cryptonary's take
$2,430 could be a local bottoming area for ETH that would maintain the formation of the descending triangle, and then, ETH could break upwards from there.Ultimately, if there is more downside, $2,340 will need to hold as support. If not, $2,133 could come into the picture again.
If price breaks down and re-enters into the old range between $2,133 and $2,340, this would be a good zone to continue DCA'ing into for the long term – 12 to 18 months from today.
Is Ethereum's ETF narrative starting to gain ground?
15 January 2024ETH is interesting here.
From the mechanics’ perspective, Funding is flat like most other coins - around the 0.01% mark, so it is healthy with neither Longs nor Shorts getting out of hand here.
However, the Open Interest is close to highs, indicating that more leveraged positions have opened in the past week. Perhaps traders are rotating capital from BTC into ETH to move into a new ETF narrative.
Technical analysis
- For weeks, we have hoped that ETH could make a more meaningful breakout of $2,340 and establish itself in a new, higher range between $2,340 and $2,640. It looks like we've now gotten that move.
- However, ETH has rejected into the range between the main horizontal resistance of $2,640 and the local resistance of $2,740
- We now want to see $2,340 to $2,400 become the new range of horizontal support for ETH's price. If the price were to retest this area, it could be the new area to DCA ETH.
- The RSI on the 3D and the Weekly are both beginning to push into overbought territory, although they can both still run further - this is not something to worry us for now.
Cryptonary's take
ETH may outperform in the coming months in the build-up to an ETF decision in the summer, similar to how the BTC ETF decision was front-run.It's positive that ETH is now trading in a higher range (between $2,340 and $2,640).
We look to continue DCA'ing into ETH sub $2,400 into $2,340, where we'd expect the price to find support in this range.
Even if there is a more general market pullback or consolidation period over the coming month or two, ETH looks like one of the frontrunners that will outperform.
ETH may outperform the rest of crypto in the short term
12 January 2024Finally, ETH records a really nice move higher in price.
When looking at the mechanics, Open Interest has moved up drastically, however Funding has remained relatively low, suggesting there isn't an over crowding in one direction or another.
Technical analysis
- Finally, ETH has a break above the horizontal resistance of $2,340, and the price moved straight up to the next resistance at $2,640.
- It's now important for price to establish itself in this higher range between $2,340 and $2,640.
- The local resistance to the upside is $2,740. Ideally, we'd like to see price hold these highs.
- The RSI has moved into overbought territory on all major timeframes but only on the 3D and Weekly, so this shouldn't concern us for now.
Cryptonary's take
With an ETF for ETH likely to be pushed in the summer, it's possible that yesterday was the first day we've seen a rotation from BTC into ETH as the narrative swaps over.Even though our short-term expectation is for a pullback in the broad crypto market, we feel ETH may outperform during that pullback.
We were strongly convinced that the low $2,100s was a good long-term buying zone for ETH, with many opportunities presented to buy at this price over the past few months.
Price is now up 20% from there. For now, we continue to hold Spot ETH happily. If ETH dips to the low $2,400s, we'd consider adding further buys there.
For now, though, we are sitting patiently and holding because we think ETH can be a good performer over the coming months, even if the wider market underperforms.
ETH will still soar, but it remains rangebound for now
08 January 2024ETH is really clean from a mechanics perspective; OI is down approximately 20% from the highs, while Funding is low at 0.01%.
This indicates a healthy market with the potential for further upside in prices.
Technical analysis
- Mostly range bound for now. But it is in a really key range.
- The main horizontal support is $2,133, and the resistance is still at $2,340.
- If price can break above $2,340 and then the prior price top of $2,410, then we can move to $2,640. We see this as unlikely, even on an ETF pump.
- If the $2,133 support is lost, the new range will be $1,933 to $2,133. Long-term, this is a good DCA buying area.
- The RSI is clean on all major timeframes. Nothing to be wary of here.
Cryptonary's take
Once ETH begins to move, it will move significantly because this is just a narrative flip. Unfortunately, we are not expecting that in the next 2-4 weeks.Perhaps as we move into Q2, and the ETH ETFs are being discussed (although we are not sure they'll be approved), ETH may begin to climb higher and finally break out of $2,400.
For now, the play is to continue holding ETH and look to continue accumulating below $2,133 if given the opportunity.
ETH may need help from BTC to break out
04 January 2024Again, the mechanics reset nicely on ETH, as with the rest of the market, so we're clean from this perspective now and good to go higher from this viewpoint.
There’s no longer excess leverage and overcrowded Longs in the market.
In crypto, going against the consensus is usually a decent idea, particularly in times of fear or greed.
Technical analysis
- Initially, ETH looked good, getting above $2,340 and using it briefly as support. Just unfortunate that it broke below.
- $2,130 has held as the major support.
- ETH is now entering a key range that could provide resistance between $2,260 and $2,320. Beyond that, the major resistance is $2,340. All of these need to be broken to the upside.
- The current resistance zone may provide too much local resistance for price. We'll likely need a positive BTC ETF decision to get the ETH breakout.
- The RSI is clean; no major timeframe is overbought, so this is a positive for ETH in terms of further upside.
Cryptonary's take
ETH continues to struggle and underperform.Currently, there is this local resistance box between $2,260 and $2,320.
We feel that ETH may struggle to clear this zone imminently, and maybe only a positive ETF decision will allow ETH to break out.
Currently, the volume on the buy side is really low also. That will need to increase much more if ETH wants to see a breakout.
For now, we are holding tight to our ETH, as we think it can perform well from Q2 onwards and will look to accumulate lower down - sub $2,130 if we're given it.
Is ETH getting ready for its overdue move-up?
02 January 2024ETh is really in a positive position to have reclaimed the uptrend again, along with the $2,340 horizontal resistance.
Open interest is still not at scarily elevated levels. However, Funding is massively positive.
Again, this is okay for now while there is a supporting Spot bid.
However, if that Spot bid goes (again, potentially post BTC ETF decision), there can be a flush out of over-levered Longs.
Technical analysis
- ETH has overcome the $2,340 prior horizontal resistance. Price will need to flip this level into new support. If it can, this is mid-term bullish for ETH, and we can see more sustained upside.
- $2,320 to $2,340 is a major area of support.
- $2,640 is the next horizontal resistance.
- The RSI is clean, with no major timeframes in overbought territory, although the 3D and Weekly are close.
Cryptonary's take
ETH looks really clean here; it is perhaps one of the more favoured setups.If we were desperate to Long, we'd choose ETH over BTC, even though the Funding is ridiculously high.
However, the lack of performance so far would concern us if it was another coin, but since it’s ETH, we are not really concerned. It only likely means the performance will come later.
Now that ETH has seemingly cleared above $2,340, this opens the door for a move to $2,640 in the short term.
Recommended from Cryptonary


